
Key Insights
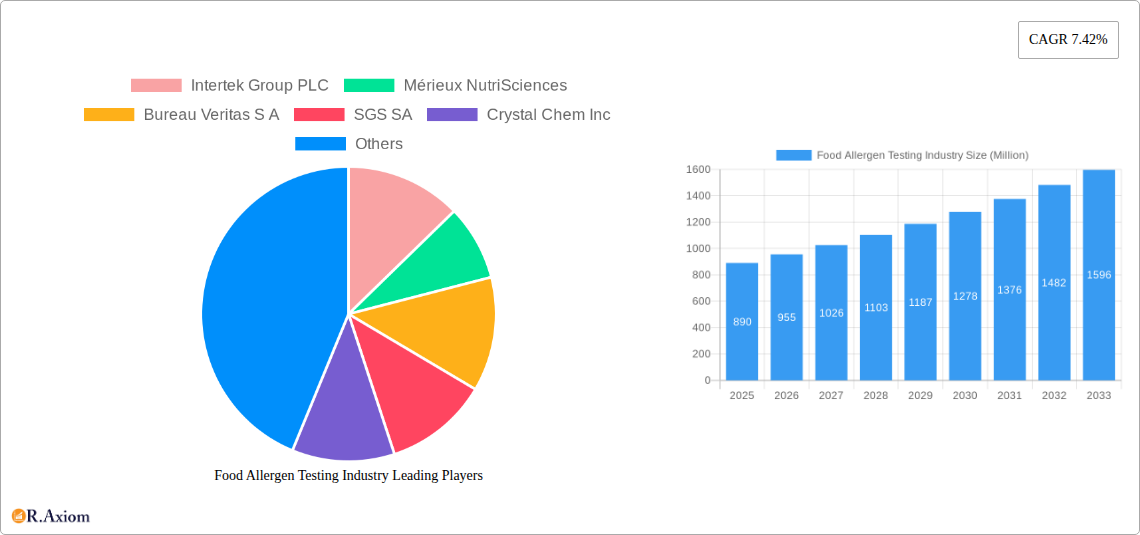
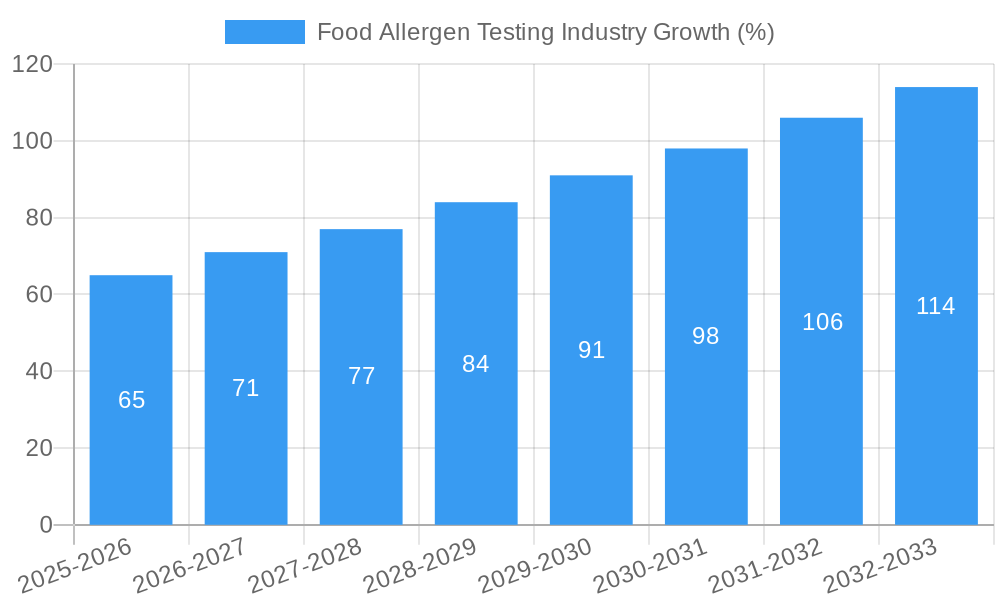
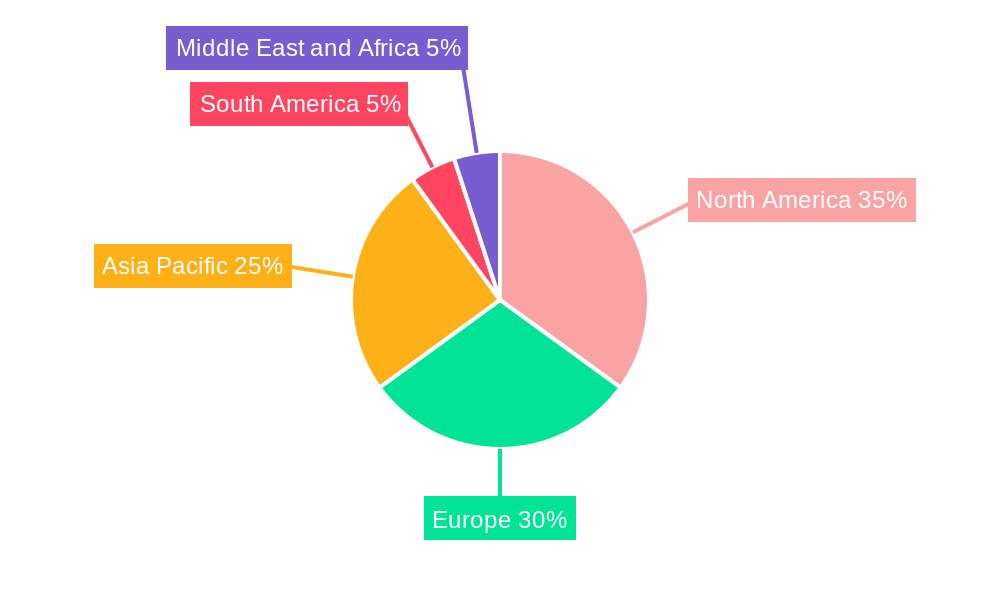
The global food allergen testing market, valued at $0.89 billion in 2025, is projected to experience robust growth, driven by stringent food safety regulations, increasing consumer awareness of allergies, and the rising prevalence of food allergies globally. The market's Compound Annual Growth Rate (CAGR) of 7.42% from 2019-2024 indicates a consistent upward trajectory, expected to continue through 2033. Key growth drivers include the expanding food processing industry, particularly in developing economies, and the increasing demand for accurate and rapid allergen detection methods. The seafood and meat products segment currently dominates application-wise, followed by dairy and bakery products, reflecting the high allergenic potential of these food groups. Technological advancements, including the adoption of more sensitive and efficient ELISA and PCR-based tests, are further fueling market expansion. However, factors such as the high cost of testing and the potential for false positives can act as market restraints. The competitive landscape comprises both large multinational corporations, like Intertek, Mérieux NutriSciences, and Eurofins Scientific, and smaller specialized companies, leading to innovation and a diverse range of testing services. Geographic distribution shows strong performance in North America and Europe, driven by established regulatory frameworks and high consumer awareness. Asia-Pacific is expected to witness significant growth in the coming years fueled by rising disposable incomes and increasing demand for processed food.
The future of the food allergen testing market hinges on continued technological innovation, particularly in developing faster, cheaper, and more portable testing solutions suitable for on-site applications. Increased regulatory stringency globally will further drive demand. Market players are expected to focus on strategic partnerships, acquisitions, and product diversification to enhance their market share and cater to the evolving needs of food manufacturers and regulatory bodies. The increasing focus on personalized nutrition and the development of allergen-free products will create new opportunities within the market. While challenges like cost and potential for false positives persist, the overall market outlook remains positive, indicating substantial growth potential in the coming decade.
Food Allergen Testing Industry Market Report: 2019-2033
This comprehensive report provides a detailed analysis of the global food allergen testing industry, covering market size, growth drivers, competitive landscape, and future outlook. The study period spans from 2019 to 2033, with 2025 serving as the base and estimated year. The report offers actionable insights for industry stakeholders, including manufacturers, laboratories, regulatory bodies, and investors. The global market value is projected to reach xx Million by 2033.
Food Allergen Testing Industry Market Concentration & Innovation
The food allergen testing market exhibits a moderately concentrated structure, with several multinational players dominating the landscape. Key players such as Intertek Group PLC, Mérieux NutriSciences, Bureau Veritas S A, SGS SA, and Eurofins Scientific SE hold significant market share, driven by their extensive global network, advanced testing capabilities, and strong brand reputation. The market share of these top five players is estimated at xx%, with the remaining share distributed among numerous smaller regional and specialized laboratories.
Innovation is a crucial driver in this sector, spurred by increasing consumer awareness of food allergies, stricter regulatory requirements, and the demand for faster, more accurate, and cost-effective testing methods. Key innovation areas include the development of advanced technologies like PCR-based testing and multiplex assays, enabling the simultaneous detection of multiple allergens. The regulatory landscape plays a vital role, with bodies like the FDA and EFSA driving the adoption of standardized methods and stringent quality controls.
Mergers and acquisitions (M&A) have played a substantial role in shaping the market, particularly in expanding geographical reach and broadening testing capabilities. For example, the acquisition of York Analytical Laboratories and Wessling Holding GmbH & Co. by ALS Limited in 2024 significantly enhanced its global footprint. While precise M&A deal values are not consistently available publicly for all transactions, recent significant acquisitions have averaged in the range of xx Million. Product substitutes, such as improved ingredient labeling, are limited in their ability to replace the essential role of allergen testing in ensuring food safety. End-user trends indicate a growing demand for transparency and traceability in the food supply chain, further driving the adoption of sophisticated allergen testing methods.
Food Allergen Testing Industry Industry Trends & Insights
The food allergen testing market is experiencing robust growth, driven by several key factors. The rising prevalence of food allergies globally is a primary catalyst, pushing demand for reliable testing. Stringent regulatory frameworks mandating allergen testing in various food products contribute significantly to market expansion. Technological advancements, including the development of more sensitive and rapid testing methods, such as ELISA and PCR-based assays, are further enhancing market growth. Consumer awareness of food allergies and associated health risks is also increasing, leading to heightened demand for allergen-free food products, thereby impacting the need for comprehensive testing.
The market has witnessed a considerable shift toward automation and high-throughput technologies, improving efficiency and reducing testing times. This trend is shaping the competitive landscape, with leading companies investing heavily in R&D to stay ahead of the curve. The competitive dynamics are characterized by intense rivalry among established players, fostering innovation and driving down costs. The Compound Annual Growth Rate (CAGR) for the food allergen testing market is projected to be xx% during the forecast period (2025-2033), with market penetration expected to reach xx% by 2033. This growth is influenced by increasing consumer demand for safer food products, stringent regulations, and technological innovations.
Dominant Markets & Segments in Food Allergen Testing Industry
Leading Region/Country: North America currently dominates the global food allergen testing market, driven by high consumer awareness, stringent regulatory standards, and a well-established food processing industry. Europe is another significant market, experiencing substantial growth due to similar factors.
Dominant Application Segments: The demand for food allergen testing is significant across various segments. Baby food and infant formula display the highest growth rate, given the extreme sensitivity of this product category to allergen contamination. Seafood and meat products, dairy products, and bakery and confectionery items also represent substantial market segments due to their higher propensity for allergen presence. The growth is driven by strong consumer awareness and strict regulations.
Dominant Technology Segments: Immunoassay-based methods, particularly ELISA, currently hold the largest market share due to their established reliability, cost-effectiveness, and ease of use. However, PCR-based testing is gaining traction due to its superior sensitivity and ability to detect trace amounts of allergens. This segment is expected to see significant growth in the coming years. Factors driving the dominance include affordability, established infrastructure, and ease of use for ELISA. For PCR, it's the superior sensitivity and the ability to detect a wider range of allergens.
Key drivers for the dominance of specific segments include stringent regulatory requirements for allergen labeling and consumer demand for safe and transparent food products. Economic policies supporting food safety standards and investments in testing infrastructure also play a significant role.
Food Allergen Testing Industry Product Developments
Recent years have witnessed significant advancements in food allergen testing technologies. The development of rapid, sensitive, and high-throughput assays has improved accuracy and reduced turnaround times. Notable innovations include the development of multiplex assays that can simultaneously detect multiple allergens, and portable testing devices that allow on-site testing. These innovations cater to the increasing demand for efficient and cost-effective solutions in the food industry. The competitive advantage lies in offering faster, more accurate, and reliable testing methods along with flexible and scalable services to cater to the diverse needs of the food industry. Gold Standard Diagnostics' SENSIStrip Gluten PowerLine Lateral Flow Device, launched in March 2024, exemplifies this trend with its highly sensitive detection system.
Report Scope & Segmentation Analysis
This report segments the food allergen testing market by application (Seafood and Meat Products, Dairy Products, Beverages, Bakery and Confectionery, Baby Food and Infant Formula, Other Applications) and technology (Immunoassay-based/ELISA, PCR-based, Other Technologies). Each segment is analyzed in terms of market size, growth rate, and competitive dynamics. The report provides detailed market size and growth projections for each segment, offering a comprehensive understanding of the market landscape. Competitive dynamics within each segment are examined, highlighting key players and their strategies. The growth rate and projected market size vary across segments, reflecting the specific needs and regulatory environments of each food category.
Key Drivers of Food Allergen Testing Industry Growth
Several factors fuel the growth of the food allergen testing industry. The increasing prevalence of food allergies necessitates stringent testing protocols to ensure food safety. Stringent government regulations concerning allergen labeling and food safety standards mandate the use of accurate and reliable testing methods. Technological advancements, particularly the development of more rapid and sensitive testing methods, enhance testing efficiency and accuracy, stimulating industry growth. Consumer demand for transparent and safe food products also boosts the market.
Challenges in the Food Allergen Testing Industry Sector
Despite the market's growth potential, certain challenges hinder its progress. High testing costs can be a barrier for smaller food manufacturers, particularly in developing countries. The complexity of allergen detection in complex food matrices necessitates sophisticated and sometimes expensive technologies. Maintaining consistent quality control across various testing labs is crucial but presents logistical and technical hurdles. Keeping up with evolving regulatory landscapes and standards also poses a significant ongoing challenge.
Emerging Opportunities in Food Allergen Testing Industry
The development of point-of-care testing devices holds significant potential, enabling quick and convenient allergen testing at various points in the food supply chain. The rising demand for personalized nutrition and tailored dietary plans creates opportunities for targeted allergen testing solutions. The expansion into emerging markets with growing food processing industries presents significant growth avenues. Developing advanced diagnostic tools for detecting novel and emerging allergens will further shape industry expansion.
Leading Players in the Food Allergen Testing Industry Market
- Intertek Group PLC
- Mérieux NutriSciences
- Bureau Veritas S A
- SGS SA
- Crystal Chem Inc
- Lifeasible
- ALS Limited
- Microbac Laboratories Inc
- Eurofins Scientific SE
- Neogen Corporation
Key Developments in Food Allergen Testing Industry Industry
- March 2024: Gold Standard Diagnostics launched the SENSIStrip Gluten PowerLine Lateral Flow Device, a sensitive gluten detection system. This launch expands the available testing options and potentially improves testing efficiency.
- March 2024: ALS Limited expanded its European and USA Life Sciences presence through acquisitions, strengthening its market position and geographical reach. This expansion enhances the company's capacity for food allergen testing.
- February 2024: Mérieux NutriSciences opened a new food analysis laboratory in Brazil, increasing testing capacity and furthering food safety efforts in the region. This improves testing accessibility and bolsters the industry presence in Brazil.
Strategic Outlook for Food Allergen Testing Industry Market
The food allergen testing market is poised for continued growth, driven by increasing food allergy prevalence, stringent regulations, technological advancements, and rising consumer awareness. The focus on developing faster, more accurate, and cost-effective testing methods will shape future market dynamics. Expansion into emerging markets and the development of novel testing technologies will create significant opportunities for growth. Companies investing in R&D and strategic partnerships are well-positioned to capitalize on the industry's expanding potential.
Food Allergen Testing Industry Segmentation
-
1. Technology
- 1.1. Immunoassay-based /ELISA
- 1.2. PCR (Polymerase Chain Reaction)-based
- 1.3. Other Technologies
-
2. Application
- 2.1. Seafood and Meat Products
- 2.2. Dairy Products
- 2.3. Beverages
- 2.4. Bakery and Confectionery
- 2.5. Baby Food and Infant Formula
- 2.6. Other Applications
Food Allergen Testing Industry Segmentation By Geography
-
1. North America
- 1.1. United States
- 1.2. Canada
- 1.3. Mexico
- 1.4. Rest of North America
-
2. Europe
- 2.1. Germany
- 2.2. United Kingdom
- 2.3. France
- 2.4. Russia
- 2.5. Spain
- 2.6. Italy
- 2.7. Rest of Europe
-
3. Asia Pacific
- 3.1. India
- 3.2. China
- 3.3. Japan
- 3.4. Australia
- 3.5. Rest of Asia Pacific
-
4. South America
- 4.1. Brazil
- 4.2. Argentina
- 4.3. Rest of South America
-
5. Middle East and Africa
- 5.1. South Africa
- 5.2. Saudi Arabia
- 5.3. Rest of Middle East and Africa
Food Allergen Testing Industry REPORT HIGHLIGHTS
| Aspects | Details |
|---|---|
| Study Period | 2019-2033 |
| Base Year | 2024 |
| Estimated Year | 2025 |
| Forecast Period | 2025-2033 |
| Historical Period | 2019-2024 |
| Growth Rate | CAGR of 7.42% from 2019-2033 |
| Segmentation |
|
Table of Contents
- 1. Introduction
- 1.1. Research Scope
- 1.2. Market Segmentation
- 1.3. Research Methodology
- 1.4. Definitions and Assumptions
- 2. Executive Summary
- 2.1. Introduction
- 3. Market Dynamics
- 3.1. Introduction
- 3.2. Market Drivers
- 3.2.1. Increasing Incidences of Food Allergies; Favorable Government Initiatives and Regulations for Food Safety
- 3.3. Market Restrains
- 3.3.1. Inconsistencies Involved in Food Allergen Declarations
- 3.4. Market Trends
- 3.4.1. Increasing Prevalence of Food Allergies
- 4. Market Factor Analysis
- 4.1. Porters Five Forces
- 4.2. Supply/Value Chain
- 4.3. PESTEL analysis
- 4.4. Market Entropy
- 4.5. Patent/Trademark Analysis
- 5. Global Food Allergen Testing Industry Analysis, Insights and Forecast, 2019-2031
- 5.1. Market Analysis, Insights and Forecast - by Technology
- 5.1.1. Immunoassay-based /ELISA
- 5.1.2. PCR (Polymerase Chain Reaction)-based
- 5.1.3. Other Technologies
- 5.2. Market Analysis, Insights and Forecast - by Application
- 5.2.1. Seafood and Meat Products
- 5.2.2. Dairy Products
- 5.2.3. Beverages
- 5.2.4. Bakery and Confectionery
- 5.2.5. Baby Food and Infant Formula
- 5.2.6. Other Applications
- 5.3. Market Analysis, Insights and Forecast - by Region
- 5.3.1. North America
- 5.3.2. Europe
- 5.3.3. Asia Pacific
- 5.3.4. South America
- 5.3.5. Middle East and Africa
- 5.1. Market Analysis, Insights and Forecast - by Technology
- 6. North America Food Allergen Testing Industry Analysis, Insights and Forecast, 2019-2031
- 6.1. Market Analysis, Insights and Forecast - by Technology
- 6.1.1. Immunoassay-based /ELISA
- 6.1.2. PCR (Polymerase Chain Reaction)-based
- 6.1.3. Other Technologies
- 6.2. Market Analysis, Insights and Forecast - by Application
- 6.2.1. Seafood and Meat Products
- 6.2.2. Dairy Products
- 6.2.3. Beverages
- 6.2.4. Bakery and Confectionery
- 6.2.5. Baby Food and Infant Formula
- 6.2.6. Other Applications
- 6.1. Market Analysis, Insights and Forecast - by Technology
- 7. Europe Food Allergen Testing Industry Analysis, Insights and Forecast, 2019-2031
- 7.1. Market Analysis, Insights and Forecast - by Technology
- 7.1.1. Immunoassay-based /ELISA
- 7.1.2. PCR (Polymerase Chain Reaction)-based
- 7.1.3. Other Technologies
- 7.2. Market Analysis, Insights and Forecast - by Application
- 7.2.1. Seafood and Meat Products
- 7.2.2. Dairy Products
- 7.2.3. Beverages
- 7.2.4. Bakery and Confectionery
- 7.2.5. Baby Food and Infant Formula
- 7.2.6. Other Applications
- 7.1. Market Analysis, Insights and Forecast - by Technology
- 8. Asia Pacific Food Allergen Testing Industry Analysis, Insights and Forecast, 2019-2031
- 8.1. Market Analysis, Insights and Forecast - by Technology
- 8.1.1. Immunoassay-based /ELISA
- 8.1.2. PCR (Polymerase Chain Reaction)-based
- 8.1.3. Other Technologies
- 8.2. Market Analysis, Insights and Forecast - by Application
- 8.2.1. Seafood and Meat Products
- 8.2.2. Dairy Products
- 8.2.3. Beverages
- 8.2.4. Bakery and Confectionery
- 8.2.5. Baby Food and Infant Formula
- 8.2.6. Other Applications
- 8.1. Market Analysis, Insights and Forecast - by Technology
- 9. South America Food Allergen Testing Industry Analysis, Insights and Forecast, 2019-2031
- 9.1. Market Analysis, Insights and Forecast - by Technology
- 9.1.1. Immunoassay-based /ELISA
- 9.1.2. PCR (Polymerase Chain Reaction)-based
- 9.1.3. Other Technologies
- 9.2. Market Analysis, Insights and Forecast - by Application
- 9.2.1. Seafood and Meat Products
- 9.2.2. Dairy Products
- 9.2.3. Beverages
- 9.2.4. Bakery and Confectionery
- 9.2.5. Baby Food and Infant Formula
- 9.2.6. Other Applications
- 9.1. Market Analysis, Insights and Forecast - by Technology
- 10. Middle East and Africa Food Allergen Testing Industry Analysis, Insights and Forecast, 2019-2031
- 10.1. Market Analysis, Insights and Forecast - by Technology
- 10.1.1. Immunoassay-based /ELISA
- 10.1.2. PCR (Polymerase Chain Reaction)-based
- 10.1.3. Other Technologies
- 10.2. Market Analysis, Insights and Forecast - by Application
- 10.2.1. Seafood and Meat Products
- 10.2.2. Dairy Products
- 10.2.3. Beverages
- 10.2.4. Bakery and Confectionery
- 10.2.5. Baby Food and Infant Formula
- 10.2.6. Other Applications
- 10.1. Market Analysis, Insights and Forecast - by Technology
- 11. North America Food Allergen Testing Industry Analysis, Insights and Forecast, 2019-2031
- 11.1. Market Analysis, Insights and Forecast - By Country/Sub-region
- 11.1.1 United States
- 11.1.2 Canada
- 11.1.3 Mexico
- 11.1.4 Rest of North America
- 12. Europe Food Allergen Testing Industry Analysis, Insights and Forecast, 2019-2031
- 12.1. Market Analysis, Insights and Forecast - By Country/Sub-region
- 12.1.1 Germany
- 12.1.2 United Kingdom
- 12.1.3 France
- 12.1.4 Russia
- 12.1.5 Spain
- 12.1.6 Italy
- 12.1.7 Rest of Europe
- 13. Asia Pacific Food Allergen Testing Industry Analysis, Insights and Forecast, 2019-2031
- 13.1. Market Analysis, Insights and Forecast - By Country/Sub-region
- 13.1.1 India
- 13.1.2 China
- 13.1.3 Japan
- 13.1.4 Australia
- 13.1.5 Rest of Asia Pacific
- 14. South America Food Allergen Testing Industry Analysis, Insights and Forecast, 2019-2031
- 14.1. Market Analysis, Insights and Forecast - By Country/Sub-region
- 14.1.1 Brazil
- 14.1.2 Argentina
- 14.1.3 Rest of South America
- 15. Middle East and Africa Food Allergen Testing Industry Analysis, Insights and Forecast, 2019-2031
- 15.1. Market Analysis, Insights and Forecast - By Country/Sub-region
- 15.1.1 South Africa
- 15.1.2 Saudi Arabia
- 15.1.3 Rest of Middle East and Africa
- 16. Competitive Analysis
- 16.1. Global Market Share Analysis 2024
- 16.2. Company Profiles
- 16.2.1 Intertek Group PLC
- 16.2.1.1. Overview
- 16.2.1.2. Products
- 16.2.1.3. SWOT Analysis
- 16.2.1.4. Recent Developments
- 16.2.1.5. Financials (Based on Availability)
- 16.2.2 Mérieux NutriSciences
- 16.2.2.1. Overview
- 16.2.2.2. Products
- 16.2.2.3. SWOT Analysis
- 16.2.2.4. Recent Developments
- 16.2.2.5. Financials (Based on Availability)
- 16.2.3 Bureau Veritas S A
- 16.2.3.1. Overview
- 16.2.3.2. Products
- 16.2.3.3. SWOT Analysis
- 16.2.3.4. Recent Developments
- 16.2.3.5. Financials (Based on Availability)
- 16.2.4 SGS SA
- 16.2.4.1. Overview
- 16.2.4.2. Products
- 16.2.4.3. SWOT Analysis
- 16.2.4.4. Recent Developments
- 16.2.4.5. Financials (Based on Availability)
- 16.2.5 Crystal Chem Inc
- 16.2.5.1. Overview
- 16.2.5.2. Products
- 16.2.5.3. SWOT Analysis
- 16.2.5.4. Recent Developments
- 16.2.5.5. Financials (Based on Availability)
- 16.2.6 Lifeasible
- 16.2.6.1. Overview
- 16.2.6.2. Products
- 16.2.6.3. SWOT Analysis
- 16.2.6.4. Recent Developments
- 16.2.6.5. Financials (Based on Availability)
- 16.2.7 ALS Limited
- 16.2.7.1. Overview
- 16.2.7.2. Products
- 16.2.7.3. SWOT Analysis
- 16.2.7.4. Recent Developments
- 16.2.7.5. Financials (Based on Availability)
- 16.2.8 Microbac Laboratories Inc
- 16.2.8.1. Overview
- 16.2.8.2. Products
- 16.2.8.3. SWOT Analysis
- 16.2.8.4. Recent Developments
- 16.2.8.5. Financials (Based on Availability)
- 16.2.9 Eurofins Scientific SE
- 16.2.9.1. Overview
- 16.2.9.2. Products
- 16.2.9.3. SWOT Analysis
- 16.2.9.4. Recent Developments
- 16.2.9.5. Financials (Based on Availability)
- 16.2.10 Neogen Corporation
- 16.2.10.1. Overview
- 16.2.10.2. Products
- 16.2.10.3. SWOT Analysis
- 16.2.10.4. Recent Developments
- 16.2.10.5. Financials (Based on Availability)
- 16.2.1 Intertek Group PLC
List of Figures
- Figure 1: Global Food Allergen Testing Industry Revenue Breakdown (Million, %) by Region 2024 & 2032
- Figure 2: North America Food Allergen Testing Industry Revenue (Million), by Country 2024 & 2032
- Figure 3: North America Food Allergen Testing Industry Revenue Share (%), by Country 2024 & 2032
- Figure 4: Europe Food Allergen Testing Industry Revenue (Million), by Country 2024 & 2032
- Figure 5: Europe Food Allergen Testing Industry Revenue Share (%), by Country 2024 & 2032
- Figure 6: Asia Pacific Food Allergen Testing Industry Revenue (Million), by Country 2024 & 2032
- Figure 7: Asia Pacific Food Allergen Testing Industry Revenue Share (%), by Country 2024 & 2032
- Figure 8: South America Food Allergen Testing Industry Revenue (Million), by Country 2024 & 2032
- Figure 9: South America Food Allergen Testing Industry Revenue Share (%), by Country 2024 & 2032
- Figure 10: Middle East and Africa Food Allergen Testing Industry Revenue (Million), by Country 2024 & 2032
- Figure 11: Middle East and Africa Food Allergen Testing Industry Revenue Share (%), by Country 2024 & 2032
- Figure 12: North America Food Allergen Testing Industry Revenue (Million), by Technology 2024 & 2032
- Figure 13: North America Food Allergen Testing Industry Revenue Share (%), by Technology 2024 & 2032
- Figure 14: North America Food Allergen Testing Industry Revenue (Million), by Application 2024 & 2032
- Figure 15: North America Food Allergen Testing Industry Revenue Share (%), by Application 2024 & 2032
- Figure 16: North America Food Allergen Testing Industry Revenue (Million), by Country 2024 & 2032
- Figure 17: North America Food Allergen Testing Industry Revenue Share (%), by Country 2024 & 2032
- Figure 18: Europe Food Allergen Testing Industry Revenue (Million), by Technology 2024 & 2032
- Figure 19: Europe Food Allergen Testing Industry Revenue Share (%), by Technology 2024 & 2032
- Figure 20: Europe Food Allergen Testing Industry Revenue (Million), by Application 2024 & 2032
- Figure 21: Europe Food Allergen Testing Industry Revenue Share (%), by Application 2024 & 2032
- Figure 22: Europe Food Allergen Testing Industry Revenue (Million), by Country 2024 & 2032
- Figure 23: Europe Food Allergen Testing Industry Revenue Share (%), by Country 2024 & 2032
- Figure 24: Asia Pacific Food Allergen Testing Industry Revenue (Million), by Technology 2024 & 2032
- Figure 25: Asia Pacific Food Allergen Testing Industry Revenue Share (%), by Technology 2024 & 2032
- Figure 26: Asia Pacific Food Allergen Testing Industry Revenue (Million), by Application 2024 & 2032
- Figure 27: Asia Pacific Food Allergen Testing Industry Revenue Share (%), by Application 2024 & 2032
- Figure 28: Asia Pacific Food Allergen Testing Industry Revenue (Million), by Country 2024 & 2032
- Figure 29: Asia Pacific Food Allergen Testing Industry Revenue Share (%), by Country 2024 & 2032
- Figure 30: South America Food Allergen Testing Industry Revenue (Million), by Technology 2024 & 2032
- Figure 31: South America Food Allergen Testing Industry Revenue Share (%), by Technology 2024 & 2032
- Figure 32: South America Food Allergen Testing Industry Revenue (Million), by Application 2024 & 2032
- Figure 33: South America Food Allergen Testing Industry Revenue Share (%), by Application 2024 & 2032
- Figure 34: South America Food Allergen Testing Industry Revenue (Million), by Country 2024 & 2032
- Figure 35: South America Food Allergen Testing Industry Revenue Share (%), by Country 2024 & 2032
- Figure 36: Middle East and Africa Food Allergen Testing Industry Revenue (Million), by Technology 2024 & 2032
- Figure 37: Middle East and Africa Food Allergen Testing Industry Revenue Share (%), by Technology 2024 & 2032
- Figure 38: Middle East and Africa Food Allergen Testing Industry Revenue (Million), by Application 2024 & 2032
- Figure 39: Middle East and Africa Food Allergen Testing Industry Revenue Share (%), by Application 2024 & 2032
- Figure 40: Middle East and Africa Food Allergen Testing Industry Revenue (Million), by Country 2024 & 2032
- Figure 41: Middle East and Africa Food Allergen Testing Industry Revenue Share (%), by Country 2024 & 2032
List of Tables
- Table 1: Global Food Allergen Testing Industry Revenue Million Forecast, by Region 2019 & 2032
- Table 2: Global Food Allergen Testing Industry Revenue Million Forecast, by Technology 2019 & 2032
- Table 3: Global Food Allergen Testing Industry Revenue Million Forecast, by Application 2019 & 2032
- Table 4: Global Food Allergen Testing Industry Revenue Million Forecast, by Region 2019 & 2032
- Table 5: Global Food Allergen Testing Industry Revenue Million Forecast, by Country 2019 & 2032
- Table 6: United States Food Allergen Testing Industry Revenue (Million) Forecast, by Application 2019 & 2032
- Table 7: Canada Food Allergen Testing Industry Revenue (Million) Forecast, by Application 2019 & 2032
- Table 8: Mexico Food Allergen Testing Industry Revenue (Million) Forecast, by Application 2019 & 2032
- Table 9: Rest of North America Food Allergen Testing Industry Revenue (Million) Forecast, by Application 2019 & 2032
- Table 10: Global Food Allergen Testing Industry Revenue Million Forecast, by Country 2019 & 2032
- Table 11: Germany Food Allergen Testing Industry Revenue (Million) Forecast, by Application 2019 & 2032
- Table 12: United Kingdom Food Allergen Testing Industry Revenue (Million) Forecast, by Application 2019 & 2032
- Table 13: France Food Allergen Testing Industry Revenue (Million) Forecast, by Application 2019 & 2032
- Table 14: Russia Food Allergen Testing Industry Revenue (Million) Forecast, by Application 2019 & 2032
- Table 15: Spain Food Allergen Testing Industry Revenue (Million) Forecast, by Application 2019 & 2032
- Table 16: Italy Food Allergen Testing Industry Revenue (Million) Forecast, by Application 2019 & 2032
- Table 17: Rest of Europe Food Allergen Testing Industry Revenue (Million) Forecast, by Application 2019 & 2032
- Table 18: Global Food Allergen Testing Industry Revenue Million Forecast, by Country 2019 & 2032
- Table 19: India Food Allergen Testing Industry Revenue (Million) Forecast, by Application 2019 & 2032
- Table 20: China Food Allergen Testing Industry Revenue (Million) Forecast, by Application 2019 & 2032
- Table 21: Japan Food Allergen Testing Industry Revenue (Million) Forecast, by Application 2019 & 2032
- Table 22: Australia Food Allergen Testing Industry Revenue (Million) Forecast, by Application 2019 & 2032
- Table 23: Rest of Asia Pacific Food Allergen Testing Industry Revenue (Million) Forecast, by Application 2019 & 2032
- Table 24: Global Food Allergen Testing Industry Revenue Million Forecast, by Country 2019 & 2032
- Table 25: Brazil Food Allergen Testing Industry Revenue (Million) Forecast, by Application 2019 & 2032
- Table 26: Argentina Food Allergen Testing Industry Revenue (Million) Forecast, by Application 2019 & 2032
- Table 27: Rest of South America Food Allergen Testing Industry Revenue (Million) Forecast, by Application 2019 & 2032
- Table 28: Global Food Allergen Testing Industry Revenue Million Forecast, by Country 2019 & 2032
- Table 29: South Africa Food Allergen Testing Industry Revenue (Million) Forecast, by Application 2019 & 2032
- Table 30: Saudi Arabia Food Allergen Testing Industry Revenue (Million) Forecast, by Application 2019 & 2032
- Table 31: Rest of Middle East and Africa Food Allergen Testing Industry Revenue (Million) Forecast, by Application 2019 & 2032
- Table 32: Global Food Allergen Testing Industry Revenue Million Forecast, by Technology 2019 & 2032
- Table 33: Global Food Allergen Testing Industry Revenue Million Forecast, by Application 2019 & 2032
- Table 34: Global Food Allergen Testing Industry Revenue Million Forecast, by Country 2019 & 2032
- Table 35: United States Food Allergen Testing Industry Revenue (Million) Forecast, by Application 2019 & 2032
- Table 36: Canada Food Allergen Testing Industry Revenue (Million) Forecast, by Application 2019 & 2032
- Table 37: Mexico Food Allergen Testing Industry Revenue (Million) Forecast, by Application 2019 & 2032
- Table 38: Rest of North America Food Allergen Testing Industry Revenue (Million) Forecast, by Application 2019 & 2032
- Table 39: Global Food Allergen Testing Industry Revenue Million Forecast, by Technology 2019 & 2032
- Table 40: Global Food Allergen Testing Industry Revenue Million Forecast, by Application 2019 & 2032
- Table 41: Global Food Allergen Testing Industry Revenue Million Forecast, by Country 2019 & 2032
- Table 42: Germany Food Allergen Testing Industry Revenue (Million) Forecast, by Application 2019 & 2032
- Table 43: United Kingdom Food Allergen Testing Industry Revenue (Million) Forecast, by Application 2019 & 2032
- Table 44: France Food Allergen Testing Industry Revenue (Million) Forecast, by Application 2019 & 2032
- Table 45: Russia Food Allergen Testing Industry Revenue (Million) Forecast, by Application 2019 & 2032
- Table 46: Spain Food Allergen Testing Industry Revenue (Million) Forecast, by Application 2019 & 2032
- Table 47: Italy Food Allergen Testing Industry Revenue (Million) Forecast, by Application 2019 & 2032
- Table 48: Rest of Europe Food Allergen Testing Industry Revenue (Million) Forecast, by Application 2019 & 2032
- Table 49: Global Food Allergen Testing Industry Revenue Million Forecast, by Technology 2019 & 2032
- Table 50: Global Food Allergen Testing Industry Revenue Million Forecast, by Application 2019 & 2032
- Table 51: Global Food Allergen Testing Industry Revenue Million Forecast, by Country 2019 & 2032
- Table 52: India Food Allergen Testing Industry Revenue (Million) Forecast, by Application 2019 & 2032
- Table 53: China Food Allergen Testing Industry Revenue (Million) Forecast, by Application 2019 & 2032
- Table 54: Japan Food Allergen Testing Industry Revenue (Million) Forecast, by Application 2019 & 2032
- Table 55: Australia Food Allergen Testing Industry Revenue (Million) Forecast, by Application 2019 & 2032
- Table 56: Rest of Asia Pacific Food Allergen Testing Industry Revenue (Million) Forecast, by Application 2019 & 2032
- Table 57: Global Food Allergen Testing Industry Revenue Million Forecast, by Technology 2019 & 2032
- Table 58: Global Food Allergen Testing Industry Revenue Million Forecast, by Application 2019 & 2032
- Table 59: Global Food Allergen Testing Industry Revenue Million Forecast, by Country 2019 & 2032
- Table 60: Brazil Food Allergen Testing Industry Revenue (Million) Forecast, by Application 2019 & 2032
- Table 61: Argentina Food Allergen Testing Industry Revenue (Million) Forecast, by Application 2019 & 2032
- Table 62: Rest of South America Food Allergen Testing Industry Revenue (Million) Forecast, by Application 2019 & 2032
- Table 63: Global Food Allergen Testing Industry Revenue Million Forecast, by Technology 2019 & 2032
- Table 64: Global Food Allergen Testing Industry Revenue Million Forecast, by Application 2019 & 2032
- Table 65: Global Food Allergen Testing Industry Revenue Million Forecast, by Country 2019 & 2032
- Table 66: South Africa Food Allergen Testing Industry Revenue (Million) Forecast, by Application 2019 & 2032
- Table 67: Saudi Arabia Food Allergen Testing Industry Revenue (Million) Forecast, by Application 2019 & 2032
- Table 68: Rest of Middle East and Africa Food Allergen Testing Industry Revenue (Million) Forecast, by Application 2019 & 2032
Frequently Asked Questions
1. What is the projected Compound Annual Growth Rate (CAGR) of the Food Allergen Testing Industry?
The projected CAGR is approximately 7.42%.
2. Which companies are prominent players in the Food Allergen Testing Industry?
Key companies in the market include Intertek Group PLC, Mérieux NutriSciences, Bureau Veritas S A, SGS SA, Crystal Chem Inc , Lifeasible, ALS Limited, Microbac Laboratories Inc, Eurofins Scientific SE, Neogen Corporation.
3. What are the main segments of the Food Allergen Testing Industry?
The market segments include Technology, Application .
4. Can you provide details about the market size?
The market size is estimated to be USD 0.89 Million as of 2022.
5. What are some drivers contributing to market growth?
Increasing Incidences of Food Allergies; Favorable Government Initiatives and Regulations for Food Safety.
6. What are the notable trends driving market growth?
Increasing Prevalence of Food Allergies.
7. Are there any restraints impacting market growth?
Inconsistencies Involved in Food Allergen Declarations.
8. Can you provide examples of recent developments in the market?
March 2024: Gold Standard Diagnostics launched the first product of the new allergen PowerLine tests: the SENSIStrip Gluten PowerLine Lateral Flow Device. The product comprises a sensitive detection system based on a monoclonal antibody and can detect gluten residues in food matrices, rinse water, and swabs.
9. What pricing options are available for accessing the report?
Pricing options include single-user, multi-user, and enterprise licenses priced at USD 4750, USD 5250, and USD 8750 respectively.
10. Is the market size provided in terms of value or volume?
The market size is provided in terms of value, measured in Million.
11. Are there any specific market keywords associated with the report?
Yes, the market keyword associated with the report is "Food Allergen Testing Industry," which aids in identifying and referencing the specific market segment covered.
12. How do I determine which pricing option suits my needs best?
The pricing options vary based on user requirements and access needs. Individual users may opt for single-user licenses, while businesses requiring broader access may choose multi-user or enterprise licenses for cost-effective access to the report.
13. Are there any additional resources or data provided in the Food Allergen Testing Industry report?
While the report offers comprehensive insights, it's advisable to review the specific contents or supplementary materials provided to ascertain if additional resources or data are available.
14. How can I stay updated on further developments or reports in the Food Allergen Testing Industry?
To stay informed about further developments, trends, and reports in the Food Allergen Testing Industry, consider subscribing to industry newsletters, following relevant companies and organizations, or regularly checking reputable industry news sources and publications.
Methodology
Step 1 - Identification of Relevant Samples Size from Population Database


Step 2 - Approaches for Defining Global Market Size (Value, Volume* & Price*)

Note*: In applicable scenarios
Step 3 - Data Sources
Primary Research
- Web Analytics
- Survey Reports
- Research Institute
- Latest Research Reports
- Opinion Leaders
Secondary Research
- Annual Reports
- White Paper
- Latest Press Release
- Industry Association
- Paid Database
- Investor Presentations

Step 4 - Data Triangulation
Involves using different sources of information in order to increase the validity of a study
These sources are likely to be stakeholders in a program - participants, other researchers, program staff, other community members, and so on.
Then we put all data in single framework & apply various statistical tools to find out the dynamic on the market.
During the analysis stage, feedback from the stakeholder groups would be compared to determine areas of agreement as well as areas of divergence


