
Key Insights
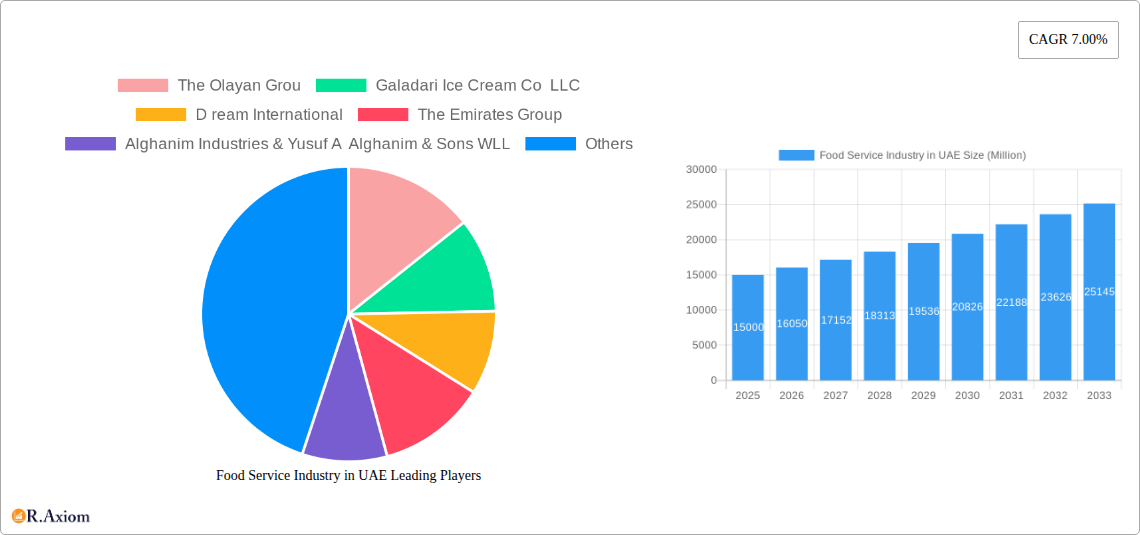
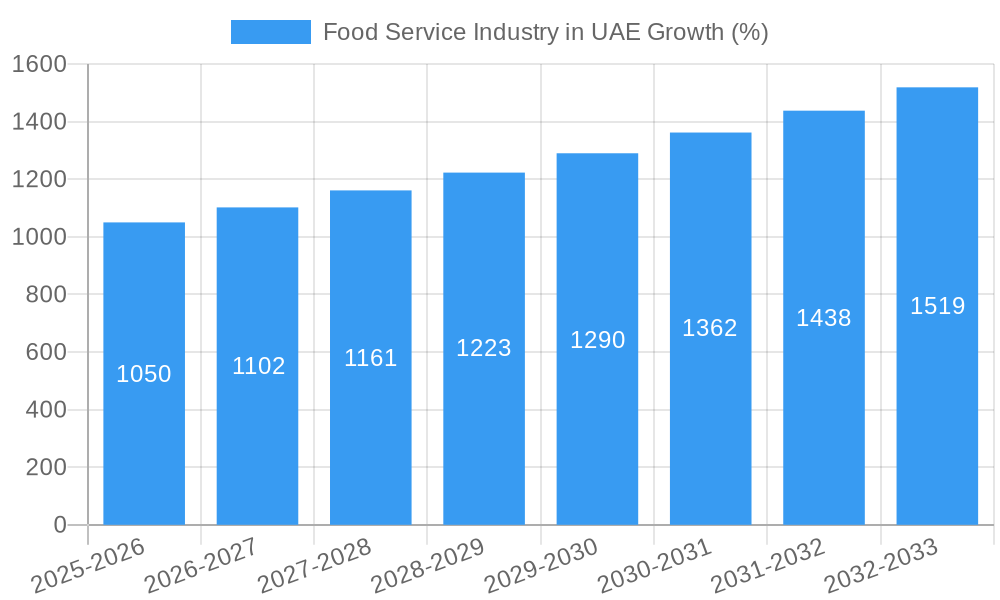
The UAE's food service industry, valued at approximately $XX million in 2025, is experiencing robust growth, projected to maintain a Compound Annual Growth Rate (CAGR) of 7.00% from 2025 to 2033. This expansion is fueled by several key factors. The UAE's thriving tourism sector, a significant influx of expatriates, and a rising young population with high disposable incomes are driving increased demand for diverse dining experiences. Furthermore, the proliferation of online food delivery platforms and the increasing popularity of quick-service restaurants (QSRs) catering to busy lifestyles contribute significantly to market growth. The industry's segmentation reveals a strong presence of chained outlets, particularly in leisure and retail locations. Cafes and bars, alongside other QSR cuisines, represent significant market segments, indicating diverse consumer preferences. However, the industry faces certain challenges, including fluctuating food prices, rising operational costs, and intense competition among established players and new entrants. Maintaining consistent quality while managing these cost pressures will be crucial for sustained growth. Successful companies will leverage technological advancements, innovative menu offerings, and strong brand building to effectively capture market share in this dynamic and competitive landscape.
The competitive landscape includes both international giants and strong regional players. Companies like The Olayan Group, Americana Restaurants International PLC, and M H Alshaya Co WLL hold significant market share, highlighting the need for both large-scale operations and localized strategies. The diversity of players suggests that successful companies are able to adapt to diverse preferences and cater to a wide range of consumer demographics within the UAE's multicultural society. Future growth will likely depend on companies' abilities to adapt to shifting consumer trends, such as the growing demand for healthy and sustainable food options, while also effectively managing supply chain challenges and evolving regulatory environments. The expansion into new areas such as cloud kitchens and specialized delivery services presents further growth opportunities for innovative companies willing to embrace change.
Food Service Industry in UAE: 2019-2033 Market Analysis & Forecast Report
This comprehensive report provides an in-depth analysis of the Food Service Industry in the UAE, covering market size, segmentation, key players, growth drivers, challenges, and future opportunities from 2019 to 2033. The report utilizes a robust methodology incorporating historical data (2019-2024), current estimates (2025), and future projections (2025-2033), providing invaluable insights for industry stakeholders, investors, and businesses operating or planning to enter this dynamic market. The Base Year for this report is 2025.
Food Service Industry in UAE Market Concentration & Innovation
The UAE's food service industry exhibits a mix of concentrated and fragmented segments. Major players like Americana Restaurants International PLC, M H Alshaya Co WLL, and LuLu Group International hold significant market share, particularly within chained outlets and specific cuisines. However, a large number of independent outlets contribute substantially to the overall market size, indicating a competitive landscape. Market concentration is higher in the QSR (Quick Service Restaurant) segment compared to the cafes and bars segment. Innovation is driven by factors like rising consumer demand for diverse cuisines, technological advancements (e.g., online ordering, delivery platforms, robotics), and government initiatives promoting food safety and hygiene.
Regulatory frameworks, including food safety standards and licensing requirements, influence market dynamics. Product substitutes, such as home-cooked meals and meal delivery services, exert competitive pressure. End-user trends towards health-conscious options, convenient dining, and unique culinary experiences shape industry offerings. Mergers and acquisitions (M&A) activity, while not consistently high in value terms, contribute to market consolidation and expansion of leading players' portfolios. For example, Americana Restaurants’ recent deals involving robotics and Peet’s Coffee reflect this trend. While precise M&A deal values for the period are not publicly available and vary widely, we estimate a cumulative value of approximately xx Million for the period covered. Market share data for major players are not consistently publicly available but estimated market share for top 5 players is around xx%.
Food Service Industry in UAE Industry Trends & Insights
The UAE food service market is experiencing robust growth, driven by a burgeoning population, rising disposable incomes, increasing tourism, and a diverse expatriate population with varied culinary preferences. The Compound Annual Growth Rate (CAGR) for the period 2019-2024 is estimated at xx%, and projections for 2025-2033 indicate continued growth, albeit potentially at a slightly moderated pace. Technological disruptions, such as online ordering and delivery apps, have significantly altered consumer behavior and expanded market reach. Market penetration of online food delivery platforms is estimated to be around xx% in 2025, projected to increase further.
Consumer preferences are shifting towards healthier, more sustainable options, influencing menu innovations and operational practices. Competitive dynamics are intense, marked by both price competition and differentiation strategies based on branding, quality, service, and unique offerings. The market witnesses continuous entry of new players, particularly in niche segments, alongside ongoing expansion and diversification by established players.
Dominant Markets & Segments in Food Service Industry in UAE
Leading Region: The major metropolitan areas of Dubai and Abu Dhabi dominate the food service market due to high population density, tourism influx, and robust infrastructure.
Dominant Outlets: Chained outlets represent a larger market share than independent outlets, leveraging economies of scale and brand recognition.
Location Dominance: Retail and standalone locations hold significant market share, reflecting convenience and accessibility. The leisure and lodging segments are also substantial contributors, especially in tourist hotspots.
Foodservice Type: Other QSR cuisines (fast food) are currently a more significant segment than cafes & bars, largely driven by convenience and affordability.
Key Drivers for Dominance:
- Robust infrastructure: Well-developed transportation networks, reliable utilities, and supportive business environment facilitate the growth of the industry.
- High tourist inflow: Dubai and Abu Dhabi attract a large number of tourists, boosting demand for diverse food offerings across all segments.
- Favorable economic policies: The government actively promotes foreign investment and supports the growth of the tourism and hospitality sectors.
- Diverse population: The UAE's multicultural population creates a high demand for various cuisines, fueling the expansion of the food service industry.
Food Service Industry in UAE Product Developments
Product innovation in the UAE food service sector is heavily influenced by technology and consumer demand for healthier, convenient, and unique offerings. We are seeing an increase in the use of technology, like online ordering systems, and robotic solutions for food preparation, and personalized meal options to cater to dietary preferences and restrictions. The emphasis on customization and convenience ensures a strong market fit for these innovations.
Report Scope & Segmentation Analysis
This report segments the UAE food service market by outlet type (chained and independent), location (leisure, lodging, retail, standalone, travel), and foodservice type (cafes & bars, other QSR cuisines). Growth projections, market sizes, and competitive dynamics are analyzed for each segment. For example, the chained outlet segment demonstrates higher growth projections compared to independent outlets due to established brands and strong marketing capabilities. The retail location segment exhibits high growth potential due to expanding urban areas and increasing consumer spending.
Key Drivers of Food Service Industry in UAE Growth
Several factors fuel the growth of the UAE's food service industry. Technological advancements like online ordering and delivery platforms enhance convenience and reach. A rising population with increasing disposable income drives demand for diverse food experiences. Government initiatives supporting tourism and hospitality bolster the sector.
Challenges in the Food Service Industry in UAE Sector
The industry faces challenges such as high operating costs, intense competition, and fluctuating food prices. Regulatory hurdles, including food safety standards and licensing requirements, pose additional burdens. Supply chain disruptions, especially in times of global uncertainty, can impact profitability and availability of products.
Emerging Opportunities in Food Service Industry in UAE
Growth potential lies in exploring niche cuisines, leveraging technology for personalized services, focusing on sustainability and healthy food options, and expanding delivery services to underserved areas. Targeting specific demographics with tailored offerings will be important.
Leading Players in the Food Service Industry in UAE Market
- The Olayan Group
- Galadari Ice Cream Co LLC
- Dream International
- The Emirates Group
- Alghanim Industries & Yusuf A Alghanim & Sons WLL
- Emirates Fast Food Company
- CKE Restaurants Holdings Inc
- Ring International Holding AG
- Deli and Meal LLC
- BinHendi Enterprises
- Americana Restaurants International PLC
- M H Alshaya Co WLL
- LuLu Group International
- Kamal Osman Jamjoom Group LLC
- Apparel Group
- Alamar Foods Company
- JF Street Food
- Al Khaja Group Of Companies
Key Developments in Food Service Industry in UAE Industry
- June 2022: Americana Restaurants partnered with Miso Robotics, integrating robotic solutions for enhanced efficiency and consistency. This signals a larger trend towards automation in the industry.
- August 2022: Americana Restaurants secured a franchise agreement with Peet's Coffee, signifying the growing interest in premium coffee brands within the UAE market. This expands the company's portfolio and caters to a specific consumer segment.
- December 2022: Americana Restaurants relaunched the Wimpy burger brand, utilizing Flippy 2 robotics for automated cooking. This highlights the strategic adoption of technology to improve operational efficiency and create a unique brand experience.
Strategic Outlook for Food Service Industry in UAE Market
The UAE's food service sector presents considerable growth potential, driven by the country's sustained economic growth, increasing tourism, and diverse population. Continued innovation, strategic partnerships, and adaptation to evolving consumer preferences will be crucial for success. The adoption of technological advancements will play a significant role in optimizing operations and enhancing the customer experience. Companies that can efficiently adapt to evolving trends and maintain a high standard of quality and service will significantly benefit.
Food Service Industry in UAE Segmentation
-
1. Foodservice Type
-
1.1. Cafes & Bars
-
1.1.1. By Cuisine
- 1.1.1.1. Bars & Pubs
- 1.1.1.2. Juice/Smoothie/Desserts Bars
- 1.1.1.3. Specialist Coffee & Tea Shops
-
1.1.1. By Cuisine
- 1.2. Cloud Kitchen
-
1.3. Full Service Restaurants
- 1.3.1. Asian
- 1.3.2. European
- 1.3.3. Latin American
- 1.3.4. Middle Eastern
- 1.3.5. North American
- 1.3.6. Other FSR Cuisines
-
1.4. Quick Service Restaurants
- 1.4.1. Bakeries
- 1.4.2. Burger
- 1.4.3. Ice Cream
- 1.4.4. Meat-based Cuisines
- 1.4.5. Pizza
- 1.4.6. Other QSR Cuisines
-
1.1. Cafes & Bars
-
2. Outlet
- 2.1. Chained Outlets
- 2.2. Independent Outlets
-
3. Location
- 3.1. Leisure
- 3.2. Lodging
- 3.3. Retail
- 3.4. Standalone
- 3.5. Travel
Food Service Industry in UAE Segmentation By Geography
-
1. North America
- 1.1. United States
- 1.2. Canada
- 1.3. Mexico
-
2. South America
- 2.1. Brazil
- 2.2. Argentina
- 2.3. Rest of South America
-
3. Europe
- 3.1. United Kingdom
- 3.2. Germany
- 3.3. France
- 3.4. Italy
- 3.5. Spain
- 3.6. Russia
- 3.7. Benelux
- 3.8. Nordics
- 3.9. Rest of Europe
-
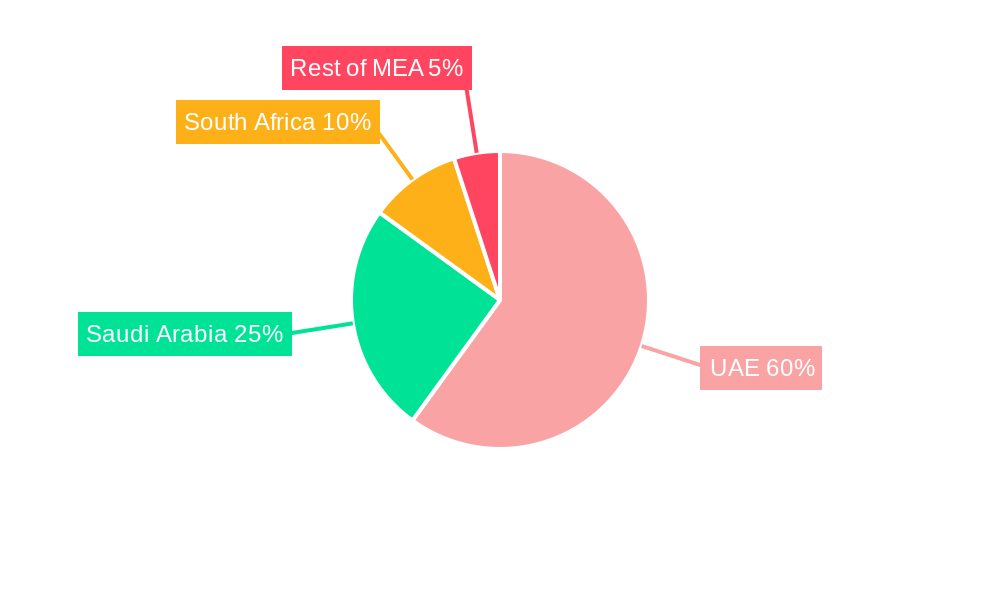
4. Middle East & Africa
- 4.1. Turkey
- 4.2. Israel
- 4.3. GCC
- 4.4. North Africa
- 4.5. South Africa
- 4.6. Rest of Middle East & Africa
-
5. Asia Pacific
- 5.1. China
- 5.2. India
- 5.3. Japan
- 5.4. South Korea
- 5.5. ASEAN
- 5.6. Oceania
- 5.7. Rest of Asia Pacific
Food Service Industry in UAE REPORT HIGHLIGHTS
| Aspects | Details |
|---|---|
| Study Period | 2019-2033 |
| Base Year | 2024 |
| Estimated Year | 2025 |
| Forecast Period | 2025-2033 |
| Historical Period | 2019-2024 |
| Growth Rate | CAGR of 7.00% from 2019-2033 |
| Segmentation |
|
Table of Contents
- 1. Introduction
- 1.1. Research Scope
- 1.2. Market Segmentation
- 1.3. Research Methodology
- 1.4. Definitions and Assumptions
- 2. Executive Summary
- 2.1. Introduction
- 3. Market Dynamics
- 3.1. Introduction
- 3.2. Market Drivers
- 3.2.1. Consumer inclination toward functional food and beverages; Increasing Number of Applications and Growing Industrial Use
- 3.3. Market Restrains
- 3.3.1. Increasing Shift Toward Plant-Based Protein
- 3.4. Market Trends
- 3.4.1. The high ex-pat population in the country and the rise in online food delivery are fuelling the market growth
- 4. Market Factor Analysis
- 4.1. Porters Five Forces
- 4.2. Supply/Value Chain
- 4.3. PESTEL analysis
- 4.4. Market Entropy
- 4.5. Patent/Trademark Analysis
- 5. Global Food Service Industry in UAE Analysis, Insights and Forecast, 2019-2031
- 5.1. Market Analysis, Insights and Forecast - by Foodservice Type
- 5.1.1. Cafes & Bars
- 5.1.1.1. By Cuisine
- 5.1.1.1.1. Bars & Pubs
- 5.1.1.1.2. Juice/Smoothie/Desserts Bars
- 5.1.1.1.3. Specialist Coffee & Tea Shops
- 5.1.1.1. By Cuisine
- 5.1.2. Cloud Kitchen
- 5.1.3. Full Service Restaurants
- 5.1.3.1. Asian
- 5.1.3.2. European
- 5.1.3.3. Latin American
- 5.1.3.4. Middle Eastern
- 5.1.3.5. North American
- 5.1.3.6. Other FSR Cuisines
- 5.1.4. Quick Service Restaurants
- 5.1.4.1. Bakeries
- 5.1.4.2. Burger
- 5.1.4.3. Ice Cream
- 5.1.4.4. Meat-based Cuisines
- 5.1.4.5. Pizza
- 5.1.4.6. Other QSR Cuisines
- 5.1.1. Cafes & Bars
- 5.2. Market Analysis, Insights and Forecast - by Outlet
- 5.2.1. Chained Outlets
- 5.2.2. Independent Outlets
- 5.3. Market Analysis, Insights and Forecast - by Location
- 5.3.1. Leisure
- 5.3.2. Lodging
- 5.3.3. Retail
- 5.3.4. Standalone
- 5.3.5. Travel
- 5.4. Market Analysis, Insights and Forecast - by Region
- 5.4.1. North America
- 5.4.2. South America
- 5.4.3. Europe
- 5.4.4. Middle East & Africa
- 5.4.5. Asia Pacific
- 5.1. Market Analysis, Insights and Forecast - by Foodservice Type
- 6. North America Food Service Industry in UAE Analysis, Insights and Forecast, 2019-2031
- 6.1. Market Analysis, Insights and Forecast - by Foodservice Type
- 6.1.1. Cafes & Bars
- 6.1.1.1. By Cuisine
- 6.1.1.1.1. Bars & Pubs
- 6.1.1.1.2. Juice/Smoothie/Desserts Bars
- 6.1.1.1.3. Specialist Coffee & Tea Shops
- 6.1.1.1. By Cuisine
- 6.1.2. Cloud Kitchen
- 6.1.3. Full Service Restaurants
- 6.1.3.1. Asian
- 6.1.3.2. European
- 6.1.3.3. Latin American
- 6.1.3.4. Middle Eastern
- 6.1.3.5. North American
- 6.1.3.6. Other FSR Cuisines
- 6.1.4. Quick Service Restaurants
- 6.1.4.1. Bakeries
- 6.1.4.2. Burger
- 6.1.4.3. Ice Cream
- 6.1.4.4. Meat-based Cuisines
- 6.1.4.5. Pizza
- 6.1.4.6. Other QSR Cuisines
- 6.1.1. Cafes & Bars
- 6.2. Market Analysis, Insights and Forecast - by Outlet
- 6.2.1. Chained Outlets
- 6.2.2. Independent Outlets
- 6.3. Market Analysis, Insights and Forecast - by Location
- 6.3.1. Leisure
- 6.3.2. Lodging
- 6.3.3. Retail
- 6.3.4. Standalone
- 6.3.5. Travel
- 6.1. Market Analysis, Insights and Forecast - by Foodservice Type
- 7. South America Food Service Industry in UAE Analysis, Insights and Forecast, 2019-2031
- 7.1. Market Analysis, Insights and Forecast - by Foodservice Type
- 7.1.1. Cafes & Bars
- 7.1.1.1. By Cuisine
- 7.1.1.1.1. Bars & Pubs
- 7.1.1.1.2. Juice/Smoothie/Desserts Bars
- 7.1.1.1.3. Specialist Coffee & Tea Shops
- 7.1.1.1. By Cuisine
- 7.1.2. Cloud Kitchen
- 7.1.3. Full Service Restaurants
- 7.1.3.1. Asian
- 7.1.3.2. European
- 7.1.3.3. Latin American
- 7.1.3.4. Middle Eastern
- 7.1.3.5. North American
- 7.1.3.6. Other FSR Cuisines
- 7.1.4. Quick Service Restaurants
- 7.1.4.1. Bakeries
- 7.1.4.2. Burger
- 7.1.4.3. Ice Cream
- 7.1.4.4. Meat-based Cuisines
- 7.1.4.5. Pizza
- 7.1.4.6. Other QSR Cuisines
- 7.1.1. Cafes & Bars
- 7.2. Market Analysis, Insights and Forecast - by Outlet
- 7.2.1. Chained Outlets
- 7.2.2. Independent Outlets
- 7.3. Market Analysis, Insights and Forecast - by Location
- 7.3.1. Leisure
- 7.3.2. Lodging
- 7.3.3. Retail
- 7.3.4. Standalone
- 7.3.5. Travel
- 7.1. Market Analysis, Insights and Forecast - by Foodservice Type
- 8. Europe Food Service Industry in UAE Analysis, Insights and Forecast, 2019-2031
- 8.1. Market Analysis, Insights and Forecast - by Foodservice Type
- 8.1.1. Cafes & Bars
- 8.1.1.1. By Cuisine
- 8.1.1.1.1. Bars & Pubs
- 8.1.1.1.2. Juice/Smoothie/Desserts Bars
- 8.1.1.1.3. Specialist Coffee & Tea Shops
- 8.1.1.1. By Cuisine
- 8.1.2. Cloud Kitchen
- 8.1.3. Full Service Restaurants
- 8.1.3.1. Asian
- 8.1.3.2. European
- 8.1.3.3. Latin American
- 8.1.3.4. Middle Eastern
- 8.1.3.5. North American
- 8.1.3.6. Other FSR Cuisines
- 8.1.4. Quick Service Restaurants
- 8.1.4.1. Bakeries
- 8.1.4.2. Burger
- 8.1.4.3. Ice Cream
- 8.1.4.4. Meat-based Cuisines
- 8.1.4.5. Pizza
- 8.1.4.6. Other QSR Cuisines
- 8.1.1. Cafes & Bars
- 8.2. Market Analysis, Insights and Forecast - by Outlet
- 8.2.1. Chained Outlets
- 8.2.2. Independent Outlets
- 8.3. Market Analysis, Insights and Forecast - by Location
- 8.3.1. Leisure
- 8.3.2. Lodging
- 8.3.3. Retail
- 8.3.4. Standalone
- 8.3.5. Travel
- 8.1. Market Analysis, Insights and Forecast - by Foodservice Type
- 9. Middle East & Africa Food Service Industry in UAE Analysis, Insights and Forecast, 2019-2031
- 9.1. Market Analysis, Insights and Forecast - by Foodservice Type
- 9.1.1. Cafes & Bars
- 9.1.1.1. By Cuisine
- 9.1.1.1.1. Bars & Pubs
- 9.1.1.1.2. Juice/Smoothie/Desserts Bars
- 9.1.1.1.3. Specialist Coffee & Tea Shops
- 9.1.1.1. By Cuisine
- 9.1.2. Cloud Kitchen
- 9.1.3. Full Service Restaurants
- 9.1.3.1. Asian
- 9.1.3.2. European
- 9.1.3.3. Latin American
- 9.1.3.4. Middle Eastern
- 9.1.3.5. North American
- 9.1.3.6. Other FSR Cuisines
- 9.1.4. Quick Service Restaurants
- 9.1.4.1. Bakeries
- 9.1.4.2. Burger
- 9.1.4.3. Ice Cream
- 9.1.4.4. Meat-based Cuisines
- 9.1.4.5. Pizza
- 9.1.4.6. Other QSR Cuisines
- 9.1.1. Cafes & Bars
- 9.2. Market Analysis, Insights and Forecast - by Outlet
- 9.2.1. Chained Outlets
- 9.2.2. Independent Outlets
- 9.3. Market Analysis, Insights and Forecast - by Location
- 9.3.1. Leisure
- 9.3.2. Lodging
- 9.3.3. Retail
- 9.3.4. Standalone
- 9.3.5. Travel
- 9.1. Market Analysis, Insights and Forecast - by Foodservice Type
- 10. Asia Pacific Food Service Industry in UAE Analysis, Insights and Forecast, 2019-2031
- 10.1. Market Analysis, Insights and Forecast - by Foodservice Type
- 10.1.1. Cafes & Bars
- 10.1.1.1. By Cuisine
- 10.1.1.1.1. Bars & Pubs
- 10.1.1.1.2. Juice/Smoothie/Desserts Bars
- 10.1.1.1.3. Specialist Coffee & Tea Shops
- 10.1.1.1. By Cuisine
- 10.1.2. Cloud Kitchen
- 10.1.3. Full Service Restaurants
- 10.1.3.1. Asian
- 10.1.3.2. European
- 10.1.3.3. Latin American
- 10.1.3.4. Middle Eastern
- 10.1.3.5. North American
- 10.1.3.6. Other FSR Cuisines
- 10.1.4. Quick Service Restaurants
- 10.1.4.1. Bakeries
- 10.1.4.2. Burger
- 10.1.4.3. Ice Cream
- 10.1.4.4. Meat-based Cuisines
- 10.1.4.5. Pizza
- 10.1.4.6. Other QSR Cuisines
- 10.1.1. Cafes & Bars
- 10.2. Market Analysis, Insights and Forecast - by Outlet
- 10.2.1. Chained Outlets
- 10.2.2. Independent Outlets
- 10.3. Market Analysis, Insights and Forecast - by Location
- 10.3.1. Leisure
- 10.3.2. Lodging
- 10.3.3. Retail
- 10.3.4. Standalone
- 10.3.5. Travel
- 10.1. Market Analysis, Insights and Forecast - by Foodservice Type
- 11. UAE Food Service Industry in UAE Analysis, Insights and Forecast, 2019-2031
- 12. South Africa Food Service Industry in UAE Analysis, Insights and Forecast, 2019-2031
- 13. Saudi Arabia Food Service Industry in UAE Analysis, Insights and Forecast, 2019-2031
- 14. Rest of MEA Food Service Industry in UAE Analysis, Insights and Forecast, 2019-2031
- 15. Competitive Analysis
- 15.1. Global Market Share Analysis 2024
- 15.2. Company Profiles
- 15.2.1 The Olayan Grou
- 15.2.1.1. Overview
- 15.2.1.2. Products
- 15.2.1.3. SWOT Analysis
- 15.2.1.4. Recent Developments
- 15.2.1.5. Financials (Based on Availability)
- 15.2.2 Galadari Ice Cream Co LLC
- 15.2.2.1. Overview
- 15.2.2.2. Products
- 15.2.2.3. SWOT Analysis
- 15.2.2.4. Recent Developments
- 15.2.2.5. Financials (Based on Availability)
- 15.2.3 D ream International
- 15.2.3.1. Overview
- 15.2.3.2. Products
- 15.2.3.3. SWOT Analysis
- 15.2.3.4. Recent Developments
- 15.2.3.5. Financials (Based on Availability)
- 15.2.4 The Emirates Group
- 15.2.4.1. Overview
- 15.2.4.2. Products
- 15.2.4.3. SWOT Analysis
- 15.2.4.4. Recent Developments
- 15.2.4.5. Financials (Based on Availability)
- 15.2.5 Alghanim Industries & Yusuf A Alghanim & Sons WLL
- 15.2.5.1. Overview
- 15.2.5.2. Products
- 15.2.5.3. SWOT Analysis
- 15.2.5.4. Recent Developments
- 15.2.5.5. Financials (Based on Availability)
- 15.2.6 Emirates Fast Food Company
- 15.2.6.1. Overview
- 15.2.6.2. Products
- 15.2.6.3. SWOT Analysis
- 15.2.6.4. Recent Developments
- 15.2.6.5. Financials (Based on Availability)
- 15.2.7 CKE Restaurants Holdings Inc
- 15.2.7.1. Overview
- 15.2.7.2. Products
- 15.2.7.3. SWOT Analysis
- 15.2.7.4. Recent Developments
- 15.2.7.5. Financials (Based on Availability)
- 15.2.8 Ring International Holding AG
- 15.2.8.1. Overview
- 15.2.8.2. Products
- 15.2.8.3. SWOT Analysis
- 15.2.8.4. Recent Developments
- 15.2.8.5. Financials (Based on Availability)
- 15.2.9 Deli and Meal LLC
- 15.2.9.1. Overview
- 15.2.9.2. Products
- 15.2.9.3. SWOT Analysis
- 15.2.9.4. Recent Developments
- 15.2.9.5. Financials (Based on Availability)
- 15.2.10 BinHendi Enterprises
- 15.2.10.1. Overview
- 15.2.10.2. Products
- 15.2.10.3. SWOT Analysis
- 15.2.10.4. Recent Developments
- 15.2.10.5. Financials (Based on Availability)
- 15.2.11 Americana Restaurants International PLC
- 15.2.11.1. Overview
- 15.2.11.2. Products
- 15.2.11.3. SWOT Analysis
- 15.2.11.4. Recent Developments
- 15.2.11.5. Financials (Based on Availability)
- 15.2.12 M H Alshaya Co WLL
- 15.2.12.1. Overview
- 15.2.12.2. Products
- 15.2.12.3. SWOT Analysis
- 15.2.12.4. Recent Developments
- 15.2.12.5. Financials (Based on Availability)
- 15.2.13 LuLu Group International
- 15.2.13.1. Overview
- 15.2.13.2. Products
- 15.2.13.3. SWOT Analysis
- 15.2.13.4. Recent Developments
- 15.2.13.5. Financials (Based on Availability)
- 15.2.14 Kamal Osman Jamjoom Group LLC
- 15.2.14.1. Overview
- 15.2.14.2. Products
- 15.2.14.3. SWOT Analysis
- 15.2.14.4. Recent Developments
- 15.2.14.5. Financials (Based on Availability)
- 15.2.15 Apparel Group
- 15.2.15.1. Overview
- 15.2.15.2. Products
- 15.2.15.3. SWOT Analysis
- 15.2.15.4. Recent Developments
- 15.2.15.5. Financials (Based on Availability)
- 15.2.16 Alamar Foods Company
- 15.2.16.1. Overview
- 15.2.16.2. Products
- 15.2.16.3. SWOT Analysis
- 15.2.16.4. Recent Developments
- 15.2.16.5. Financials (Based on Availability)
- 15.2.17 JF Street Food
- 15.2.17.1. Overview
- 15.2.17.2. Products
- 15.2.17.3. SWOT Analysis
- 15.2.17.4. Recent Developments
- 15.2.17.5. Financials (Based on Availability)
- 15.2.18 Al Khaja Group Of Companies
- 15.2.18.1. Overview
- 15.2.18.2. Products
- 15.2.18.3. SWOT Analysis
- 15.2.18.4. Recent Developments
- 15.2.18.5. Financials (Based on Availability)
- 15.2.1 The Olayan Grou
List of Figures
- Figure 1: Global Food Service Industry in UAE Revenue Breakdown (Million, %) by Region 2024 & 2032
- Figure 2: Global Food Service Industry in UAE Volume Breakdown (Thousand Tons, %) by Region 2024 & 2032
- Figure 3: Middle East & Africa Food Service Industry in UAE Revenue (Million), by Country 2024 & 2032
- Figure 4: Middle East & Africa Food Service Industry in UAE Volume (Thousand Tons), by Country 2024 & 2032
- Figure 5: Middle East & Africa Food Service Industry in UAE Revenue Share (%), by Country 2024 & 2032
- Figure 6: Middle East & Africa Food Service Industry in UAE Volume Share (%), by Country 2024 & 2032
- Figure 7: North America Food Service Industry in UAE Revenue (Million), by Foodservice Type 2024 & 2032
- Figure 8: North America Food Service Industry in UAE Volume (Thousand Tons), by Foodservice Type 2024 & 2032
- Figure 9: North America Food Service Industry in UAE Revenue Share (%), by Foodservice Type 2024 & 2032
- Figure 10: North America Food Service Industry in UAE Volume Share (%), by Foodservice Type 2024 & 2032
- Figure 11: North America Food Service Industry in UAE Revenue (Million), by Outlet 2024 & 2032
- Figure 12: North America Food Service Industry in UAE Volume (Thousand Tons), by Outlet 2024 & 2032
- Figure 13: North America Food Service Industry in UAE Revenue Share (%), by Outlet 2024 & 2032
- Figure 14: North America Food Service Industry in UAE Volume Share (%), by Outlet 2024 & 2032
- Figure 15: North America Food Service Industry in UAE Revenue (Million), by Location 2024 & 2032
- Figure 16: North America Food Service Industry in UAE Volume (Thousand Tons), by Location 2024 & 2032
- Figure 17: North America Food Service Industry in UAE Revenue Share (%), by Location 2024 & 2032
- Figure 18: North America Food Service Industry in UAE Volume Share (%), by Location 2024 & 2032
- Figure 19: North America Food Service Industry in UAE Revenue (Million), by Country 2024 & 2032
- Figure 20: North America Food Service Industry in UAE Volume (Thousand Tons), by Country 2024 & 2032
- Figure 21: North America Food Service Industry in UAE Revenue Share (%), by Country 2024 & 2032
- Figure 22: North America Food Service Industry in UAE Volume Share (%), by Country 2024 & 2032
- Figure 23: South America Food Service Industry in UAE Revenue (Million), by Foodservice Type 2024 & 2032
- Figure 24: South America Food Service Industry in UAE Volume (Thousand Tons), by Foodservice Type 2024 & 2032
- Figure 25: South America Food Service Industry in UAE Revenue Share (%), by Foodservice Type 2024 & 2032
- Figure 26: South America Food Service Industry in UAE Volume Share (%), by Foodservice Type 2024 & 2032
- Figure 27: South America Food Service Industry in UAE Revenue (Million), by Outlet 2024 & 2032
- Figure 28: South America Food Service Industry in UAE Volume (Thousand Tons), by Outlet 2024 & 2032
- Figure 29: South America Food Service Industry in UAE Revenue Share (%), by Outlet 2024 & 2032
- Figure 30: South America Food Service Industry in UAE Volume Share (%), by Outlet 2024 & 2032
- Figure 31: South America Food Service Industry in UAE Revenue (Million), by Location 2024 & 2032
- Figure 32: South America Food Service Industry in UAE Volume (Thousand Tons), by Location 2024 & 2032
- Figure 33: South America Food Service Industry in UAE Revenue Share (%), by Location 2024 & 2032
- Figure 34: South America Food Service Industry in UAE Volume Share (%), by Location 2024 & 2032
- Figure 35: South America Food Service Industry in UAE Revenue (Million), by Country 2024 & 2032
- Figure 36: South America Food Service Industry in UAE Volume (Thousand Tons), by Country 2024 & 2032
- Figure 37: South America Food Service Industry in UAE Revenue Share (%), by Country 2024 & 2032
- Figure 38: South America Food Service Industry in UAE Volume Share (%), by Country 2024 & 2032
- Figure 39: Europe Food Service Industry in UAE Revenue (Million), by Foodservice Type 2024 & 2032
- Figure 40: Europe Food Service Industry in UAE Volume (Thousand Tons), by Foodservice Type 2024 & 2032
- Figure 41: Europe Food Service Industry in UAE Revenue Share (%), by Foodservice Type 2024 & 2032
- Figure 42: Europe Food Service Industry in UAE Volume Share (%), by Foodservice Type 2024 & 2032
- Figure 43: Europe Food Service Industry in UAE Revenue (Million), by Outlet 2024 & 2032
- Figure 44: Europe Food Service Industry in UAE Volume (Thousand Tons), by Outlet 2024 & 2032
- Figure 45: Europe Food Service Industry in UAE Revenue Share (%), by Outlet 2024 & 2032
- Figure 46: Europe Food Service Industry in UAE Volume Share (%), by Outlet 2024 & 2032
- Figure 47: Europe Food Service Industry in UAE Revenue (Million), by Location 2024 & 2032
- Figure 48: Europe Food Service Industry in UAE Volume (Thousand Tons), by Location 2024 & 2032
- Figure 49: Europe Food Service Industry in UAE Revenue Share (%), by Location 2024 & 2032
- Figure 50: Europe Food Service Industry in UAE Volume Share (%), by Location 2024 & 2032
- Figure 51: Europe Food Service Industry in UAE Revenue (Million), by Country 2024 & 2032
- Figure 52: Europe Food Service Industry in UAE Volume (Thousand Tons), by Country 2024 & 2032
- Figure 53: Europe Food Service Industry in UAE Revenue Share (%), by Country 2024 & 2032
- Figure 54: Europe Food Service Industry in UAE Volume Share (%), by Country 2024 & 2032
- Figure 55: Middle East & Africa Food Service Industry in UAE Revenue (Million), by Foodservice Type 2024 & 2032
- Figure 56: Middle East & Africa Food Service Industry in UAE Volume (Thousand Tons), by Foodservice Type 2024 & 2032
- Figure 57: Middle East & Africa Food Service Industry in UAE Revenue Share (%), by Foodservice Type 2024 & 2032
- Figure 58: Middle East & Africa Food Service Industry in UAE Volume Share (%), by Foodservice Type 2024 & 2032
- Figure 59: Middle East & Africa Food Service Industry in UAE Revenue (Million), by Outlet 2024 & 2032
- Figure 60: Middle East & Africa Food Service Industry in UAE Volume (Thousand Tons), by Outlet 2024 & 2032
- Figure 61: Middle East & Africa Food Service Industry in UAE Revenue Share (%), by Outlet 2024 & 2032
- Figure 62: Middle East & Africa Food Service Industry in UAE Volume Share (%), by Outlet 2024 & 2032
- Figure 63: Middle East & Africa Food Service Industry in UAE Revenue (Million), by Location 2024 & 2032
- Figure 64: Middle East & Africa Food Service Industry in UAE Volume (Thousand Tons), by Location 2024 & 2032
- Figure 65: Middle East & Africa Food Service Industry in UAE Revenue Share (%), by Location 2024 & 2032
- Figure 66: Middle East & Africa Food Service Industry in UAE Volume Share (%), by Location 2024 & 2032
- Figure 67: Middle East & Africa Food Service Industry in UAE Revenue (Million), by Country 2024 & 2032
- Figure 68: Middle East & Africa Food Service Industry in UAE Volume (Thousand Tons), by Country 2024 & 2032
- Figure 69: Middle East & Africa Food Service Industry in UAE Revenue Share (%), by Country 2024 & 2032
- Figure 70: Middle East & Africa Food Service Industry in UAE Volume Share (%), by Country 2024 & 2032
- Figure 71: Asia Pacific Food Service Industry in UAE Revenue (Million), by Foodservice Type 2024 & 2032
- Figure 72: Asia Pacific Food Service Industry in UAE Volume (Thousand Tons), by Foodservice Type 2024 & 2032
- Figure 73: Asia Pacific Food Service Industry in UAE Revenue Share (%), by Foodservice Type 2024 & 2032
- Figure 74: Asia Pacific Food Service Industry in UAE Volume Share (%), by Foodservice Type 2024 & 2032
- Figure 75: Asia Pacific Food Service Industry in UAE Revenue (Million), by Outlet 2024 & 2032
- Figure 76: Asia Pacific Food Service Industry in UAE Volume (Thousand Tons), by Outlet 2024 & 2032
- Figure 77: Asia Pacific Food Service Industry in UAE Revenue Share (%), by Outlet 2024 & 2032
- Figure 78: Asia Pacific Food Service Industry in UAE Volume Share (%), by Outlet 2024 & 2032
- Figure 79: Asia Pacific Food Service Industry in UAE Revenue (Million), by Location 2024 & 2032
- Figure 80: Asia Pacific Food Service Industry in UAE Volume (Thousand Tons), by Location 2024 & 2032
- Figure 81: Asia Pacific Food Service Industry in UAE Revenue Share (%), by Location 2024 & 2032
- Figure 82: Asia Pacific Food Service Industry in UAE Volume Share (%), by Location 2024 & 2032
- Figure 83: Asia Pacific Food Service Industry in UAE Revenue (Million), by Country 2024 & 2032
- Figure 84: Asia Pacific Food Service Industry in UAE Volume (Thousand Tons), by Country 2024 & 2032
- Figure 85: Asia Pacific Food Service Industry in UAE Revenue Share (%), by Country 2024 & 2032
- Figure 86: Asia Pacific Food Service Industry in UAE Volume Share (%), by Country 2024 & 2032
List of Tables
- Table 1: Global Food Service Industry in UAE Revenue Million Forecast, by Region 2019 & 2032
- Table 2: Global Food Service Industry in UAE Volume Thousand Tons Forecast, by Region 2019 & 2032
- Table 3: Global Food Service Industry in UAE Revenue Million Forecast, by Foodservice Type 2019 & 2032
- Table 4: Global Food Service Industry in UAE Volume Thousand Tons Forecast, by Foodservice Type 2019 & 2032
- Table 5: Global Food Service Industry in UAE Revenue Million Forecast, by Outlet 2019 & 2032
- Table 6: Global Food Service Industry in UAE Volume Thousand Tons Forecast, by Outlet 2019 & 2032
- Table 7: Global Food Service Industry in UAE Revenue Million Forecast, by Location 2019 & 2032
- Table 8: Global Food Service Industry in UAE Volume Thousand Tons Forecast, by Location 2019 & 2032
- Table 9: Global Food Service Industry in UAE Revenue Million Forecast, by Region 2019 & 2032
- Table 10: Global Food Service Industry in UAE Volume Thousand Tons Forecast, by Region 2019 & 2032
- Table 11: Global Food Service Industry in UAE Revenue Million Forecast, by Country 2019 & 2032
- Table 12: Global Food Service Industry in UAE Volume Thousand Tons Forecast, by Country 2019 & 2032
- Table 13: UAE Food Service Industry in UAE Revenue (Million) Forecast, by Application 2019 & 2032
- Table 14: UAE Food Service Industry in UAE Volume (Thousand Tons) Forecast, by Application 2019 & 2032
- Table 15: South Africa Food Service Industry in UAE Revenue (Million) Forecast, by Application 2019 & 2032
- Table 16: South Africa Food Service Industry in UAE Volume (Thousand Tons) Forecast, by Application 2019 & 2032
- Table 17: Saudi Arabia Food Service Industry in UAE Revenue (Million) Forecast, by Application 2019 & 2032
- Table 18: Saudi Arabia Food Service Industry in UAE Volume (Thousand Tons) Forecast, by Application 2019 & 2032
- Table 19: Rest of MEA Food Service Industry in UAE Revenue (Million) Forecast, by Application 2019 & 2032
- Table 20: Rest of MEA Food Service Industry in UAE Volume (Thousand Tons) Forecast, by Application 2019 & 2032
- Table 21: Global Food Service Industry in UAE Revenue Million Forecast, by Foodservice Type 2019 & 2032
- Table 22: Global Food Service Industry in UAE Volume Thousand Tons Forecast, by Foodservice Type 2019 & 2032
- Table 23: Global Food Service Industry in UAE Revenue Million Forecast, by Outlet 2019 & 2032
- Table 24: Global Food Service Industry in UAE Volume Thousand Tons Forecast, by Outlet 2019 & 2032
- Table 25: Global Food Service Industry in UAE Revenue Million Forecast, by Location 2019 & 2032
- Table 26: Global Food Service Industry in UAE Volume Thousand Tons Forecast, by Location 2019 & 2032
- Table 27: Global Food Service Industry in UAE Revenue Million Forecast, by Country 2019 & 2032
- Table 28: Global Food Service Industry in UAE Volume Thousand Tons Forecast, by Country 2019 & 2032
- Table 29: United States Food Service Industry in UAE Revenue (Million) Forecast, by Application 2019 & 2032
- Table 30: United States Food Service Industry in UAE Volume (Thousand Tons) Forecast, by Application 2019 & 2032
- Table 31: Canada Food Service Industry in UAE Revenue (Million) Forecast, by Application 2019 & 2032
- Table 32: Canada Food Service Industry in UAE Volume (Thousand Tons) Forecast, by Application 2019 & 2032
- Table 33: Mexico Food Service Industry in UAE Revenue (Million) Forecast, by Application 2019 & 2032
- Table 34: Mexico Food Service Industry in UAE Volume (Thousand Tons) Forecast, by Application 2019 & 2032
- Table 35: Global Food Service Industry in UAE Revenue Million Forecast, by Foodservice Type 2019 & 2032
- Table 36: Global Food Service Industry in UAE Volume Thousand Tons Forecast, by Foodservice Type 2019 & 2032
- Table 37: Global Food Service Industry in UAE Revenue Million Forecast, by Outlet 2019 & 2032
- Table 38: Global Food Service Industry in UAE Volume Thousand Tons Forecast, by Outlet 2019 & 2032
- Table 39: Global Food Service Industry in UAE Revenue Million Forecast, by Location 2019 & 2032
- Table 40: Global Food Service Industry in UAE Volume Thousand Tons Forecast, by Location 2019 & 2032
- Table 41: Global Food Service Industry in UAE Revenue Million Forecast, by Country 2019 & 2032
- Table 42: Global Food Service Industry in UAE Volume Thousand Tons Forecast, by Country 2019 & 2032
- Table 43: Brazil Food Service Industry in UAE Revenue (Million) Forecast, by Application 2019 & 2032
- Table 44: Brazil Food Service Industry in UAE Volume (Thousand Tons) Forecast, by Application 2019 & 2032
- Table 45: Argentina Food Service Industry in UAE Revenue (Million) Forecast, by Application 2019 & 2032
- Table 46: Argentina Food Service Industry in UAE Volume (Thousand Tons) Forecast, by Application 2019 & 2032
- Table 47: Rest of South America Food Service Industry in UAE Revenue (Million) Forecast, by Application 2019 & 2032
- Table 48: Rest of South America Food Service Industry in UAE Volume (Thousand Tons) Forecast, by Application 2019 & 2032
- Table 49: Global Food Service Industry in UAE Revenue Million Forecast, by Foodservice Type 2019 & 2032
- Table 50: Global Food Service Industry in UAE Volume Thousand Tons Forecast, by Foodservice Type 2019 & 2032
- Table 51: Global Food Service Industry in UAE Revenue Million Forecast, by Outlet 2019 & 2032
- Table 52: Global Food Service Industry in UAE Volume Thousand Tons Forecast, by Outlet 2019 & 2032
- Table 53: Global Food Service Industry in UAE Revenue Million Forecast, by Location 2019 & 2032
- Table 54: Global Food Service Industry in UAE Volume Thousand Tons Forecast, by Location 2019 & 2032
- Table 55: Global Food Service Industry in UAE Revenue Million Forecast, by Country 2019 & 2032
- Table 56: Global Food Service Industry in UAE Volume Thousand Tons Forecast, by Country 2019 & 2032
- Table 57: United Kingdom Food Service Industry in UAE Revenue (Million) Forecast, by Application 2019 & 2032
- Table 58: United Kingdom Food Service Industry in UAE Volume (Thousand Tons) Forecast, by Application 2019 & 2032
- Table 59: Germany Food Service Industry in UAE Revenue (Million) Forecast, by Application 2019 & 2032
- Table 60: Germany Food Service Industry in UAE Volume (Thousand Tons) Forecast, by Application 2019 & 2032
- Table 61: France Food Service Industry in UAE Revenue (Million) Forecast, by Application 2019 & 2032
- Table 62: France Food Service Industry in UAE Volume (Thousand Tons) Forecast, by Application 2019 & 2032
- Table 63: Italy Food Service Industry in UAE Revenue (Million) Forecast, by Application 2019 & 2032
- Table 64: Italy Food Service Industry in UAE Volume (Thousand Tons) Forecast, by Application 2019 & 2032
- Table 65: Spain Food Service Industry in UAE Revenue (Million) Forecast, by Application 2019 & 2032
- Table 66: Spain Food Service Industry in UAE Volume (Thousand Tons) Forecast, by Application 2019 & 2032
- Table 67: Russia Food Service Industry in UAE Revenue (Million) Forecast, by Application 2019 & 2032
- Table 68: Russia Food Service Industry in UAE Volume (Thousand Tons) Forecast, by Application 2019 & 2032
- Table 69: Benelux Food Service Industry in UAE Revenue (Million) Forecast, by Application 2019 & 2032
- Table 70: Benelux Food Service Industry in UAE Volume (Thousand Tons) Forecast, by Application 2019 & 2032
- Table 71: Nordics Food Service Industry in UAE Revenue (Million) Forecast, by Application 2019 & 2032
- Table 72: Nordics Food Service Industry in UAE Volume (Thousand Tons) Forecast, by Application 2019 & 2032
- Table 73: Rest of Europe Food Service Industry in UAE Revenue (Million) Forecast, by Application 2019 & 2032
- Table 74: Rest of Europe Food Service Industry in UAE Volume (Thousand Tons) Forecast, by Application 2019 & 2032
- Table 75: Global Food Service Industry in UAE Revenue Million Forecast, by Foodservice Type 2019 & 2032
- Table 76: Global Food Service Industry in UAE Volume Thousand Tons Forecast, by Foodservice Type 2019 & 2032
- Table 77: Global Food Service Industry in UAE Revenue Million Forecast, by Outlet 2019 & 2032
- Table 78: Global Food Service Industry in UAE Volume Thousand Tons Forecast, by Outlet 2019 & 2032
- Table 79: Global Food Service Industry in UAE Revenue Million Forecast, by Location 2019 & 2032
- Table 80: Global Food Service Industry in UAE Volume Thousand Tons Forecast, by Location 2019 & 2032
- Table 81: Global Food Service Industry in UAE Revenue Million Forecast, by Country 2019 & 2032
- Table 82: Global Food Service Industry in UAE Volume Thousand Tons Forecast, by Country 2019 & 2032
- Table 83: Turkey Food Service Industry in UAE Revenue (Million) Forecast, by Application 2019 & 2032
- Table 84: Turkey Food Service Industry in UAE Volume (Thousand Tons) Forecast, by Application 2019 & 2032
- Table 85: Israel Food Service Industry in UAE Revenue (Million) Forecast, by Application 2019 & 2032
- Table 86: Israel Food Service Industry in UAE Volume (Thousand Tons) Forecast, by Application 2019 & 2032
- Table 87: GCC Food Service Industry in UAE Revenue (Million) Forecast, by Application 2019 & 2032
- Table 88: GCC Food Service Industry in UAE Volume (Thousand Tons) Forecast, by Application 2019 & 2032
- Table 89: North Africa Food Service Industry in UAE Revenue (Million) Forecast, by Application 2019 & 2032
- Table 90: North Africa Food Service Industry in UAE Volume (Thousand Tons) Forecast, by Application 2019 & 2032
- Table 91: South Africa Food Service Industry in UAE Revenue (Million) Forecast, by Application 2019 & 2032
- Table 92: South Africa Food Service Industry in UAE Volume (Thousand Tons) Forecast, by Application 2019 & 2032
- Table 93: Rest of Middle East & Africa Food Service Industry in UAE Revenue (Million) Forecast, by Application 2019 & 2032
- Table 94: Rest of Middle East & Africa Food Service Industry in UAE Volume (Thousand Tons) Forecast, by Application 2019 & 2032
- Table 95: Global Food Service Industry in UAE Revenue Million Forecast, by Foodservice Type 2019 & 2032
- Table 96: Global Food Service Industry in UAE Volume Thousand Tons Forecast, by Foodservice Type 2019 & 2032
- Table 97: Global Food Service Industry in UAE Revenue Million Forecast, by Outlet 2019 & 2032
- Table 98: Global Food Service Industry in UAE Volume Thousand Tons Forecast, by Outlet 2019 & 2032
- Table 99: Global Food Service Industry in UAE Revenue Million Forecast, by Location 2019 & 2032
- Table 100: Global Food Service Industry in UAE Volume Thousand Tons Forecast, by Location 2019 & 2032
- Table 101: Global Food Service Industry in UAE Revenue Million Forecast, by Country 2019 & 2032
- Table 102: Global Food Service Industry in UAE Volume Thousand Tons Forecast, by Country 2019 & 2032
- Table 103: China Food Service Industry in UAE Revenue (Million) Forecast, by Application 2019 & 2032
- Table 104: China Food Service Industry in UAE Volume (Thousand Tons) Forecast, by Application 2019 & 2032
- Table 105: India Food Service Industry in UAE Revenue (Million) Forecast, by Application 2019 & 2032
- Table 106: India Food Service Industry in UAE Volume (Thousand Tons) Forecast, by Application 2019 & 2032
- Table 107: Japan Food Service Industry in UAE Revenue (Million) Forecast, by Application 2019 & 2032
- Table 108: Japan Food Service Industry in UAE Volume (Thousand Tons) Forecast, by Application 2019 & 2032
- Table 109: South Korea Food Service Industry in UAE Revenue (Million) Forecast, by Application 2019 & 2032
- Table 110: South Korea Food Service Industry in UAE Volume (Thousand Tons) Forecast, by Application 2019 & 2032
- Table 111: ASEAN Food Service Industry in UAE Revenue (Million) Forecast, by Application 2019 & 2032
- Table 112: ASEAN Food Service Industry in UAE Volume (Thousand Tons) Forecast, by Application 2019 & 2032
- Table 113: Oceania Food Service Industry in UAE Revenue (Million) Forecast, by Application 2019 & 2032
- Table 114: Oceania Food Service Industry in UAE Volume (Thousand Tons) Forecast, by Application 2019 & 2032
- Table 115: Rest of Asia Pacific Food Service Industry in UAE Revenue (Million) Forecast, by Application 2019 & 2032
- Table 116: Rest of Asia Pacific Food Service Industry in UAE Volume (Thousand Tons) Forecast, by Application 2019 & 2032
Frequently Asked Questions
1. What is the projected Compound Annual Growth Rate (CAGR) of the Food Service Industry in UAE?
The projected CAGR is approximately 7.00%.
2. Which companies are prominent players in the Food Service Industry in UAE?
Key companies in the market include The Olayan Grou, Galadari Ice Cream Co LLC, D ream International, The Emirates Group, Alghanim Industries & Yusuf A Alghanim & Sons WLL, Emirates Fast Food Company, CKE Restaurants Holdings Inc, Ring International Holding AG, Deli and Meal LLC, BinHendi Enterprises, Americana Restaurants International PLC, M H Alshaya Co WLL, LuLu Group International, Kamal Osman Jamjoom Group LLC, Apparel Group, Alamar Foods Company, JF Street Food, Al Khaja Group Of Companies.
3. What are the main segments of the Food Service Industry in UAE?
The market segments include Foodservice Type, Outlet, Location.
4. Can you provide details about the market size?
The market size is estimated to be USD XX Million as of 2022.
5. What are some drivers contributing to market growth?
Consumer inclination toward functional food and beverages; Increasing Number of Applications and Growing Industrial Use.
6. What are the notable trends driving market growth?
The high ex-pat population in the country and the rise in online food delivery are fuelling the market growth.
7. Are there any restraints impacting market growth?
Increasing Shift Toward Plant-Based Protein.
8. Can you provide examples of recent developments in the market?
December 2022: Americana Restaurants re-launched Wimpy, a burger brand, in the UAE market. Wimpy's new location is expected to use the innovative robotic solution as part of the restaurant's vision to become the Middle East's first tech burger brand. Flippy 2 is a robotics solution that can automate a variety of restaurant cooking tasks while assisting with consistency and accuracy at the fry station.August 2022: Americana Restaurants International PLC declared that it made a franchise agreement with a United States-based craft coffee company, Peet's Coffee, to enter the GCC market.June 2022: Americana Restaurants, the master franchisee in the MENA region for KFC, Pizza Hut, Hardee's, Krispy Kreme and more, announced that it had entered a partnership with Miso Robotics, a US-based company that has been transforming the restaurant industry through robotics and intelligent automation.
9. What pricing options are available for accessing the report?
Pricing options include single-user, multi-user, and enterprise licenses priced at USD 3800, USD 4500, and USD 5800 respectively.
10. Is the market size provided in terms of value or volume?
The market size is provided in terms of value, measured in Million and volume, measured in Thousand Tons.
11. Are there any specific market keywords associated with the report?
Yes, the market keyword associated with the report is "Food Service Industry in UAE," which aids in identifying and referencing the specific market segment covered.
12. How do I determine which pricing option suits my needs best?
The pricing options vary based on user requirements and access needs. Individual users may opt for single-user licenses, while businesses requiring broader access may choose multi-user or enterprise licenses for cost-effective access to the report.
13. Are there any additional resources or data provided in the Food Service Industry in UAE report?
While the report offers comprehensive insights, it's advisable to review the specific contents or supplementary materials provided to ascertain if additional resources or data are available.
14. How can I stay updated on further developments or reports in the Food Service Industry in UAE?
To stay informed about further developments, trends, and reports in the Food Service Industry in UAE, consider subscribing to industry newsletters, following relevant companies and organizations, or regularly checking reputable industry news sources and publications.
Methodology
Step 1 - Identification of Relevant Samples Size from Population Database


Step 2 - Approaches for Defining Global Market Size (Value, Volume* & Price*)

Note*: In applicable scenarios
Step 3 - Data Sources
Primary Research
- Web Analytics
- Survey Reports
- Research Institute
- Latest Research Reports
- Opinion Leaders
Secondary Research
- Annual Reports
- White Paper
- Latest Press Release
- Industry Association
- Paid Database
- Investor Presentations

Step 4 - Data Triangulation
Involves using different sources of information in order to increase the validity of a study
These sources are likely to be stakeholders in a program - participants, other researchers, program staff, other community members, and so on.
Then we put all data in single framework & apply various statistical tools to find out the dynamic on the market.
During the analysis stage, feedback from the stakeholder groups would be compared to determine areas of agreement as well as areas of divergence


