
Key Insights
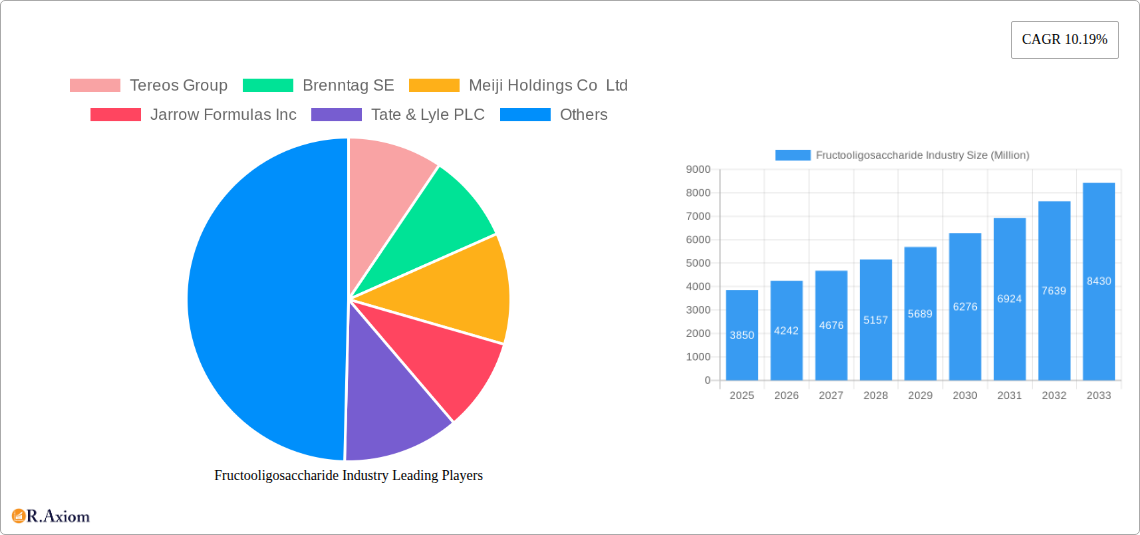
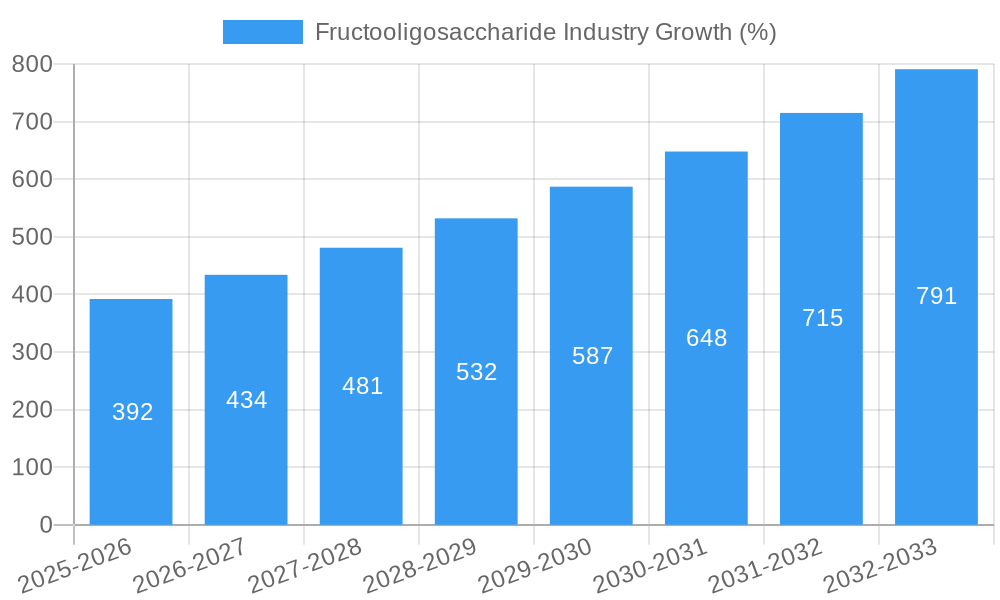
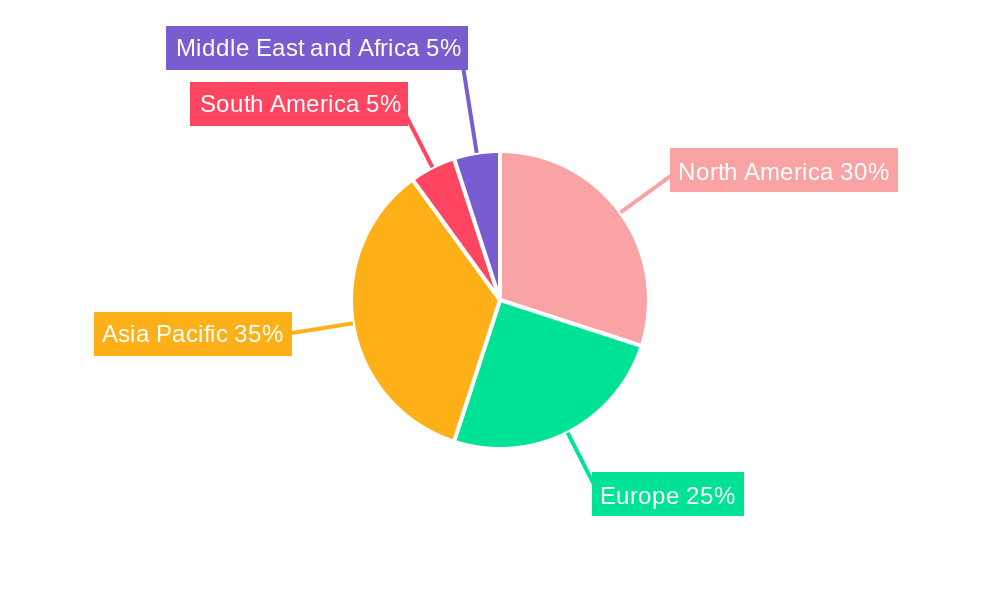
The fructooligosaccharide (FOS) market, valued at $3.85 billion in 2025, is projected to experience robust growth, driven by increasing consumer demand for prebiotic ingredients and functional foods. A Compound Annual Growth Rate (CAGR) of 10.19% from 2025 to 2033 indicates a significant expansion of the market. This growth is fueled by several key factors: the rising prevalence of health-conscious consumers seeking digestive health benefits, the increasing use of FOS in infant formula and fortified foods to enhance gut microbiome health, and the growing popularity of dietary supplements containing FOS. The pharmaceuticals and animal feed industries also contribute significantly to the overall market size, utilizing FOS for its prebiotic properties and impact on animal health and productivity. Market segmentation reveals a strong presence across various applications, with infant formula and fortified foods leading the way due to their established market penetration and consumer acceptance. Geographic segmentation shows significant market presence across North America, Europe, and Asia Pacific, with the Asia Pacific region anticipated to witness particularly rapid growth due to rising disposable incomes and increasing health awareness. The market's growth is not without challenges; price fluctuations in raw materials and stringent regulatory requirements pose potential restraints. However, continuous research and development focused on improved production methods and new applications are expected to mitigate these challenges and further bolster market growth.
The competitive landscape of the FOS market is characterized by a mix of large multinational corporations and specialized ingredient suppliers. Key players like Tereos Group, Brenntag SE, Meiji Holdings Co. Ltd., and Cargill Inc. hold significant market share, leveraging their established distribution networks and brand recognition. Smaller, specialized companies like Jarrow Formulas Inc. focus on niche segments such as dietary supplements, catering to specific consumer needs. The ongoing consolidation and strategic alliances within the industry are expected to reshape the competitive landscape further. Future growth will be significantly influenced by ongoing scientific research highlighting the multifaceted health benefits of FOS, as well as innovation in product formulations and delivery systems to cater to evolving consumer preferences and dietary trends. The market's future success hinges on sustainable sourcing of raw materials, responsible manufacturing practices, and continued emphasis on consumer education and awareness regarding the health benefits of prebiotic ingredients.
Fructooligosaccharide Industry Market Report: 2019-2033
This comprehensive report provides a detailed analysis of the global fructooligosaccharide (FOS) industry, covering market size, growth drivers, key players, and future trends. The study period spans from 2019 to 2033, with 2025 serving as the base and estimated year. The report offers actionable insights for industry stakeholders, including manufacturers, distributors, and investors.
Fructooligosaccharide Industry Market Concentration & Innovation
The fructooligosaccharide market exhibits a moderately concentrated landscape, with several large multinational corporations holding significant market share. Key players like Tereos Group, Cargill Inc, and Tate & Lyle PLC dominate the market, leveraging their extensive production capabilities and global distribution networks. However, smaller, specialized companies such as Galam Group and Baolingbao Biological Co Ltd are also making significant contributions, particularly in niche segments. Market share data for 2024 reveals that the top 5 players account for approximately xx% of the global market.
Innovation in the FOS industry centers around improving production efficiency, enhancing product functionality (e.g., solubility, stability), and expanding applications. Recent advancements include the development of novel FOS formulations with enhanced prebiotic properties, tailored for specific health benefits. Regulatory frameworks vary across regions, impacting product approvals and labeling requirements. Competition is primarily based on cost, quality, and product differentiation. Substitutes for FOS include other prebiotics like inulin and GOS, however, FOS remains preferred due to its unique properties. Mergers and acquisitions (M&A) activity is significant, as exemplified by Tate & Lyle's USD 237 million acquisition of Quantum Hi-Tech Biological Co. Ltd. in 2022. This highlights a strategic move to consolidate market share and access new technologies. The total M&A deal value in the last 5 years is estimated at USD xx Million.
- Market Concentration: Top 5 players hold approximately xx% market share (2024).
- Innovation Drivers: Improved production efficiency, enhanced product functionality, expanded applications.
- Regulatory Landscape: Varies across regions, influencing product approvals and labeling.
- M&A Activity: Significant consolidation through acquisitions, totaling USD xx Million in the last 5 years.
- Key Players' Strategies: Focus on product differentiation, cost optimization, and geographic expansion.
Fructooligosaccharide Industry Trends & Insights
The global fructooligosaccharide market is experiencing robust growth, driven by increasing consumer awareness of gut health and the associated benefits of prebiotics. The market is projected to exhibit a CAGR of xx% during the forecast period (2025-2033), reaching a market value of USD xx Million by 2033. This growth is fueled by rising demand from the food and beverage industry, particularly in infant formula and fortified foods, as well as increasing adoption in dietary supplements and animal feed. Technological advancements in fermentation processes have improved FOS production efficiency and reduced costs. Consumer preferences are shifting towards natural and clean-label ingredients, driving the demand for sustainably sourced and processed FOS. Competitive dynamics are characterized by both price competition and product differentiation strategies, including unique formulations and value-added services. Market penetration in developing economies is expected to increase significantly during the forecast period, owing to growing disposable incomes and increased health consciousness.
Dominant Markets & Segments in Fructooligosaccharide Industry
The dominant market segment is currently the Fortified Food and Beverage sector, owing to the increasing use of FOS in a variety of products. This is followed by the Dietary Supplements and Infant Formula segments. Geographically, North America and Europe currently hold significant market shares, but growth in Asia-Pacific is expected to be substantial during the forecast period.
Key Drivers for Dominant Segments:
- Fortified Food & Beverage: Growing demand for functional foods and beverages with health benefits, increasing health consciousness among consumers.
- Dietary Supplements: Rising popularity of prebiotic supplements, increasing consumer interest in gut health.
- Infant Formula: FOS is a key ingredient in infant formulas, meeting stringent quality and safety regulations.
- Animal Feed: Expanding use of FOS in animal feed to improve animal health and performance.
- Pharmaceuticals: Emerging applications in pharmaceutical formulations for specific health benefits.
Regional Dominance:
- North America and Europe currently lead due to higher consumer awareness and established markets.
- Asia-Pacific region exhibits strong growth potential, fueled by rising disposable incomes and increasing health concerns.
Fructooligosaccharide Industry Product Developments
Recent innovations focus on developing FOS with improved functionality, such as enhanced solubility and stability in various applications. This includes the development of novel formulations with tailored prebiotic effects. The market is witnessing a shift towards clean-label products, prompting companies to use more natural and sustainable production methods. This focus on functional properties and clean labels is crucial for gaining competitive advantage and meeting evolving consumer preferences.
Report Scope & Segmentation Analysis
This report segments the fructooligosaccharide market based on application: Infant Formula, Fortified Food and Beverage, Dietary Supplements, Animal Feed, and Pharmaceuticals. Each segment's growth trajectory is analyzed, considering market size, growth rate, and competitive dynamics. The report provides detailed insights into the individual market segments including growth projections and market sizes for each.
Infant Formula: This segment is characterized by stringent regulatory requirements, with high demand for safe and effective FOS.
Fortified Food and Beverage: The largest segment, characterized by strong competition and wide application in various food and beverage categories.
Dietary Supplements: This segment is expanding rapidly, driven by increasing health consciousness and demand for prebiotic supplements.
Animal Feed: A growing segment with applications focused on improved animal gut health and performance.
Pharmaceuticals: A niche segment with emerging applications in specific therapeutic areas.
Key Drivers of Fructooligosaccharide Industry Growth
The growth of the fructooligosaccharide industry is propelled by several key factors: growing consumer awareness of the importance of gut health, the increasing demand for functional foods and beverages, and the development of innovative FOS formulations with enhanced benefits. The rising adoption of FOS in animal feed, driven by the need for improved animal health and productivity, also contributes to market growth. Finally, supportive regulatory frameworks in certain regions further accelerate the industry's expansion.
Challenges in the Fructooligosaccharide Industry Sector
Challenges include price volatility of raw materials, stringent regulatory requirements, and competition from substitute prebiotics. Supply chain disruptions and fluctuations in demand can also impact profitability. These factors require careful management by industry players to ensure sustainable growth. The overall impact of these challenges is estimated to reduce market growth by approximately xx% annually.
Emerging Opportunities in Fructooligosaccharide Industry
Emerging opportunities include the development of novel FOS formulations with enhanced health benefits, expanding into new applications (e.g., cosmetics), and tapping into emerging markets with growing consumer demand. The increasing trend towards personalized nutrition and the growing demand for sustainable and ethically sourced products also present significant opportunities for innovation and expansion.
Leading Players in the Fructooligosaccharide Industry Market
- Tereos Group
- Brenntag SE
- Meiji Holdings Co Ltd
- Jarrow Formulas Inc
- Tate & Lyle PLC
- Galam Group
- Baolingbao Biological Co Ltd
- Cargill Inc
- Ingredion Incorporated
- Royal Friesland Campina NV
- Südzucker AG (BENEO)
Key Developments in Fructooligosaccharide Industry Industry
- June 2020: Galam invested USD 20 million in two new FOS production plants.
- January 2022: Galam announced plans to launch a production plant for its prebiotic GOFOS.
- March 2022: Tate & Lyle acquired Quantum Hi-Tech Biological Co. Ltd for USD 237 million.
Strategic Outlook for Fructooligosaccharide Industry Market
The fructooligosaccharide market is poised for continued growth, driven by favorable market dynamics, including rising health consciousness, increasing demand for functional foods, and ongoing innovation in product development and applications. The focus on sustainable and ethical sourcing practices will further drive market expansion and create new opportunities for industry players.
Fructooligosaccharide Industry Segmentation
-
1. Application
- 1.1. Infant Formula
- 1.2. Fortified Food and Beverage
- 1.3. Dietary Supplements
- 1.4. Animal Feed
- 1.5. Pharmaceuticals
Fructooligosaccharide Industry Segmentation By Geography
-
1. North America
- 1.1. United States
- 1.2. Canada
- 1.3. Mexico
- 1.4. Rest of North America
-
2. Europe
- 2.1. Germany
- 2.2. United Kingdom
- 2.3. Italy
- 2.4. France
- 2.5. Russia
- 2.6. Spain
- 2.7. Rest of Europe
-
3. Asia Pacific
- 3.1. India
- 3.2. China
- 3.3. Australia
- 3.4. Japan
- 3.5. Rest of Asia Pacific
-
4. South America
- 4.1. Brazil
- 4.2. Argentina
- 4.3. Rest of South America
-
5. Middle East and Africa
- 5.1. South Africa
- 5.2. Saudi Arabia
- 5.3. Rest of Middle East and Africa
Fructooligosaccharide Industry REPORT HIGHLIGHTS
| Aspects | Details |
|---|---|
| Study Period | 2019-2033 |
| Base Year | 2024 |
| Estimated Year | 2025 |
| Forecast Period | 2025-2033 |
| Historical Period | 2019-2024 |
| Growth Rate | CAGR of 10.19% from 2019-2033 |
| Segmentation |
|
Table of Contents
- 1. Introduction
- 1.1. Research Scope
- 1.2. Market Segmentation
- 1.3. Research Methodology
- 1.4. Definitions and Assumptions
- 2. Executive Summary
- 2.1. Introduction
- 3. Market Dynamics
- 3.1. Introduction
- 3.2. Market Drivers
- 3.2.1. Awareness Of Health Benefits Of Oleoresins; Rise Of Clean Label Products
- 3.3. Market Restrains
- 3.3.1. Supply Chain Volatility and Availability Of Other Flavor Ingredients
- 3.4. Market Trends
- 3.4.1. Rising Demand for Low-calorie Foods
- 4. Market Factor Analysis
- 4.1. Porters Five Forces
- 4.2. Supply/Value Chain
- 4.3. PESTEL analysis
- 4.4. Market Entropy
- 4.5. Patent/Trademark Analysis
- 5. Global Fructooligosaccharide Industry Analysis, Insights and Forecast, 2019-2031
- 5.1. Market Analysis, Insights and Forecast - by Application
- 5.1.1. Infant Formula
- 5.1.2. Fortified Food and Beverage
- 5.1.3. Dietary Supplements
- 5.1.4. Animal Feed
- 5.1.5. Pharmaceuticals
- 5.2. Market Analysis, Insights and Forecast - by Region
- 5.2.1. North America
- 5.2.2. Europe
- 5.2.3. Asia Pacific
- 5.2.4. South America
- 5.2.5. Middle East and Africa
- 5.1. Market Analysis, Insights and Forecast - by Application
- 6. North America Fructooligosaccharide Industry Analysis, Insights and Forecast, 2019-2031
- 6.1. Market Analysis, Insights and Forecast - by Application
- 6.1.1. Infant Formula
- 6.1.2. Fortified Food and Beverage
- 6.1.3. Dietary Supplements
- 6.1.4. Animal Feed
- 6.1.5. Pharmaceuticals
- 6.1. Market Analysis, Insights and Forecast - by Application
- 7. Europe Fructooligosaccharide Industry Analysis, Insights and Forecast, 2019-2031
- 7.1. Market Analysis, Insights and Forecast - by Application
- 7.1.1. Infant Formula
- 7.1.2. Fortified Food and Beverage
- 7.1.3. Dietary Supplements
- 7.1.4. Animal Feed
- 7.1.5. Pharmaceuticals
- 7.1. Market Analysis, Insights and Forecast - by Application
- 8. Asia Pacific Fructooligosaccharide Industry Analysis, Insights and Forecast, 2019-2031
- 8.1. Market Analysis, Insights and Forecast - by Application
- 8.1.1. Infant Formula
- 8.1.2. Fortified Food and Beverage
- 8.1.3. Dietary Supplements
- 8.1.4. Animal Feed
- 8.1.5. Pharmaceuticals
- 8.1. Market Analysis, Insights and Forecast - by Application
- 9. South America Fructooligosaccharide Industry Analysis, Insights and Forecast, 2019-2031
- 9.1. Market Analysis, Insights and Forecast - by Application
- 9.1.1. Infant Formula
- 9.1.2. Fortified Food and Beverage
- 9.1.3. Dietary Supplements
- 9.1.4. Animal Feed
- 9.1.5. Pharmaceuticals
- 9.1. Market Analysis, Insights and Forecast - by Application
- 10. Middle East and Africa Fructooligosaccharide Industry Analysis, Insights and Forecast, 2019-2031
- 10.1. Market Analysis, Insights and Forecast - by Application
- 10.1.1. Infant Formula
- 10.1.2. Fortified Food and Beverage
- 10.1.3. Dietary Supplements
- 10.1.4. Animal Feed
- 10.1.5. Pharmaceuticals
- 10.1. Market Analysis, Insights and Forecast - by Application
- 11. North America Fructooligosaccharide Industry Analysis, Insights and Forecast, 2019-2031
- 11.1. Market Analysis, Insights and Forecast - By Country/Sub-region
- 11.1.1 United States
- 11.1.2 Canada
- 11.1.3 Mexico
- 11.1.4 Rest of North America
- 12. Europe Fructooligosaccharide Industry Analysis, Insights and Forecast, 2019-2031
- 12.1. Market Analysis, Insights and Forecast - By Country/Sub-region
- 12.1.1 Germany
- 12.1.2 United Kingdom
- 12.1.3 Italy
- 12.1.4 France
- 12.1.5 Russia
- 12.1.6 Spain
- 12.1.7 Rest of Europe
- 13. Asia Pacific Fructooligosaccharide Industry Analysis, Insights and Forecast, 2019-2031
- 13.1. Market Analysis, Insights and Forecast - By Country/Sub-region
- 13.1.1 India
- 13.1.2 China
- 13.1.3 Australia
- 13.1.4 Japan
- 13.1.5 Rest of Asia Pacific
- 14. South America Fructooligosaccharide Industry Analysis, Insights and Forecast, 2019-2031
- 14.1. Market Analysis, Insights and Forecast - By Country/Sub-region
- 14.1.1 Brazil
- 14.1.2 Argentina
- 14.1.3 Rest of South America
- 15. Middle East and Africa Fructooligosaccharide Industry Analysis, Insights and Forecast, 2019-2031
- 15.1. Market Analysis, Insights and Forecast - By Country/Sub-region
- 15.1.1 South Africa
- 15.1.2 Saudi Arabia
- 15.1.3 Rest of Middle East and Africa
- 16. Competitive Analysis
- 16.1. Global Market Share Analysis 2024
- 16.2. Company Profiles
- 16.2.1 Tereos Group
- 16.2.1.1. Overview
- 16.2.1.2. Products
- 16.2.1.3. SWOT Analysis
- 16.2.1.4. Recent Developments
- 16.2.1.5. Financials (Based on Availability)
- 16.2.2 Brenntag SE
- 16.2.2.1. Overview
- 16.2.2.2. Products
- 16.2.2.3. SWOT Analysis
- 16.2.2.4. Recent Developments
- 16.2.2.5. Financials (Based on Availability)
- 16.2.3 Meiji Holdings Co Ltd
- 16.2.3.1. Overview
- 16.2.3.2. Products
- 16.2.3.3. SWOT Analysis
- 16.2.3.4. Recent Developments
- 16.2.3.5. Financials (Based on Availability)
- 16.2.4 Jarrow Formulas Inc
- 16.2.4.1. Overview
- 16.2.4.2. Products
- 16.2.4.3. SWOT Analysis
- 16.2.4.4. Recent Developments
- 16.2.4.5. Financials (Based on Availability)
- 16.2.5 Tate & Lyle PLC
- 16.2.5.1. Overview
- 16.2.5.2. Products
- 16.2.5.3. SWOT Analysis
- 16.2.5.4. Recent Developments
- 16.2.5.5. Financials (Based on Availability)
- 16.2.6 Galam Group
- 16.2.6.1. Overview
- 16.2.6.2. Products
- 16.2.6.3. SWOT Analysis
- 16.2.6.4. Recent Developments
- 16.2.6.5. Financials (Based on Availability)
- 16.2.7 Baolingbao Biological Co Ltd
- 16.2.7.1. Overview
- 16.2.7.2. Products
- 16.2.7.3. SWOT Analysis
- 16.2.7.4. Recent Developments
- 16.2.7.5. Financials (Based on Availability)
- 16.2.8 Cargill Inc
- 16.2.8.1. Overview
- 16.2.8.2. Products
- 16.2.8.3. SWOT Analysis
- 16.2.8.4. Recent Developments
- 16.2.8.5. Financials (Based on Availability)
- 16.2.9 Ingredion Incorporated
- 16.2.9.1. Overview
- 16.2.9.2. Products
- 16.2.9.3. SWOT Analysis
- 16.2.9.4. Recent Developments
- 16.2.9.5. Financials (Based on Availability)
- 16.2.10 Royal Friesland Campina NV
- 16.2.10.1. Overview
- 16.2.10.2. Products
- 16.2.10.3. SWOT Analysis
- 16.2.10.4. Recent Developments
- 16.2.10.5. Financials (Based on Availability)
- 16.2.11 Südzucker AG (BENEO)
- 16.2.11.1. Overview
- 16.2.11.2. Products
- 16.2.11.3. SWOT Analysis
- 16.2.11.4. Recent Developments
- 16.2.11.5. Financials (Based on Availability)
- 16.2.1 Tereos Group
List of Figures
- Figure 1: Global Fructooligosaccharide Industry Revenue Breakdown (Million, %) by Region 2024 & 2032
- Figure 2: North America Fructooligosaccharide Industry Revenue (Million), by Country 2024 & 2032
- Figure 3: North America Fructooligosaccharide Industry Revenue Share (%), by Country 2024 & 2032
- Figure 4: Europe Fructooligosaccharide Industry Revenue (Million), by Country 2024 & 2032
- Figure 5: Europe Fructooligosaccharide Industry Revenue Share (%), by Country 2024 & 2032
- Figure 6: Asia Pacific Fructooligosaccharide Industry Revenue (Million), by Country 2024 & 2032
- Figure 7: Asia Pacific Fructooligosaccharide Industry Revenue Share (%), by Country 2024 & 2032
- Figure 8: South America Fructooligosaccharide Industry Revenue (Million), by Country 2024 & 2032
- Figure 9: South America Fructooligosaccharide Industry Revenue Share (%), by Country 2024 & 2032
- Figure 10: Middle East and Africa Fructooligosaccharide Industry Revenue (Million), by Country 2024 & 2032
- Figure 11: Middle East and Africa Fructooligosaccharide Industry Revenue Share (%), by Country 2024 & 2032
- Figure 12: North America Fructooligosaccharide Industry Revenue (Million), by Application 2024 & 2032
- Figure 13: North America Fructooligosaccharide Industry Revenue Share (%), by Application 2024 & 2032
- Figure 14: North America Fructooligosaccharide Industry Revenue (Million), by Country 2024 & 2032
- Figure 15: North America Fructooligosaccharide Industry Revenue Share (%), by Country 2024 & 2032
- Figure 16: Europe Fructooligosaccharide Industry Revenue (Million), by Application 2024 & 2032
- Figure 17: Europe Fructooligosaccharide Industry Revenue Share (%), by Application 2024 & 2032
- Figure 18: Europe Fructooligosaccharide Industry Revenue (Million), by Country 2024 & 2032
- Figure 19: Europe Fructooligosaccharide Industry Revenue Share (%), by Country 2024 & 2032
- Figure 20: Asia Pacific Fructooligosaccharide Industry Revenue (Million), by Application 2024 & 2032
- Figure 21: Asia Pacific Fructooligosaccharide Industry Revenue Share (%), by Application 2024 & 2032
- Figure 22: Asia Pacific Fructooligosaccharide Industry Revenue (Million), by Country 2024 & 2032
- Figure 23: Asia Pacific Fructooligosaccharide Industry Revenue Share (%), by Country 2024 & 2032
- Figure 24: South America Fructooligosaccharide Industry Revenue (Million), by Application 2024 & 2032
- Figure 25: South America Fructooligosaccharide Industry Revenue Share (%), by Application 2024 & 2032
- Figure 26: South America Fructooligosaccharide Industry Revenue (Million), by Country 2024 & 2032
- Figure 27: South America Fructooligosaccharide Industry Revenue Share (%), by Country 2024 & 2032
- Figure 28: Middle East and Africa Fructooligosaccharide Industry Revenue (Million), by Application 2024 & 2032
- Figure 29: Middle East and Africa Fructooligosaccharide Industry Revenue Share (%), by Application 2024 & 2032
- Figure 30: Middle East and Africa Fructooligosaccharide Industry Revenue (Million), by Country 2024 & 2032
- Figure 31: Middle East and Africa Fructooligosaccharide Industry Revenue Share (%), by Country 2024 & 2032
List of Tables
- Table 1: Global Fructooligosaccharide Industry Revenue Million Forecast, by Region 2019 & 2032
- Table 2: Global Fructooligosaccharide Industry Revenue Million Forecast, by Application 2019 & 2032
- Table 3: Global Fructooligosaccharide Industry Revenue Million Forecast, by Region 2019 & 2032
- Table 4: Global Fructooligosaccharide Industry Revenue Million Forecast, by Country 2019 & 2032
- Table 5: United States Fructooligosaccharide Industry Revenue (Million) Forecast, by Application 2019 & 2032
- Table 6: Canada Fructooligosaccharide Industry Revenue (Million) Forecast, by Application 2019 & 2032
- Table 7: Mexico Fructooligosaccharide Industry Revenue (Million) Forecast, by Application 2019 & 2032
- Table 8: Rest of North America Fructooligosaccharide Industry Revenue (Million) Forecast, by Application 2019 & 2032
- Table 9: Global Fructooligosaccharide Industry Revenue Million Forecast, by Country 2019 & 2032
- Table 10: Germany Fructooligosaccharide Industry Revenue (Million) Forecast, by Application 2019 & 2032
- Table 11: United Kingdom Fructooligosaccharide Industry Revenue (Million) Forecast, by Application 2019 & 2032
- Table 12: Italy Fructooligosaccharide Industry Revenue (Million) Forecast, by Application 2019 & 2032
- Table 13: France Fructooligosaccharide Industry Revenue (Million) Forecast, by Application 2019 & 2032
- Table 14: Russia Fructooligosaccharide Industry Revenue (Million) Forecast, by Application 2019 & 2032
- Table 15: Spain Fructooligosaccharide Industry Revenue (Million) Forecast, by Application 2019 & 2032
- Table 16: Rest of Europe Fructooligosaccharide Industry Revenue (Million) Forecast, by Application 2019 & 2032
- Table 17: Global Fructooligosaccharide Industry Revenue Million Forecast, by Country 2019 & 2032
- Table 18: India Fructooligosaccharide Industry Revenue (Million) Forecast, by Application 2019 & 2032
- Table 19: China Fructooligosaccharide Industry Revenue (Million) Forecast, by Application 2019 & 2032
- Table 20: Australia Fructooligosaccharide Industry Revenue (Million) Forecast, by Application 2019 & 2032
- Table 21: Japan Fructooligosaccharide Industry Revenue (Million) Forecast, by Application 2019 & 2032
- Table 22: Rest of Asia Pacific Fructooligosaccharide Industry Revenue (Million) Forecast, by Application 2019 & 2032
- Table 23: Global Fructooligosaccharide Industry Revenue Million Forecast, by Country 2019 & 2032
- Table 24: Brazil Fructooligosaccharide Industry Revenue (Million) Forecast, by Application 2019 & 2032
- Table 25: Argentina Fructooligosaccharide Industry Revenue (Million) Forecast, by Application 2019 & 2032
- Table 26: Rest of South America Fructooligosaccharide Industry Revenue (Million) Forecast, by Application 2019 & 2032
- Table 27: Global Fructooligosaccharide Industry Revenue Million Forecast, by Country 2019 & 2032
- Table 28: South Africa Fructooligosaccharide Industry Revenue (Million) Forecast, by Application 2019 & 2032
- Table 29: Saudi Arabia Fructooligosaccharide Industry Revenue (Million) Forecast, by Application 2019 & 2032
- Table 30: Rest of Middle East and Africa Fructooligosaccharide Industry Revenue (Million) Forecast, by Application 2019 & 2032
- Table 31: Global Fructooligosaccharide Industry Revenue Million Forecast, by Application 2019 & 2032
- Table 32: Global Fructooligosaccharide Industry Revenue Million Forecast, by Country 2019 & 2032
- Table 33: United States Fructooligosaccharide Industry Revenue (Million) Forecast, by Application 2019 & 2032
- Table 34: Canada Fructooligosaccharide Industry Revenue (Million) Forecast, by Application 2019 & 2032
- Table 35: Mexico Fructooligosaccharide Industry Revenue (Million) Forecast, by Application 2019 & 2032
- Table 36: Rest of North America Fructooligosaccharide Industry Revenue (Million) Forecast, by Application 2019 & 2032
- Table 37: Global Fructooligosaccharide Industry Revenue Million Forecast, by Application 2019 & 2032
- Table 38: Global Fructooligosaccharide Industry Revenue Million Forecast, by Country 2019 & 2032
- Table 39: Germany Fructooligosaccharide Industry Revenue (Million) Forecast, by Application 2019 & 2032
- Table 40: United Kingdom Fructooligosaccharide Industry Revenue (Million) Forecast, by Application 2019 & 2032
- Table 41: Italy Fructooligosaccharide Industry Revenue (Million) Forecast, by Application 2019 & 2032
- Table 42: France Fructooligosaccharide Industry Revenue (Million) Forecast, by Application 2019 & 2032
- Table 43: Russia Fructooligosaccharide Industry Revenue (Million) Forecast, by Application 2019 & 2032
- Table 44: Spain Fructooligosaccharide Industry Revenue (Million) Forecast, by Application 2019 & 2032
- Table 45: Rest of Europe Fructooligosaccharide Industry Revenue (Million) Forecast, by Application 2019 & 2032
- Table 46: Global Fructooligosaccharide Industry Revenue Million Forecast, by Application 2019 & 2032
- Table 47: Global Fructooligosaccharide Industry Revenue Million Forecast, by Country 2019 & 2032
- Table 48: India Fructooligosaccharide Industry Revenue (Million) Forecast, by Application 2019 & 2032
- Table 49: China Fructooligosaccharide Industry Revenue (Million) Forecast, by Application 2019 & 2032
- Table 50: Australia Fructooligosaccharide Industry Revenue (Million) Forecast, by Application 2019 & 2032
- Table 51: Japan Fructooligosaccharide Industry Revenue (Million) Forecast, by Application 2019 & 2032
- Table 52: Rest of Asia Pacific Fructooligosaccharide Industry Revenue (Million) Forecast, by Application 2019 & 2032
- Table 53: Global Fructooligosaccharide Industry Revenue Million Forecast, by Application 2019 & 2032
- Table 54: Global Fructooligosaccharide Industry Revenue Million Forecast, by Country 2019 & 2032
- Table 55: Brazil Fructooligosaccharide Industry Revenue (Million) Forecast, by Application 2019 & 2032
- Table 56: Argentina Fructooligosaccharide Industry Revenue (Million) Forecast, by Application 2019 & 2032
- Table 57: Rest of South America Fructooligosaccharide Industry Revenue (Million) Forecast, by Application 2019 & 2032
- Table 58: Global Fructooligosaccharide Industry Revenue Million Forecast, by Application 2019 & 2032
- Table 59: Global Fructooligosaccharide Industry Revenue Million Forecast, by Country 2019 & 2032
- Table 60: South Africa Fructooligosaccharide Industry Revenue (Million) Forecast, by Application 2019 & 2032
- Table 61: Saudi Arabia Fructooligosaccharide Industry Revenue (Million) Forecast, by Application 2019 & 2032
- Table 62: Rest of Middle East and Africa Fructooligosaccharide Industry Revenue (Million) Forecast, by Application 2019 & 2032
Frequently Asked Questions
1. What is the projected Compound Annual Growth Rate (CAGR) of the Fructooligosaccharide Industry?
The projected CAGR is approximately 10.19%.
2. Which companies are prominent players in the Fructooligosaccharide Industry?
Key companies in the market include Tereos Group, Brenntag SE, Meiji Holdings Co Ltd, Jarrow Formulas Inc, Tate & Lyle PLC, Galam Group, Baolingbao Biological Co Ltd, Cargill Inc, Ingredion Incorporated, Royal Friesland Campina NV, Südzucker AG (BENEO).
3. What are the main segments of the Fructooligosaccharide Industry?
The market segments include Application.
4. Can you provide details about the market size?
The market size is estimated to be USD 3.85 Million as of 2022.
5. What are some drivers contributing to market growth?
Awareness Of Health Benefits Of Oleoresins; Rise Of Clean Label Products.
6. What are the notable trends driving market growth?
Rising Demand for Low-calorie Foods.
7. Are there any restraints impacting market growth?
Supply Chain Volatility and Availability Of Other Flavor Ingredients.
8. Can you provide examples of recent developments in the market?
In March 2022, Tate & Lyle PLC (Tate & Lyle), a leading global provider of food and beverage ingredients and solutions, announced the signing of an agreement to acquire Quantum Hi-Tech Biological Co. Ltd (Quantum), engaged in the research, development, production, and sale of fructooligosaccharides (FOS) and galactooligosaccharides (GOS) and a leading prebiotic dietary fiber business in China, from ChemPartner Pharmatech Co. Ltd (ChemPartner) for a total consideration of USD 237 million.
9. What pricing options are available for accessing the report?
Pricing options include single-user, multi-user, and enterprise licenses priced at USD 4750, USD 5250, and USD 8750 respectively.
10. Is the market size provided in terms of value or volume?
The market size is provided in terms of value, measured in Million.
11. Are there any specific market keywords associated with the report?
Yes, the market keyword associated with the report is "Fructooligosaccharide Industry," which aids in identifying and referencing the specific market segment covered.
12. How do I determine which pricing option suits my needs best?
The pricing options vary based on user requirements and access needs. Individual users may opt for single-user licenses, while businesses requiring broader access may choose multi-user or enterprise licenses for cost-effective access to the report.
13. Are there any additional resources or data provided in the Fructooligosaccharide Industry report?
While the report offers comprehensive insights, it's advisable to review the specific contents or supplementary materials provided to ascertain if additional resources or data are available.
14. How can I stay updated on further developments or reports in the Fructooligosaccharide Industry?
To stay informed about further developments, trends, and reports in the Fructooligosaccharide Industry, consider subscribing to industry newsletters, following relevant companies and organizations, or regularly checking reputable industry news sources and publications.
Methodology
Step 1 - Identification of Relevant Samples Size from Population Database


Step 2 - Approaches for Defining Global Market Size (Value, Volume* & Price*)

Note*: In applicable scenarios
Step 3 - Data Sources
Primary Research
- Web Analytics
- Survey Reports
- Research Institute
- Latest Research Reports
- Opinion Leaders
Secondary Research
- Annual Reports
- White Paper
- Latest Press Release
- Industry Association
- Paid Database
- Investor Presentations

Step 4 - Data Triangulation
Involves using different sources of information in order to increase the validity of a study
These sources are likely to be stakeholders in a program - participants, other researchers, program staff, other community members, and so on.
Then we put all data in single framework & apply various statistical tools to find out the dynamic on the market.
During the analysis stage, feedback from the stakeholder groups would be compared to determine areas of agreement as well as areas of divergence


