

Key Insights
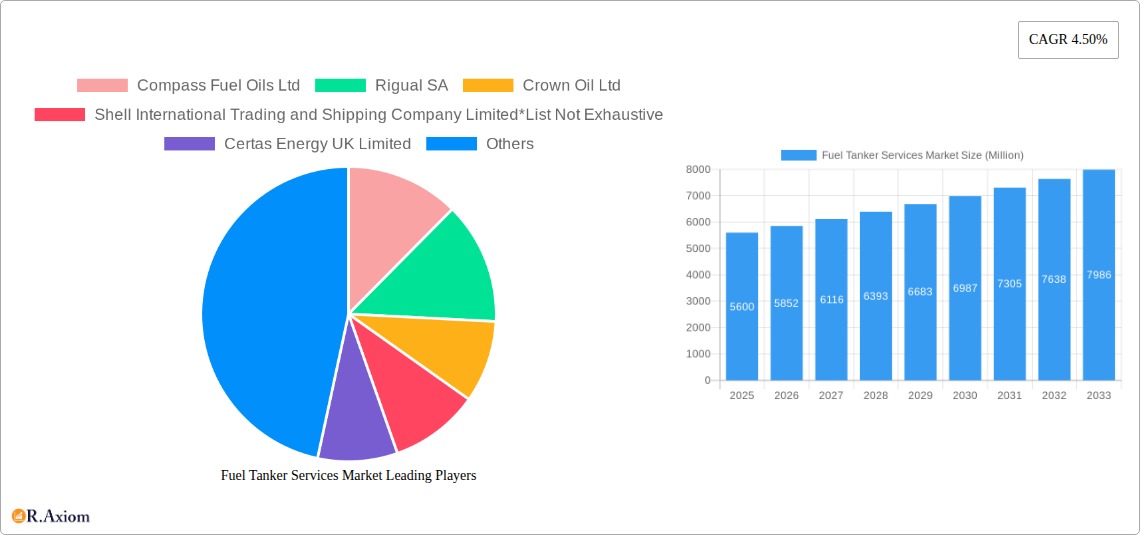
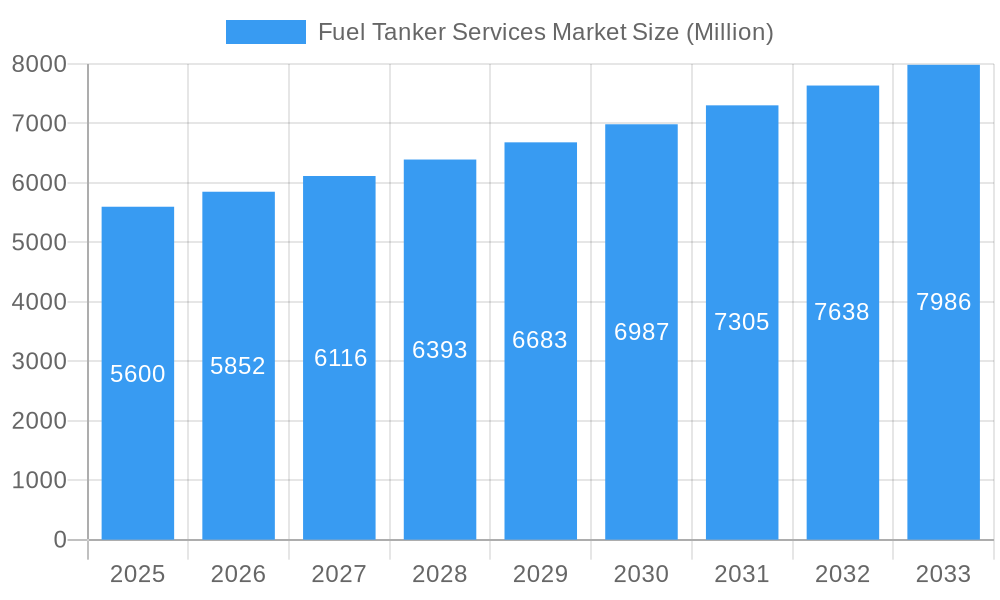
The global Fuel Tanker Services market, valued at $5.60 billion in 2025, is projected to experience robust growth, exhibiting a Compound Annual Growth Rate (CAGR) of 4.50% from 2025 to 2033. This expansion is driven by several key factors. Firstly, the increasing demand for fuel across various sectors, including transportation, energy production, and industrial applications, fuels the need for efficient and reliable fuel tanker services. Secondly, the global shift towards cleaner energy sources, while presenting challenges, also opens opportunities for specialized fuel tanker services catering to the transportation of LNG and other alternative fuels. Technological advancements in tanker design, incorporating features like enhanced safety mechanisms and improved fuel efficiency, are further contributing to market growth. The market is segmented by tanker capacity (below 20,000 liters, 30,000-40,000 liters, above 40,000 liters), fuel type (petrol, LNG, other fuels), operator type (retail petrol companies, refineries), and material type (carbon steel, stainless steel, aluminum alloy). Geographic distribution reveals significant market presence across North America, Europe, and Asia-Pacific, with emerging markets in South America and the Middle East and Africa demonstrating considerable growth potential. However, fluctuating fuel prices and stringent environmental regulations pose challenges to market expansion.
Fuel Tanker Services Market Market Size (In Billion)
The competitive landscape is characterized by a mix of large multinational corporations like Shell International Trading and Shipping Company Limited and regional players such as Compass Fuel Oils Ltd and Certas Energy UK Limited. The market is likely to witness increased consolidation and strategic partnerships as companies seek to enhance their operational efficiency and expand their market share. Growth will be influenced by government policies promoting sustainable transportation and infrastructure development. The increasing adoption of advanced logistics and tracking technologies within the fuel transportation sector will also play a crucial role in shaping market dynamics over the forecast period. Companies are focusing on enhancing their service offerings by adopting innovative technologies, including digital platforms for real-time tracking and improved route optimization. This will ultimately lead to enhanced efficiency, reduced operational costs, and improved customer satisfaction. The forecast period will see a continuous expansion of the market driven by the previously mentioned factors.
Fuel Tanker Services Market Company Market Share
Fuel Tanker Services Market: A Comprehensive Report (2019-2033)
This in-depth report provides a comprehensive analysis of the Fuel Tanker Services Market, offering invaluable insights for industry stakeholders, investors, and strategic decision-makers. The study covers the period from 2019 to 2033, with 2025 serving as the base and estimated year. The report meticulously examines market dynamics, segmentation, key players, and future growth potential, providing actionable intelligence to navigate this evolving landscape. The market is valued at xx Million in 2025 and is projected to reach xx Million by 2033, exhibiting a CAGR of xx%.
Fuel Tanker Services Market Market Concentration & Innovation
The Fuel Tanker Services market exhibits a moderately concentrated structure, with a few large players holding significant market share. Companies like Shell International Trading and Shipping Company Limited, Compass Fuel Oils Ltd, Certas Energy UK Limited, Rigual SA, and Crown Oil Ltd represent key market participants, though the market also includes numerous smaller regional operators. Precise market share data for individual companies remains confidential, but competitive analysis suggests a relatively even distribution among the top five, with a long tail of smaller enterprises.
Mergers and acquisitions (M&A) activity has been moderate in recent years, with deal values averaging xx Million per transaction. Innovation is primarily driven by advancements in tanker design (e.g., improved fuel efficiency, enhanced safety features), the adoption of alternative fuels (LNG, biofuels), and the implementation of advanced logistics and tracking technologies. Regulatory frameworks, including emission standards and safety regulations, significantly influence market dynamics, pushing innovation toward cleaner and safer transportation solutions. Product substitutes, primarily pipelines and rail transportation, exert competitive pressure, depending on factors like distance, fuel type, and transportation costs. End-user trends, focusing on efficiency, sustainability, and cost-effectiveness, heavily influence market demand.
- Market Concentration: Moderately concentrated, with several large players.
- M&A Activity: Moderate, with average deal values of xx Million.
- Innovation Drivers: Improved tanker design, alternative fuels, advanced logistics.
- Regulatory Influence: Emission standards and safety regulations drive innovation.
- Substitute Products: Pipelines and rail transportation.
- End-User Trends: Focus on efficiency, sustainability, and cost.
Fuel Tanker Services Market Industry Trends & Insights
The Fuel Tanker Services market is experiencing robust growth, fueled by rising global fuel consumption, expanding infrastructure projects, and increasing cross-border trade. Technological disruptions, such as the adoption of telematics and IoT devices for enhanced fleet management and real-time tracking, are transforming the industry. Consumer preferences are shifting towards sustainable transportation options, increasing demand for LNG and biofuel tankers. The market is characterized by intense competition, requiring companies to prioritize operational efficiency, cost optimization, and customer service. The market penetration of LNG tankers is gradually increasing, driven by environmental concerns and government initiatives promoting cleaner fuels.
Dominant Markets & Segments in Fuel Tanker Services Market
The Fuel Tanker Services market is geographically diverse, with significant activity across various regions. While precise regional dominance requires detailed market data unavailable currently, initial analysis suggests a strong presence in developed economies with extensive transportation networks and high fuel consumption.
- Leading Segments:
- Capacity: The "Above 40000 Liters" segment holds the largest market share due to the economies of scale in long-haul transportation.
- Fuel Type: Petrol remains the dominant fuel type, with the LNG segment exhibiting strong growth potential driven by sustainability initiatives.
- Operator: Refineries and retail petrol companies represent significant segments.
- Material Type: Carbon steel remains prevalent due to its cost-effectiveness, while stainless steel and aluminum alloys are employed for specialized applications.
Key Drivers for Dominant Segments:
- Economic policies: Government support for infrastructure development and fuel transportation.
- Infrastructure: Well-established road networks and port facilities.
- Demand for fuel: High consumption levels in densely populated regions.
- Regulatory Environment: Stringent safety and environmental regulations.
Fuel Tanker Services Market Product Developments
Recent product innovations include the development of more fuel-efficient tanker designs, incorporating advanced technologies like aerodynamic improvements and optimized routing software. The integration of telematics and IoT systems allows for real-time monitoring of fuel levels, location, and vehicle performance, improving efficiency and safety. These developments enhance operational efficiency, reduce fuel consumption, and improve overall safety, contributing to a competitive edge in the market.
Report Scope & Segmentation Analysis
This report comprehensively segments the Fuel Tanker Services market based on capacity (Below 20000 Liters, 30000 - 40000 Liters, Above 40000 Liters), fuel type (Petrol, LNG, Other Fuels), operator (Retail Petrol Companies, Refineries), and material type (Carbon Steel, Stainless Steel, Aluminum Alloy). Each segment is analyzed in detail, providing insights into growth projections, market size, and competitive dynamics. The “Above 40,000 Liters” capacity segment is projected to experience the highest growth due to economies of scale, while the LNG fuel type is anticipated to show significant growth due to increasing environmental concerns.
Key Drivers of Fuel Tanker Services Market Growth
The Fuel Tanker Services market's growth is propelled by several key factors. Rising global fuel demand driven by economic growth and increased industrial activity is a primary driver. Expansion of infrastructure projects, including new roads, pipelines, and port facilities, supports the market's growth. Stringent regulations on fuel transportation safety and environmental standards promote the adoption of advanced tanker technologies and cleaner fuels.
Challenges in the Fuel Tanker Services Market Sector
The Fuel Tanker Services market faces challenges including fluctuating fuel prices impacting profitability, stringent regulatory compliance costs, and intense competition from other modes of transportation. Supply chain disruptions and geopolitical instability can also impact operations and fuel availability. These factors can negatively affect market growth and profitability, requiring companies to develop robust risk management strategies.
Emerging Opportunities in Fuel Tanker Services Market
Emerging opportunities lie in the expansion into new markets with developing infrastructure, the adoption of alternative fuels like LNG and biofuels, and the utilization of advanced technologies such as autonomous driving and predictive maintenance. The growing focus on sustainability presents opportunities for companies offering environmentally friendly transportation solutions.
Leading Players in the Fuel Tanker Services Market Market
- Compass Fuel Oils Ltd
- Rigual SA
- Crown Oil Ltd
- Shell International Trading and Shipping Company Limited
- Certas Energy UK Limited
Key Developments in Fuel Tanker Services Market Industry
- January 2024: Compass Fuel Oils Ltd announced the acquisition of a new Arctic fuel tanker, enhancing its capacity and expanding its fleet. This strategic move signifies a commitment to bolstering its market position.
- December 2023: ReFuels initiated construction of a new CNG refueling facility, supporting the UK's push for sustainable transportation. This development highlights a shift towards environmentally friendly options within the fuel transportation sector.
Strategic Outlook for Fuel Tanker Services Market Market
The Fuel Tanker Services market is poised for continued growth, driven by increasing fuel demand, infrastructure development, and the adoption of advanced technologies. Companies that focus on sustainability, operational efficiency, and technological innovation will be best positioned to capitalize on the market’s future potential and address the challenges posed by shifting regulations and competitive pressures. The market’s long-term outlook remains positive, fueled by ongoing investments in infrastructure and a rising demand for reliable and efficient fuel transportation.
Fuel Tanker Services Market Segmentation
-
1. Material Type
- 1.1. Carbon Steel
- 1.2. Stainless Steel
- 1.3. Aluminum Alloy
-
2. Capacity
- 2.1. Below 20000 Liters
- 2.2. 30000 - 40000 Liters
- 2.3. Above 40000 Liters
-
3. Fuel Type
- 3.1. Petrol
- 3.2. LNG
- 3.3. Other Fuels
-
4. Operator
- 4.1. Retail Petrol Companies
- 4.2. Refineries
Fuel Tanker Services Market Segmentation By Geography
-
1. North America
- 1.1. United States
- 1.2. Canada
- 1.3. Rest of North America
-
2. Europe
- 2.1. Germany
- 2.2. France
- 2.3. United Kingdom
- 2.4. Italy
- 2.5. Spain
- 2.6. NORDIC
- 2.7. Russia
- 2.8. Rest of Europe
-
3. Asia Pacific
- 3.1. China
- 3.2. India
- 3.3. Australia
- 3.4. Malaysia
- 3.5. Indonesia
- 3.6. Thailand
- 3.7. Vietnam
- 3.8. Rest of Asia Pacific
-
4. Middle East and Africa
- 4.1. Saudi Arabia
- 4.2. United Arab Emirates
- 4.3. South Africa
- 4.4. Nigeria
- 4.5. Rest of Middle East and Africa
- 4.6. Egypt
-
5. South America
- 5.1. Brazil
- 5.2. Argentina
- 5.3. Colombia
- 5.4. Rest of South America
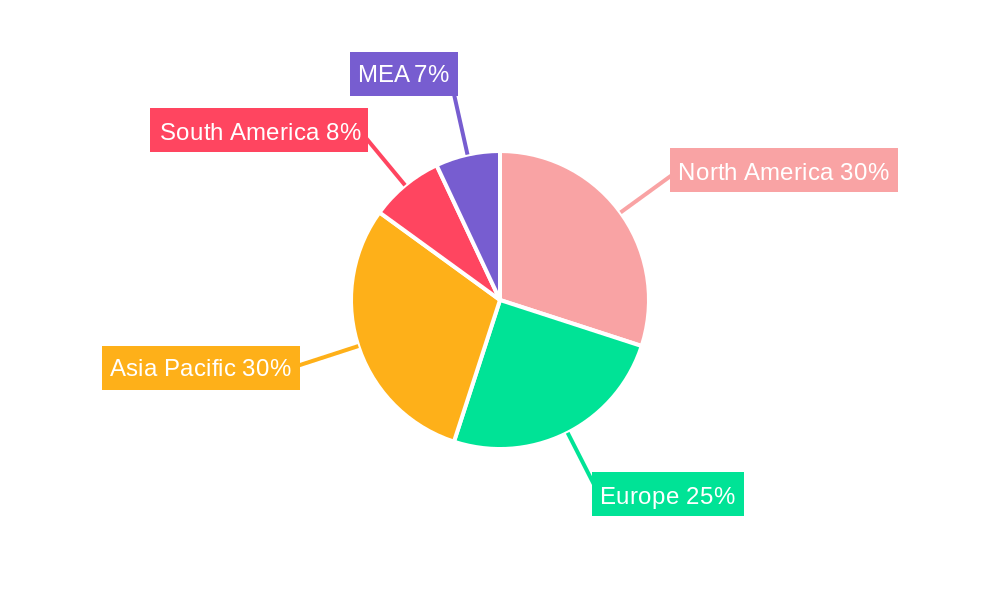
Fuel Tanker Services Market Regional Market Share
Geographic Coverage of Fuel Tanker Services Market
Fuel Tanker Services Market REPORT HIGHLIGHTS
| Aspects | Details |
|---|---|
| Study Period | 2020-2034 |
| Base Year | 2025 |
| Estimated Year | 2026 |
| Forecast Period | 2026-2034 |
| Historical Period | 2020-2025 |
| Growth Rate | CAGR of 4.50% from 2020-2034 |
| Segmentation |
|
Table of Contents
- 1. Introduction
- 1.1. Research Scope
- 1.2. Market Segmentation
- 1.3. Research Objective
- 1.4. Definitions and Assumptions
- 2. Executive Summary
- 2.1. Market Snapshot
- 3. Market Dynamics
- 3.1. Market Drivers
- 3.2. Market Restrains
- 3.3. Market Trends
- 3.4. Market Opportunities
- 4. Market Factor Analysis
- 4.1. Porters Five Forces
- 4.1.1. Bargaining Power of Suppliers
- 4.1.2. Bargaining Power of Buyers
- 4.1.3. Threat of New Entrants
- 4.1.4. Threat of Substitutes
- 4.1.5. Competitive Rivalry
- 4.2. PESTEL analysis
- 4.3. BCG Analysis
- 4.3.1. Stars (High Growth, High Market Share)
- 4.3.2. Cash Cows (Low Growth, High Market Share)
- 4.3.3. Question Mark (High Growth, Low Market Share)
- 4.3.4. Dogs (Low Growth, Low Market Share)
- 4.4. Ansoff Matrix Analysis
- 4.5. Supply Chain Analysis
- 4.6. Regulatory Landscape
- 4.7. Current Market Potential and Opportunity Assessment (TAM–SAM–SOM Framework)
- 4.8. RAX Analyst Note
- 4.1. Porters Five Forces
- 5. Market Analysis, Insights and Forecast 2021-2033
- 5.1. Market Analysis, Insights and Forecast - by Material Type
- 5.1.1. Carbon Steel
- 5.1.2. Stainless Steel
- 5.1.3. Aluminum Alloy
- 5.2. Market Analysis, Insights and Forecast - by Capacity
- 5.2.1. Below 20000 Liters
- 5.2.2. 30000 - 40000 Liters
- 5.2.3. Above 40000 Liters
- 5.3. Market Analysis, Insights and Forecast - by Fuel Type
- 5.3.1. Petrol
- 5.3.2. LNG
- 5.3.3. Other Fuels
- 5.4. Market Analysis, Insights and Forecast - by Operator
- 5.4.1. Retail Petrol Companies
- 5.4.2. Refineries
- 5.5. Market Analysis, Insights and Forecast - by Region
- 5.5.1. North America
- 5.5.2. Europe
- 5.5.3. Asia Pacific
- 5.5.4. Middle East and Africa
- 5.5.5. South America
- 5.1. Market Analysis, Insights and Forecast - by Material Type
- 6. Global Fuel Tanker Services Market Analysis, Insights and Forecast, 2021-2033
- 6.1. Market Analysis, Insights and Forecast - by Material Type
- 6.1.1. Carbon Steel
- 6.1.2. Stainless Steel
- 6.1.3. Aluminum Alloy
- 6.2. Market Analysis, Insights and Forecast - by Capacity
- 6.2.1. Below 20000 Liters
- 6.2.2. 30000 - 40000 Liters
- 6.2.3. Above 40000 Liters
- 6.3. Market Analysis, Insights and Forecast - by Fuel Type
- 6.3.1. Petrol
- 6.3.2. LNG
- 6.3.3. Other Fuels
- 6.4. Market Analysis, Insights and Forecast - by Operator
- 6.4.1. Retail Petrol Companies
- 6.4.2. Refineries
- 6.1. Market Analysis, Insights and Forecast - by Material Type
- 7. North America Fuel Tanker Services Market Analysis, Insights and Forecast, 2020-2032
- 7.1. Market Analysis, Insights and Forecast - by Material Type
- 7.1.1. Carbon Steel
- 7.1.2. Stainless Steel
- 7.1.3. Aluminum Alloy
- 7.2. Market Analysis, Insights and Forecast - by Capacity
- 7.2.1. Below 20000 Liters
- 7.2.2. 30000 - 40000 Liters
- 7.2.3. Above 40000 Liters
- 7.3. Market Analysis, Insights and Forecast - by Fuel Type
- 7.3.1. Petrol
- 7.3.2. LNG
- 7.3.3. Other Fuels
- 7.4. Market Analysis, Insights and Forecast - by Operator
- 7.4.1. Retail Petrol Companies
- 7.4.2. Refineries
- 7.1. Market Analysis, Insights and Forecast - by Material Type
- 8. Europe Fuel Tanker Services Market Analysis, Insights and Forecast, 2020-2032
- 8.1. Market Analysis, Insights and Forecast - by Material Type
- 8.1.1. Carbon Steel
- 8.1.2. Stainless Steel
- 8.1.3. Aluminum Alloy
- 8.2. Market Analysis, Insights and Forecast - by Capacity
- 8.2.1. Below 20000 Liters
- 8.2.2. 30000 - 40000 Liters
- 8.2.3. Above 40000 Liters
- 8.3. Market Analysis, Insights and Forecast - by Fuel Type
- 8.3.1. Petrol
- 8.3.2. LNG
- 8.3.3. Other Fuels
- 8.4. Market Analysis, Insights and Forecast - by Operator
- 8.4.1. Retail Petrol Companies
- 8.4.2. Refineries
- 8.1. Market Analysis, Insights and Forecast - by Material Type
- 9. Asia Pacific Fuel Tanker Services Market Analysis, Insights and Forecast, 2020-2032
- 9.1. Market Analysis, Insights and Forecast - by Material Type
- 9.1.1. Carbon Steel
- 9.1.2. Stainless Steel
- 9.1.3. Aluminum Alloy
- 9.2. Market Analysis, Insights and Forecast - by Capacity
- 9.2.1. Below 20000 Liters
- 9.2.2. 30000 - 40000 Liters
- 9.2.3. Above 40000 Liters
- 9.3. Market Analysis, Insights and Forecast - by Fuel Type
- 9.3.1. Petrol
- 9.3.2. LNG
- 9.3.3. Other Fuels
- 9.4. Market Analysis, Insights and Forecast - by Operator
- 9.4.1. Retail Petrol Companies
- 9.4.2. Refineries
- 9.1. Market Analysis, Insights and Forecast - by Material Type
- 10. Middle East and Africa Fuel Tanker Services Market Analysis, Insights and Forecast, 2020-2032
- 10.1. Market Analysis, Insights and Forecast - by Material Type
- 10.1.1. Carbon Steel
- 10.1.2. Stainless Steel
- 10.1.3. Aluminum Alloy
- 10.2. Market Analysis, Insights and Forecast - by Capacity
- 10.2.1. Below 20000 Liters
- 10.2.2. 30000 - 40000 Liters
- 10.2.3. Above 40000 Liters
- 10.3. Market Analysis, Insights and Forecast - by Fuel Type
- 10.3.1. Petrol
- 10.3.2. LNG
- 10.3.3. Other Fuels
- 10.4. Market Analysis, Insights and Forecast - by Operator
- 10.4.1. Retail Petrol Companies
- 10.4.2. Refineries
- 10.1. Market Analysis, Insights and Forecast - by Material Type
- 11. South America Fuel Tanker Services Market Analysis, Insights and Forecast, 2020-2032
- 11.1. Market Analysis, Insights and Forecast - by Material Type
- 11.1.1. Carbon Steel
- 11.1.2. Stainless Steel
- 11.1.3. Aluminum Alloy
- 11.2. Market Analysis, Insights and Forecast - by Capacity
- 11.2.1. Below 20000 Liters
- 11.2.2. 30000 - 40000 Liters
- 11.2.3. Above 40000 Liters
- 11.3. Market Analysis, Insights and Forecast - by Fuel Type
- 11.3.1. Petrol
- 11.3.2. LNG
- 11.3.3. Other Fuels
- 11.4. Market Analysis, Insights and Forecast - by Operator
- 11.4.1. Retail Petrol Companies
- 11.4.2. Refineries
- 11.1. Market Analysis, Insights and Forecast - by Material Type
- 12. Competitive Analysis
- 12.1. Company Profiles
- 12.1.1 Compass Fuel Oils Ltd
- 12.1.1.1. Company Overview
- 12.1.1.2. Products
- 12.1.1.3. Company Financials
- 12.1.1.4. SWOT Analysis
- 12.1.2 Rigual SA
- 12.1.2.1. Company Overview
- 12.1.2.2. Products
- 12.1.2.3. Company Financials
- 12.1.2.4. SWOT Analysis
- 12.1.3 Crown Oil Ltd
- 12.1.3.1. Company Overview
- 12.1.3.2. Products
- 12.1.3.3. Company Financials
- 12.1.3.4. SWOT Analysis
- 12.1.4 Shell International Trading and Shipping Company Limited*List Not Exhaustive
- 12.1.4.1. Company Overview
- 12.1.4.2. Products
- 12.1.4.3. Company Financials
- 12.1.4.4. SWOT Analysis
- 12.1.5 Certas Energy UK Limited
- 12.1.5.1. Company Overview
- 12.1.5.2. Products
- 12.1.5.3. Company Financials
- 12.1.5.4. SWOT Analysis
- 12.1.1 Compass Fuel Oils Ltd
- 12.2. Market Entropy
- 12.2.1 Company's Key Areas Served
- 12.2.2 Recent Developments
- 12.3. Company Market Share Analysis 2025
- 12.3.1 Top 5 Companies Market Share Analysis
- 12.3.2 Top 3 Companies Market Share Analysis
- 12.4. List of Potential Customers
- 13. Research Methodology
List of Figures
- Figure 1: Global Fuel Tanker Services Market Revenue Breakdown (Million, %) by Region 2025 & 2033
- Figure 2: North America Fuel Tanker Services Market Revenue (Million), by Material Type 2025 & 2033
- Figure 3: North America Fuel Tanker Services Market Revenue Share (%), by Material Type 2025 & 2033
- Figure 4: North America Fuel Tanker Services Market Revenue (Million), by Capacity 2025 & 2033
- Figure 5: North America Fuel Tanker Services Market Revenue Share (%), by Capacity 2025 & 2033
- Figure 6: North America Fuel Tanker Services Market Revenue (Million), by Fuel Type 2025 & 2033
- Figure 7: North America Fuel Tanker Services Market Revenue Share (%), by Fuel Type 2025 & 2033
- Figure 8: North America Fuel Tanker Services Market Revenue (Million), by Operator 2025 & 2033
- Figure 9: North America Fuel Tanker Services Market Revenue Share (%), by Operator 2025 & 2033
- Figure 10: North America Fuel Tanker Services Market Revenue (Million), by Country 2025 & 2033
- Figure 11: North America Fuel Tanker Services Market Revenue Share (%), by Country 2025 & 2033
- Figure 12: Europe Fuel Tanker Services Market Revenue (Million), by Material Type 2025 & 2033
- Figure 13: Europe Fuel Tanker Services Market Revenue Share (%), by Material Type 2025 & 2033
- Figure 14: Europe Fuel Tanker Services Market Revenue (Million), by Capacity 2025 & 2033
- Figure 15: Europe Fuel Tanker Services Market Revenue Share (%), by Capacity 2025 & 2033
- Figure 16: Europe Fuel Tanker Services Market Revenue (Million), by Fuel Type 2025 & 2033
- Figure 17: Europe Fuel Tanker Services Market Revenue Share (%), by Fuel Type 2025 & 2033
- Figure 18: Europe Fuel Tanker Services Market Revenue (Million), by Operator 2025 & 2033
- Figure 19: Europe Fuel Tanker Services Market Revenue Share (%), by Operator 2025 & 2033
- Figure 20: Europe Fuel Tanker Services Market Revenue (Million), by Country 2025 & 2033
- Figure 21: Europe Fuel Tanker Services Market Revenue Share (%), by Country 2025 & 2033
- Figure 22: Asia Pacific Fuel Tanker Services Market Revenue (Million), by Material Type 2025 & 2033
- Figure 23: Asia Pacific Fuel Tanker Services Market Revenue Share (%), by Material Type 2025 & 2033
- Figure 24: Asia Pacific Fuel Tanker Services Market Revenue (Million), by Capacity 2025 & 2033
- Figure 25: Asia Pacific Fuel Tanker Services Market Revenue Share (%), by Capacity 2025 & 2033
- Figure 26: Asia Pacific Fuel Tanker Services Market Revenue (Million), by Fuel Type 2025 & 2033
- Figure 27: Asia Pacific Fuel Tanker Services Market Revenue Share (%), by Fuel Type 2025 & 2033
- Figure 28: Asia Pacific Fuel Tanker Services Market Revenue (Million), by Operator 2025 & 2033
- Figure 29: Asia Pacific Fuel Tanker Services Market Revenue Share (%), by Operator 2025 & 2033
- Figure 30: Asia Pacific Fuel Tanker Services Market Revenue (Million), by Country 2025 & 2033
- Figure 31: Asia Pacific Fuel Tanker Services Market Revenue Share (%), by Country 2025 & 2033
- Figure 32: Middle East and Africa Fuel Tanker Services Market Revenue (Million), by Material Type 2025 & 2033
- Figure 33: Middle East and Africa Fuel Tanker Services Market Revenue Share (%), by Material Type 2025 & 2033
- Figure 34: Middle East and Africa Fuel Tanker Services Market Revenue (Million), by Capacity 2025 & 2033
- Figure 35: Middle East and Africa Fuel Tanker Services Market Revenue Share (%), by Capacity 2025 & 2033
- Figure 36: Middle East and Africa Fuel Tanker Services Market Revenue (Million), by Fuel Type 2025 & 2033
- Figure 37: Middle East and Africa Fuel Tanker Services Market Revenue Share (%), by Fuel Type 2025 & 2033
- Figure 38: Middle East and Africa Fuel Tanker Services Market Revenue (Million), by Operator 2025 & 2033
- Figure 39: Middle East and Africa Fuel Tanker Services Market Revenue Share (%), by Operator 2025 & 2033
- Figure 40: Middle East and Africa Fuel Tanker Services Market Revenue (Million), by Country 2025 & 2033
- Figure 41: Middle East and Africa Fuel Tanker Services Market Revenue Share (%), by Country 2025 & 2033
- Figure 42: South America Fuel Tanker Services Market Revenue (Million), by Material Type 2025 & 2033
- Figure 43: South America Fuel Tanker Services Market Revenue Share (%), by Material Type 2025 & 2033
- Figure 44: South America Fuel Tanker Services Market Revenue (Million), by Capacity 2025 & 2033
- Figure 45: South America Fuel Tanker Services Market Revenue Share (%), by Capacity 2025 & 2033
- Figure 46: South America Fuel Tanker Services Market Revenue (Million), by Fuel Type 2025 & 2033
- Figure 47: South America Fuel Tanker Services Market Revenue Share (%), by Fuel Type 2025 & 2033
- Figure 48: South America Fuel Tanker Services Market Revenue (Million), by Operator 2025 & 2033
- Figure 49: South America Fuel Tanker Services Market Revenue Share (%), by Operator 2025 & 2033
- Figure 50: South America Fuel Tanker Services Market Revenue (Million), by Country 2025 & 2033
- Figure 51: South America Fuel Tanker Services Market Revenue Share (%), by Country 2025 & 2033
List of Tables
- Table 1: Global Fuel Tanker Services Market Revenue Million Forecast, by Material Type 2020 & 2033
- Table 2: Global Fuel Tanker Services Market Revenue Million Forecast, by Capacity 2020 & 2033
- Table 3: Global Fuel Tanker Services Market Revenue Million Forecast, by Fuel Type 2020 & 2033
- Table 4: Global Fuel Tanker Services Market Revenue Million Forecast, by Operator 2020 & 2033
- Table 5: Global Fuel Tanker Services Market Revenue Million Forecast, by Region 2020 & 2033
- Table 6: Global Fuel Tanker Services Market Revenue Million Forecast, by Material Type 2020 & 2033
- Table 7: Global Fuel Tanker Services Market Revenue Million Forecast, by Capacity 2020 & 2033
- Table 8: Global Fuel Tanker Services Market Revenue Million Forecast, by Fuel Type 2020 & 2033
- Table 9: Global Fuel Tanker Services Market Revenue Million Forecast, by Operator 2020 & 2033
- Table 10: Global Fuel Tanker Services Market Revenue Million Forecast, by Country 2020 & 2033
- Table 11: United States Fuel Tanker Services Market Revenue (Million) Forecast, by Application 2020 & 2033
- Table 12: Canada Fuel Tanker Services Market Revenue (Million) Forecast, by Application 2020 & 2033
- Table 13: Rest of North America Fuel Tanker Services Market Revenue (Million) Forecast, by Application 2020 & 2033
- Table 14: Global Fuel Tanker Services Market Revenue Million Forecast, by Material Type 2020 & 2033
- Table 15: Global Fuel Tanker Services Market Revenue Million Forecast, by Capacity 2020 & 2033
- Table 16: Global Fuel Tanker Services Market Revenue Million Forecast, by Fuel Type 2020 & 2033
- Table 17: Global Fuel Tanker Services Market Revenue Million Forecast, by Operator 2020 & 2033
- Table 18: Global Fuel Tanker Services Market Revenue Million Forecast, by Country 2020 & 2033
- Table 19: Germany Fuel Tanker Services Market Revenue (Million) Forecast, by Application 2020 & 2033
- Table 20: France Fuel Tanker Services Market Revenue (Million) Forecast, by Application 2020 & 2033
- Table 21: United Kingdom Fuel Tanker Services Market Revenue (Million) Forecast, by Application 2020 & 2033
- Table 22: Italy Fuel Tanker Services Market Revenue (Million) Forecast, by Application 2020 & 2033
- Table 23: Spain Fuel Tanker Services Market Revenue (Million) Forecast, by Application 2020 & 2033
- Table 24: NORDIC Fuel Tanker Services Market Revenue (Million) Forecast, by Application 2020 & 2033
- Table 25: Russia Fuel Tanker Services Market Revenue (Million) Forecast, by Application 2020 & 2033
- Table 26: Rest of Europe Fuel Tanker Services Market Revenue (Million) Forecast, by Application 2020 & 2033
- Table 27: Global Fuel Tanker Services Market Revenue Million Forecast, by Material Type 2020 & 2033
- Table 28: Global Fuel Tanker Services Market Revenue Million Forecast, by Capacity 2020 & 2033
- Table 29: Global Fuel Tanker Services Market Revenue Million Forecast, by Fuel Type 2020 & 2033
- Table 30: Global Fuel Tanker Services Market Revenue Million Forecast, by Operator 2020 & 2033
- Table 31: Global Fuel Tanker Services Market Revenue Million Forecast, by Country 2020 & 2033
- Table 32: China Fuel Tanker Services Market Revenue (Million) Forecast, by Application 2020 & 2033
- Table 33: India Fuel Tanker Services Market Revenue (Million) Forecast, by Application 2020 & 2033
- Table 34: Australia Fuel Tanker Services Market Revenue (Million) Forecast, by Application 2020 & 2033
- Table 35: Malaysia Fuel Tanker Services Market Revenue (Million) Forecast, by Application 2020 & 2033
- Table 36: Indonesia Fuel Tanker Services Market Revenue (Million) Forecast, by Application 2020 & 2033
- Table 37: Thailand Fuel Tanker Services Market Revenue (Million) Forecast, by Application 2020 & 2033
- Table 38: Vietnam Fuel Tanker Services Market Revenue (Million) Forecast, by Application 2020 & 2033
- Table 39: Rest of Asia Pacific Fuel Tanker Services Market Revenue (Million) Forecast, by Application 2020 & 2033
- Table 40: Global Fuel Tanker Services Market Revenue Million Forecast, by Material Type 2020 & 2033
- Table 41: Global Fuel Tanker Services Market Revenue Million Forecast, by Capacity 2020 & 2033
- Table 42: Global Fuel Tanker Services Market Revenue Million Forecast, by Fuel Type 2020 & 2033
- Table 43: Global Fuel Tanker Services Market Revenue Million Forecast, by Operator 2020 & 2033
- Table 44: Global Fuel Tanker Services Market Revenue Million Forecast, by Country 2020 & 2033
- Table 45: Saudi Arabia Fuel Tanker Services Market Revenue (Million) Forecast, by Application 2020 & 2033
- Table 46: United Arab Emirates Fuel Tanker Services Market Revenue (Million) Forecast, by Application 2020 & 2033
- Table 47: South Africa Fuel Tanker Services Market Revenue (Million) Forecast, by Application 2020 & 2033
- Table 48: Nigeria Fuel Tanker Services Market Revenue (Million) Forecast, by Application 2020 & 2033
- Table 49: Rest of Middle East and Africa Fuel Tanker Services Market Revenue (Million) Forecast, by Application 2020 & 2033
- Table 50: Egypt Fuel Tanker Services Market Revenue (Million) Forecast, by Application 2020 & 2033
- Table 51: Global Fuel Tanker Services Market Revenue Million Forecast, by Material Type 2020 & 2033
- Table 52: Global Fuel Tanker Services Market Revenue Million Forecast, by Capacity 2020 & 2033
- Table 53: Global Fuel Tanker Services Market Revenue Million Forecast, by Fuel Type 2020 & 2033
- Table 54: Global Fuel Tanker Services Market Revenue Million Forecast, by Operator 2020 & 2033
- Table 55: Global Fuel Tanker Services Market Revenue Million Forecast, by Country 2020 & 2033
- Table 56: Brazil Fuel Tanker Services Market Revenue (Million) Forecast, by Application 2020 & 2033
- Table 57: Argentina Fuel Tanker Services Market Revenue (Million) Forecast, by Application 2020 & 2033
- Table 58: Colombia Fuel Tanker Services Market Revenue (Million) Forecast, by Application 2020 & 2033
- Table 59: Rest of South America Fuel Tanker Services Market Revenue (Million) Forecast, by Application 2020 & 2033
Frequently Asked Questions
1. What is the projected Compound Annual Growth Rate (CAGR) of the Fuel Tanker Services Market?
The projected CAGR is approximately 4.50%.
2. Which companies are prominent players in the Fuel Tanker Services Market?
Key companies in the market include Compass Fuel Oils Ltd, Rigual SA, Crown Oil Ltd, Shell International Trading and Shipping Company Limited*List Not Exhaustive, Certas Energy UK Limited.
3. What are the main segments of the Fuel Tanker Services Market?
The market segments include Material Type, Capacity, Fuel Type, Operator.
4. Can you provide details about the market size?
The market size is estimated to be USD 5.60 Million as of 2022.
5. What are some drivers contributing to market growth?
4.; Increasing Demand for Sales of Commercial Vehicles4.; Increasing Deployment of Retail Fuel Outlets Across Various Countries.
6. What are the notable trends driving market growth?
The LNG Segment is Expected to Dominate the Market.
7. Are there any restraints impacting market growth?
4.; Growing Penetration and Demand for Electric Vehicles.
8. Can you provide examples of recent developments in the market?
January 2024: Compass Fuel Oils Ltd announced the acquisition of a new Arctic fuel tanker, marking a significant addition to their expanding fleet at their headquarters in Preston, United Kingdom. This latest addition underscores the company’s commitment to enhancing its capacity.
9. What pricing options are available for accessing the report?
Pricing options include single-user, multi-user, and enterprise licenses priced at USD 4750, USD 5250, and USD 8750 respectively.
10. Is the market size provided in terms of value or volume?
The market size is provided in terms of value, measured in Million.
11. Are there any specific market keywords associated with the report?
Yes, the market keyword associated with the report is "Fuel Tanker Services Market," which aids in identifying and referencing the specific market segment covered.
12. How do I determine which pricing option suits my needs best?
The pricing options vary based on user requirements and access needs. Individual users may opt for single-user licenses, while businesses requiring broader access may choose multi-user or enterprise licenses for cost-effective access to the report.
13. Are there any additional resources or data provided in the Fuel Tanker Services Market report?
While the report offers comprehensive insights, it's advisable to review the specific contents or supplementary materials provided to ascertain if additional resources or data are available.
14. How can I stay updated on further developments or reports in the Fuel Tanker Services Market?
To stay informed about further developments, trends, and reports in the Fuel Tanker Services Market, consider subscribing to industry newsletters, following relevant companies and organizations, or regularly checking reputable industry news sources and publications.
Methodology
Step 1 - Identification of Relevant Samples Size from Population Database


Step 2 - Approaches for Defining Global Market Size (Value, Volume* & Price*)

Note*: In applicable scenarios
Step 3 - Data Sources
Primary Research
- Web Analytics
- Survey Reports
- Research Institute
- Latest Research Reports
- Opinion Leaders
Secondary Research
- Annual Reports
- White Paper
- Latest Press Release
- Industry Association
- Paid Database
- Investor Presentations

Step 4 - Data Triangulation
Involves using different sources of information in order to increase the validity of a study
These sources are likely to be stakeholders in a program - participants, other researchers, program staff, other community members, and so on.
Then we put all data in single framework & apply various statistical tools to find out the dynamic on the market.
During the analysis stage, feedback from the stakeholder groups would be compared to determine areas of agreement as well as areas of divergence