

Key Insights
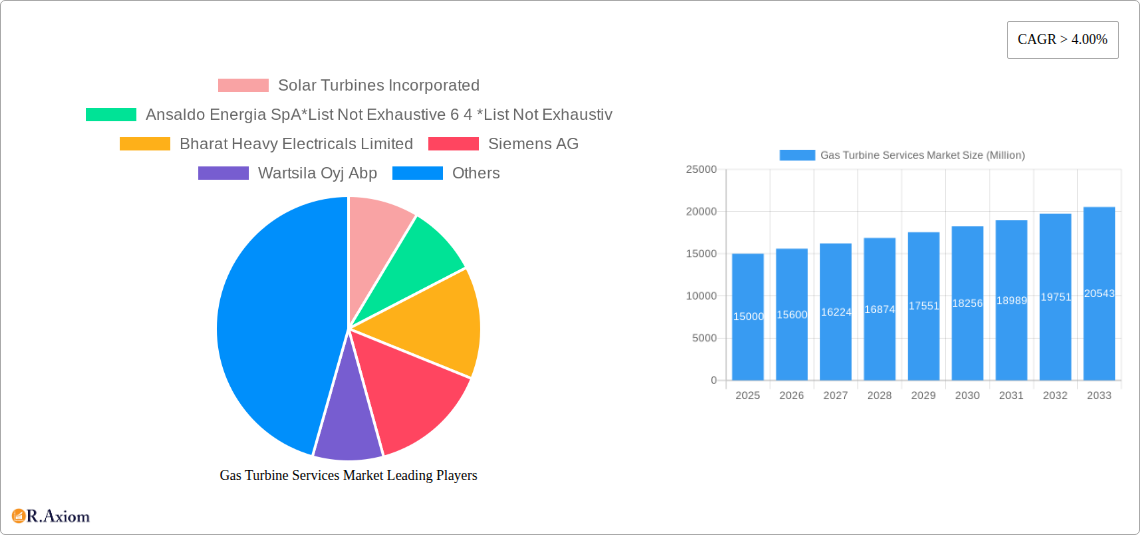
The Gas Turbine Services market is projected for significant expansion, with an estimated Compound Annual Growth Rate (CAGR) of 2.1% from 2025 to 2033. This growth is propelled by escalating global electricity demand, particularly in emerging economies, necessitating reliable power generation solutions and driving demand for gas turbine maintenance and upgrades. The aging installed base of gas turbines also requires substantial investment in repair, overhaul, and parts replacement services. Furthermore, advancements in gas turbine technology are fostering new service opportunities, including predictive maintenance and digital solutions, enhancing operational efficiency and minimizing downtime. Key market segments are defined by capacity (under 30 MW, 31-120 MW, over 120 MW), type (combined cycle, open cycle), and end-user industry (power, oil and gas). Leading companies such as Solar Turbines Incorporated, Siemens AG, and General Electric Company are actively shaping this competitive landscape through continuous innovation and service portfolio expansion.
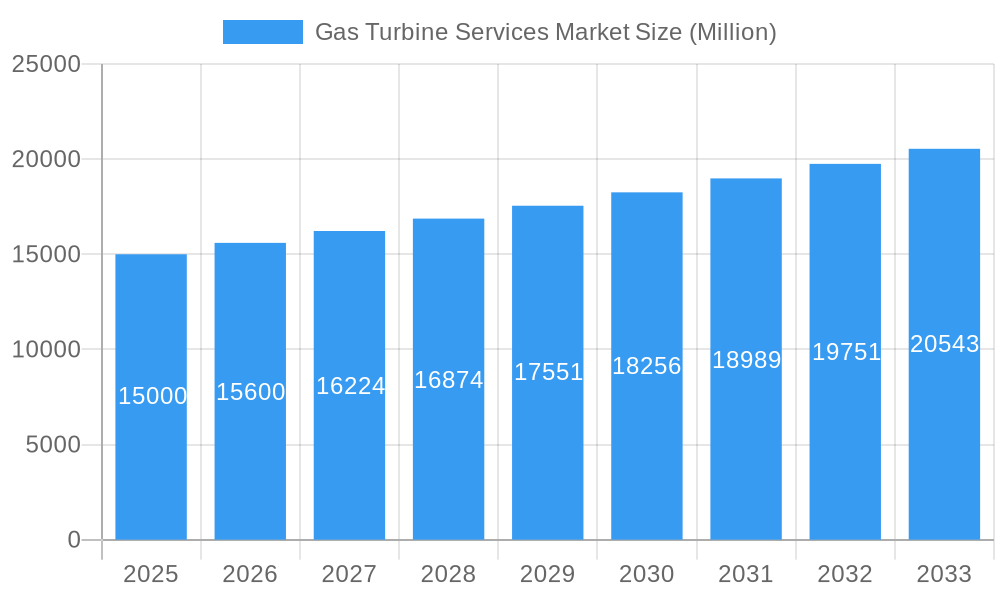
Gas Turbine Services Market Market Size (In Billion)
Geographically, North America and Europe currently lead in market share due to their mature power generation infrastructure and extensive gas turbine installations. However, the Asia-Pacific region is expected to exhibit the most rapid growth, fueled by robust industrialization and infrastructure development in China, India, and Southeast Asia. This expansion will require considerable investment in gas turbine services to ensure operational reliability. Despite environmental regulatory pressures, the market's positive growth trajectory is sustained by consistent electricity demand and the imperative to optimize performance and extend the lifespan of existing gas turbine assets. The increasing integration of digital technologies presents further service opportunities.
Gas Turbine Services Market Company Market Share
This comprehensive report analyzes the global Gas Turbine Services Market, offering critical insights for industry stakeholders and investors. The study spans from 2019 to 2033, with 2025 designated as the base year. Utilizing extensive primary and secondary research, the report delivers actionable intelligence on market size, segmentation, growth drivers, challenges, and emerging opportunities. The projected market size for 2025 is estimated at 11.46 billion.
Gas Turbine Services Market Concentration & Innovation
The Gas Turbine Services market exhibits a moderately concentrated landscape, with key players such as General Electric Company, Siemens AG, Wartsila Oyj Abp, Mitsubishi Heavy Industries Ltd, IHI Corporation, Kawasaki Heavy Industries Ltd, Bharat Heavy Electricals Limited, Solar Turbines Incorporated, and Ansaldo Energia SpA holding significant market share. Market share data for 2025 reveals that the top 5 players collectively account for approximately XX% of the global market. Consolidation through mergers and acquisitions (M&A) is a recurring trend, with notable deals valued at $XX Million in the past five years, primarily driven by expansion into new markets and technological advancements.
- Market Concentration: The Herfindahl-Hirschman Index (HHI) is estimated at XX, indicating a moderately concentrated market.
- Innovation Drivers: Stringent emission regulations, the demand for higher efficiency, and the increasing adoption of digital technologies are major innovation drivers.
- Regulatory Frameworks: Government regulations on greenhouse gas emissions are significantly influencing the adoption of cleaner and more efficient gas turbine technologies.
- Product Substitutes: While renewable energy sources pose a long-term threat, gas turbines continue to maintain a competitive edge in terms of reliability and dispatch-ability.
- End-User Trends: The growing demand for power generation and oil & gas exploration in developing economies is fueling market growth.
- M&A Activities: Strategic acquisitions by major players are enhancing their service portfolios and geographical reach.
Gas Turbine Services Market Industry Trends & Insights
The global Gas Turbine Services market is experiencing robust growth, projected to achieve a Compound Annual Growth Rate (CAGR) of XX% during the forecast period (2025-2033). This growth is fueled by several factors, including the rising global energy demand, particularly in developing economies. The increasing adoption of combined cycle power plants which improve energy efficiency further contributes to this growth. Technological advancements such as the integration of digital technologies for predictive maintenance and optimized operations are transforming the industry. Consumer preference is shifting towards sustainable and cost-effective solutions which further shapes the market trends. Competitive dynamics are marked by intense competition among major players, who are continuously striving to enhance their service offerings and technological capabilities. Market penetration of advanced services like remote diagnostics and performance optimization is growing steadily, exceeding XX% in mature markets.
Dominant Markets & Segments in Gas Turbine Services Market
The Power segment dominates the end-user industry, accounting for approximately XX% of the total market revenue in 2025. Geographically, North America and Europe hold significant market shares, driven by robust power generation infrastructure and stringent emission norms. The “Above 120 MW” capacity segment displays the highest growth, driven by large-scale power generation projects and industrial applications.
- By Capacity:
- Above 120 MW: High demand in large-scale power plants.
- 31-120 MW: Significant growth in mid-size industrial and power generation facilities.
- Less than 30 MW: Steady growth driven by distributed generation and small-scale power projects.
- By Type:
- Combined Cycle: Highest market share due to high efficiency.
- Open Cycle: Significant market share in specific applications where efficiency is less critical.
- By End-User Industry:
- Power: Dominant segment driven by electricity generation needs.
- Oil and Gas: Significant demand for gas turbine services in oil and gas extraction and processing.
- Other End-user Industries: Includes marine, industrial and other specialized applications.
Key Drivers for Dominance:
- North America: Strong regulatory framework, robust power generation infrastructure, and significant investments in energy sector.
- Europe: Stringent environmental regulations, focus on renewable energy integration, and advanced technology adoption.
- Above 120 MW Segment: Large-scale power projects, robust economies of scale, and technological advancements.
- Combined Cycle Type: Superior efficiency, lower operating costs, and compliance with emission regulations.
Gas Turbine Services Market Product Developments
Recent innovations focus on enhancing efficiency, reducing emissions, and improving operational reliability through digitalization. Advanced diagnostic tools, predictive maintenance software, and remote monitoring capabilities are gaining traction. These advancements improve operational efficiency, minimize downtime, and extend the lifespan of gas turbines, offering significant competitive advantages. The market is witnessing the integration of AI and machine learning for improved predictive maintenance and performance optimization.
Report Scope & Segmentation Analysis
The report provides a detailed segmentation analysis of the Gas Turbine Services market based on capacity (Less than 30 MW, 31-120 MW, Above 120 MW), type (Combined Cycle, Open Cycle), and end-user industry (Power, Oil and Gas, Other End-user Industries). Each segment’s market size, growth projections, and competitive dynamics are thoroughly examined. The report projects a XX% CAGR for the Combined Cycle segment, while the Power end-user segment is anticipated to grow at a XX% CAGR. The “Above 120 MW” segment exhibits the fastest growth rate due to large-scale projects.
Key Drivers of Gas Turbine Services Market Growth
The Gas Turbine Services market is driven by several factors. The growing global energy demand, particularly in developing economies, is a key driver. Stringent environmental regulations and a focus on reducing greenhouse gas emissions are pushing the adoption of more efficient and environmentally friendly gas turbines. Technological advancements, such as digitalization and predictive maintenance, are also significantly impacting market growth.
Challenges in the Gas Turbine Services Market Sector
The Gas Turbine Services market faces challenges such as fluctuating fuel prices, intense competition, and economic downturns which impact project financing. The availability of skilled labor and maintenance expertise and supply chain disruptions can also affect market performance. Regulatory changes and environmental concerns create uncertainties impacting investment decisions.
Emerging Opportunities in Gas Turbine Services Market
The integration of renewable energy sources with gas turbines (hybrid systems), the development of advanced materials for enhanced efficiency and durability, and the growing demand for gas turbine services in emerging economies present significant opportunities. The expansion of gas turbine services into new sectors like data centers and industrial processes will also shape the future.
Leading Players in the Gas Turbine Services Market Market
- General Electric Company
- Siemens AG
- Wartsila Oyj Abp
- Mitsubishi Heavy Industries Ltd
- IHI Corporation
- Kawasaki Heavy Industries Ltd
- Bharat Heavy Electricals Limited
- Solar Turbines Incorporated
- Ansaldo Energia SpA
Key Developments in Gas Turbine Services Market Industry
- June 2023: Siemens AG launched a new digital service platform for gas turbine diagnostics.
- December 2022: General Electric Company announced a strategic partnership to expand its gas turbine service network in Asia.
- March 2022: Wartsila Oyj Abp acquired a smaller service provider specializing in gas turbine maintenance. (Further specific details of the M&A activities were not provided in the prompt)
Strategic Outlook for Gas Turbine Services Market Market
The Gas Turbine Services market is poised for sustained growth, driven by ongoing technological advancements, increasing energy demands, and the continued importance of gas turbines as a reliable and flexible power generation source. The focus on enhancing efficiency, reducing emissions, and leveraging digitalization will shape future market opportunities. The integration of renewables and the expansion into new application areas will further drive market expansion.
Gas Turbine Services Market Segmentation
-
1. Capacity
- 1.1. Less than 30 MW
- 1.2. 31-120 MW
- 1.3. Above 120 MW
-
2. Type
- 2.1. Combined Cycle
- 2.2. Open Cycle
-
3. End-User Industry
- 3.1. Power
- 3.2. Oil and Gas
- 3.3. Other End-user Industries
Gas Turbine Services Market Segmentation By Geography
- 1. Asia Pacific
- 2. North America
- 3. Europe
- 4. South America
- 5. Middle East and Africa
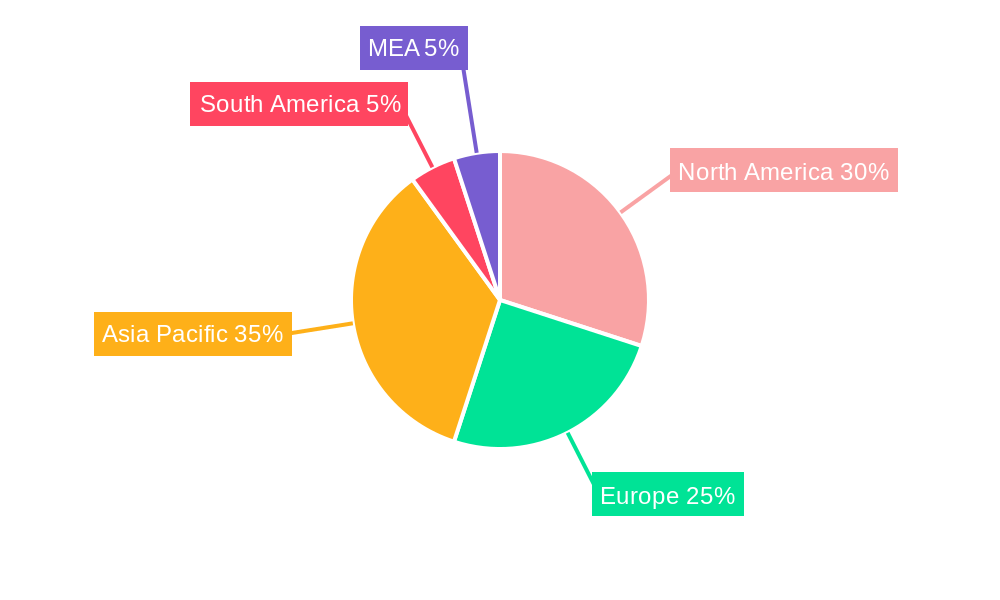
Gas Turbine Services Market Regional Market Share
Geographic Coverage of Gas Turbine Services Market
Gas Turbine Services Market REPORT HIGHLIGHTS
| Aspects | Details |
|---|---|
| Study Period | 2020-2034 |
| Base Year | 2025 |
| Estimated Year | 2026 |
| Forecast Period | 2026-2034 |
| Historical Period | 2020-2025 |
| Growth Rate | CAGR of 2.1% from 2020-2034 |
| Segmentation |
|
Table of Contents
- 1. Introduction
- 1.1. Research Scope
- 1.2. Market Segmentation
- 1.3. Research Objective
- 1.4. Definitions and Assumptions
- 2. Executive Summary
- 2.1. Market Snapshot
- 3. Market Dynamics
- 3.1. Market Drivers
- 3.2. Market Restrains
- 3.3. Market Trends
- 3.4. Market Opportunities
- 4. Market Factor Analysis
- 4.1. Porters Five Forces
- 4.1.1. Bargaining Power of Suppliers
- 4.1.2. Bargaining Power of Buyers
- 4.1.3. Threat of New Entrants
- 4.1.4. Threat of Substitutes
- 4.1.5. Competitive Rivalry
- 4.2. PESTEL analysis
- 4.3. BCG Analysis
- 4.3.1. Stars (High Growth, High Market Share)
- 4.3.2. Cash Cows (Low Growth, High Market Share)
- 4.3.3. Question Mark (High Growth, Low Market Share)
- 4.3.4. Dogs (Low Growth, Low Market Share)
- 4.4. Ansoff Matrix Analysis
- 4.5. Supply Chain Analysis
- 4.6. Regulatory Landscape
- 4.7. Current Market Potential and Opportunity Assessment (TAM–SAM–SOM Framework)
- 4.8. RAX Analyst Note
- 4.1. Porters Five Forces
- 5. Market Analysis, Insights and Forecast 2021-2033
- 5.1. Market Analysis, Insights and Forecast - by Capacity
- 5.1.1. Less than 30 MW
- 5.1.2. 31-120 MW
- 5.1.3. Above 120 MW
- 5.2. Market Analysis, Insights and Forecast - by Type
- 5.2.1. Combined Cycle
- 5.2.2. Open Cycle
- 5.3. Market Analysis, Insights and Forecast - by End-User Industry
- 5.3.1. Power
- 5.3.2. Oil and Gas
- 5.3.3. Other End-user Industries
- 5.4. Market Analysis, Insights and Forecast - by Region
- 5.4.1. Asia Pacific
- 5.4.2. North America
- 5.4.3. Europe
- 5.4.4. South America
- 5.4.5. Middle East and Africa
- 5.1. Market Analysis, Insights and Forecast - by Capacity
- 6. Global Gas Turbine Services Market Analysis, Insights and Forecast, 2021-2033
- 6.1. Market Analysis, Insights and Forecast - by Capacity
- 6.1.1. Less than 30 MW
- 6.1.2. 31-120 MW
- 6.1.3. Above 120 MW
- 6.2. Market Analysis, Insights and Forecast - by Type
- 6.2.1. Combined Cycle
- 6.2.2. Open Cycle
- 6.3. Market Analysis, Insights and Forecast - by End-User Industry
- 6.3.1. Power
- 6.3.2. Oil and Gas
- 6.3.3. Other End-user Industries
- 6.1. Market Analysis, Insights and Forecast - by Capacity
- 7. Asia Pacific Gas Turbine Services Market Analysis, Insights and Forecast, 2020-2032
- 7.1. Market Analysis, Insights and Forecast - by Capacity
- 7.1.1. Less than 30 MW
- 7.1.2. 31-120 MW
- 7.1.3. Above 120 MW
- 7.2. Market Analysis, Insights and Forecast - by Type
- 7.2.1. Combined Cycle
- 7.2.2. Open Cycle
- 7.3. Market Analysis, Insights and Forecast - by End-User Industry
- 7.3.1. Power
- 7.3.2. Oil and Gas
- 7.3.3. Other End-user Industries
- 7.1. Market Analysis, Insights and Forecast - by Capacity
- 8. North America Gas Turbine Services Market Analysis, Insights and Forecast, 2020-2032
- 8.1. Market Analysis, Insights and Forecast - by Capacity
- 8.1.1. Less than 30 MW
- 8.1.2. 31-120 MW
- 8.1.3. Above 120 MW
- 8.2. Market Analysis, Insights and Forecast - by Type
- 8.2.1. Combined Cycle
- 8.2.2. Open Cycle
- 8.3. Market Analysis, Insights and Forecast - by End-User Industry
- 8.3.1. Power
- 8.3.2. Oil and Gas
- 8.3.3. Other End-user Industries
- 8.1. Market Analysis, Insights and Forecast - by Capacity
- 9. Europe Gas Turbine Services Market Analysis, Insights and Forecast, 2020-2032
- 9.1. Market Analysis, Insights and Forecast - by Capacity
- 9.1.1. Less than 30 MW
- 9.1.2. 31-120 MW
- 9.1.3. Above 120 MW
- 9.2. Market Analysis, Insights and Forecast - by Type
- 9.2.1. Combined Cycle
- 9.2.2. Open Cycle
- 9.3. Market Analysis, Insights and Forecast - by End-User Industry
- 9.3.1. Power
- 9.3.2. Oil and Gas
- 9.3.3. Other End-user Industries
- 9.1. Market Analysis, Insights and Forecast - by Capacity
- 10. South America Gas Turbine Services Market Analysis, Insights and Forecast, 2020-2032
- 10.1. Market Analysis, Insights and Forecast - by Capacity
- 10.1.1. Less than 30 MW
- 10.1.2. 31-120 MW
- 10.1.3. Above 120 MW
- 10.2. Market Analysis, Insights and Forecast - by Type
- 10.2.1. Combined Cycle
- 10.2.2. Open Cycle
- 10.3. Market Analysis, Insights and Forecast - by End-User Industry
- 10.3.1. Power
- 10.3.2. Oil and Gas
- 10.3.3. Other End-user Industries
- 10.1. Market Analysis, Insights and Forecast - by Capacity
- 11. Middle East and Africa Gas Turbine Services Market Analysis, Insights and Forecast, 2020-2032
- 11.1. Market Analysis, Insights and Forecast - by Capacity
- 11.1.1. Less than 30 MW
- 11.1.2. 31-120 MW
- 11.1.3. Above 120 MW
- 11.2. Market Analysis, Insights and Forecast - by Type
- 11.2.1. Combined Cycle
- 11.2.2. Open Cycle
- 11.3. Market Analysis, Insights and Forecast - by End-User Industry
- 11.3.1. Power
- 11.3.2. Oil and Gas
- 11.3.3. Other End-user Industries
- 11.1. Market Analysis, Insights and Forecast - by Capacity
- 12. Competitive Analysis
- 12.1. Company Profiles
- 12.1.1 Solar Turbines Incorporated
- 12.1.1.1. Company Overview
- 12.1.1.2. Products
- 12.1.1.3. Company Financials
- 12.1.1.4. SWOT Analysis
- 12.1.2 Ansaldo Energia SpA*List Not Exhaustive 6 4 *List Not Exhaustiv
- 12.1.2.1. Company Overview
- 12.1.2.2. Products
- 12.1.2.3. Company Financials
- 12.1.2.4. SWOT Analysis
- 12.1.3 Bharat Heavy Electricals Limited
- 12.1.3.1. Company Overview
- 12.1.3.2. Products
- 12.1.3.3. Company Financials
- 12.1.3.4. SWOT Analysis
- 12.1.4 Siemens AG
- 12.1.4.1. Company Overview
- 12.1.4.2. Products
- 12.1.4.3. Company Financials
- 12.1.4.4. SWOT Analysis
- 12.1.5 Wartsila Oyj Abp
- 12.1.5.1. Company Overview
- 12.1.5.2. Products
- 12.1.5.3. Company Financials
- 12.1.5.4. SWOT Analysis
- 12.1.6 General Electric Company
- 12.1.6.1. Company Overview
- 12.1.6.2. Products
- 12.1.6.3. Company Financials
- 12.1.6.4. SWOT Analysis
- 12.1.7 Kawasaki Heavy Industries Ltd
- 12.1.7.1. Company Overview
- 12.1.7.2. Products
- 12.1.7.3. Company Financials
- 12.1.7.4. SWOT Analysis
- 12.1.8 IHI Corporation
- 12.1.8.1. Company Overview
- 12.1.8.2. Products
- 12.1.8.3. Company Financials
- 12.1.8.4. SWOT Analysis
- 12.1.9 Mitsubishi Heavy Industries Ltd
- 12.1.9.1. Company Overview
- 12.1.9.2. Products
- 12.1.9.3. Company Financials
- 12.1.9.4. SWOT Analysis
- 12.1.1 Solar Turbines Incorporated
- 12.2. Market Entropy
- 12.2.1 Company's Key Areas Served
- 12.2.2 Recent Developments
- 12.3. Company Market Share Analysis 2025
- 12.3.1 Top 5 Companies Market Share Analysis
- 12.3.2 Top 3 Companies Market Share Analysis
- 12.4. List of Potential Customers
- 13. Research Methodology
List of Figures
- Figure 1: Global Gas Turbine Services Market Revenue Breakdown (billion, %) by Region 2025 & 2033
- Figure 2: Asia Pacific Gas Turbine Services Market Revenue (billion), by Capacity 2025 & 2033
- Figure 3: Asia Pacific Gas Turbine Services Market Revenue Share (%), by Capacity 2025 & 2033
- Figure 4: Asia Pacific Gas Turbine Services Market Revenue (billion), by Type 2025 & 2033
- Figure 5: Asia Pacific Gas Turbine Services Market Revenue Share (%), by Type 2025 & 2033
- Figure 6: Asia Pacific Gas Turbine Services Market Revenue (billion), by End-User Industry 2025 & 2033
- Figure 7: Asia Pacific Gas Turbine Services Market Revenue Share (%), by End-User Industry 2025 & 2033
- Figure 8: Asia Pacific Gas Turbine Services Market Revenue (billion), by Country 2025 & 2033
- Figure 9: Asia Pacific Gas Turbine Services Market Revenue Share (%), by Country 2025 & 2033
- Figure 10: North America Gas Turbine Services Market Revenue (billion), by Capacity 2025 & 2033
- Figure 11: North America Gas Turbine Services Market Revenue Share (%), by Capacity 2025 & 2033
- Figure 12: North America Gas Turbine Services Market Revenue (billion), by Type 2025 & 2033
- Figure 13: North America Gas Turbine Services Market Revenue Share (%), by Type 2025 & 2033
- Figure 14: North America Gas Turbine Services Market Revenue (billion), by End-User Industry 2025 & 2033
- Figure 15: North America Gas Turbine Services Market Revenue Share (%), by End-User Industry 2025 & 2033
- Figure 16: North America Gas Turbine Services Market Revenue (billion), by Country 2025 & 2033
- Figure 17: North America Gas Turbine Services Market Revenue Share (%), by Country 2025 & 2033
- Figure 18: Europe Gas Turbine Services Market Revenue (billion), by Capacity 2025 & 2033
- Figure 19: Europe Gas Turbine Services Market Revenue Share (%), by Capacity 2025 & 2033
- Figure 20: Europe Gas Turbine Services Market Revenue (billion), by Type 2025 & 2033
- Figure 21: Europe Gas Turbine Services Market Revenue Share (%), by Type 2025 & 2033
- Figure 22: Europe Gas Turbine Services Market Revenue (billion), by End-User Industry 2025 & 2033
- Figure 23: Europe Gas Turbine Services Market Revenue Share (%), by End-User Industry 2025 & 2033
- Figure 24: Europe Gas Turbine Services Market Revenue (billion), by Country 2025 & 2033
- Figure 25: Europe Gas Turbine Services Market Revenue Share (%), by Country 2025 & 2033
- Figure 26: South America Gas Turbine Services Market Revenue (billion), by Capacity 2025 & 2033
- Figure 27: South America Gas Turbine Services Market Revenue Share (%), by Capacity 2025 & 2033
- Figure 28: South America Gas Turbine Services Market Revenue (billion), by Type 2025 & 2033
- Figure 29: South America Gas Turbine Services Market Revenue Share (%), by Type 2025 & 2033
- Figure 30: South America Gas Turbine Services Market Revenue (billion), by End-User Industry 2025 & 2033
- Figure 31: South America Gas Turbine Services Market Revenue Share (%), by End-User Industry 2025 & 2033
- Figure 32: South America Gas Turbine Services Market Revenue (billion), by Country 2025 & 2033
- Figure 33: South America Gas Turbine Services Market Revenue Share (%), by Country 2025 & 2033
- Figure 34: Middle East and Africa Gas Turbine Services Market Revenue (billion), by Capacity 2025 & 2033
- Figure 35: Middle East and Africa Gas Turbine Services Market Revenue Share (%), by Capacity 2025 & 2033
- Figure 36: Middle East and Africa Gas Turbine Services Market Revenue (billion), by Type 2025 & 2033
- Figure 37: Middle East and Africa Gas Turbine Services Market Revenue Share (%), by Type 2025 & 2033
- Figure 38: Middle East and Africa Gas Turbine Services Market Revenue (billion), by End-User Industry 2025 & 2033
- Figure 39: Middle East and Africa Gas Turbine Services Market Revenue Share (%), by End-User Industry 2025 & 2033
- Figure 40: Middle East and Africa Gas Turbine Services Market Revenue (billion), by Country 2025 & 2033
- Figure 41: Middle East and Africa Gas Turbine Services Market Revenue Share (%), by Country 2025 & 2033
List of Tables
- Table 1: Global Gas Turbine Services Market Revenue billion Forecast, by Capacity 2020 & 2033
- Table 2: Global Gas Turbine Services Market Revenue billion Forecast, by Type 2020 & 2033
- Table 3: Global Gas Turbine Services Market Revenue billion Forecast, by End-User Industry 2020 & 2033
- Table 4: Global Gas Turbine Services Market Revenue billion Forecast, by Region 2020 & 2033
- Table 5: Global Gas Turbine Services Market Revenue billion Forecast, by Capacity 2020 & 2033
- Table 6: Global Gas Turbine Services Market Revenue billion Forecast, by Type 2020 & 2033
- Table 7: Global Gas Turbine Services Market Revenue billion Forecast, by End-User Industry 2020 & 2033
- Table 8: Global Gas Turbine Services Market Revenue billion Forecast, by Country 2020 & 2033
- Table 9: Global Gas Turbine Services Market Revenue billion Forecast, by Capacity 2020 & 2033
- Table 10: Global Gas Turbine Services Market Revenue billion Forecast, by Type 2020 & 2033
- Table 11: Global Gas Turbine Services Market Revenue billion Forecast, by End-User Industry 2020 & 2033
- Table 12: Global Gas Turbine Services Market Revenue billion Forecast, by Country 2020 & 2033
- Table 13: Global Gas Turbine Services Market Revenue billion Forecast, by Capacity 2020 & 2033
- Table 14: Global Gas Turbine Services Market Revenue billion Forecast, by Type 2020 & 2033
- Table 15: Global Gas Turbine Services Market Revenue billion Forecast, by End-User Industry 2020 & 2033
- Table 16: Global Gas Turbine Services Market Revenue billion Forecast, by Country 2020 & 2033
- Table 17: Global Gas Turbine Services Market Revenue billion Forecast, by Capacity 2020 & 2033
- Table 18: Global Gas Turbine Services Market Revenue billion Forecast, by Type 2020 & 2033
- Table 19: Global Gas Turbine Services Market Revenue billion Forecast, by End-User Industry 2020 & 2033
- Table 20: Global Gas Turbine Services Market Revenue billion Forecast, by Country 2020 & 2033
- Table 21: Global Gas Turbine Services Market Revenue billion Forecast, by Capacity 2020 & 2033
- Table 22: Global Gas Turbine Services Market Revenue billion Forecast, by Type 2020 & 2033
- Table 23: Global Gas Turbine Services Market Revenue billion Forecast, by End-User Industry 2020 & 2033
- Table 24: Global Gas Turbine Services Market Revenue billion Forecast, by Country 2020 & 2033
Frequently Asked Questions
1. What is the projected Compound Annual Growth Rate (CAGR) of the Gas Turbine Services Market?
The projected CAGR is approximately 2.1%.
2. Which companies are prominent players in the Gas Turbine Services Market?
Key companies in the market include Solar Turbines Incorporated, Ansaldo Energia SpA*List Not Exhaustive 6 4 *List Not Exhaustiv, Bharat Heavy Electricals Limited, Siemens AG, Wartsila Oyj Abp, General Electric Company, Kawasaki Heavy Industries Ltd, IHI Corporation, Mitsubishi Heavy Industries Ltd.
3. What are the main segments of the Gas Turbine Services Market?
The market segments include Capacity, Type, End-User Industry.
4. Can you provide details about the market size?
The market size is estimated to be USD 11.46 billion as of 2022.
5. What are some drivers contributing to market growth?
4.; Rising Power Demand4.; Substantial Investments And Efforts To Modernize The T&D Grid.
6. What are the notable trends driving market growth?
Power Sector is Expected to Dominate the Market.
7. Are there any restraints impacting market growth?
4.; Rising Distributed Energy Generation.
8. Can you provide examples of recent developments in the market?
N/A
9. What pricing options are available for accessing the report?
Pricing options include single-user, multi-user, and enterprise licenses priced at USD 4750, USD 5250, and USD 8750 respectively.
10. Is the market size provided in terms of value or volume?
The market size is provided in terms of value, measured in billion.
11. Are there any specific market keywords associated with the report?
Yes, the market keyword associated with the report is "Gas Turbine Services Market," which aids in identifying and referencing the specific market segment covered.
12. How do I determine which pricing option suits my needs best?
The pricing options vary based on user requirements and access needs. Individual users may opt for single-user licenses, while businesses requiring broader access may choose multi-user or enterprise licenses for cost-effective access to the report.
13. Are there any additional resources or data provided in the Gas Turbine Services Market report?
While the report offers comprehensive insights, it's advisable to review the specific contents or supplementary materials provided to ascertain if additional resources or data are available.
14. How can I stay updated on further developments or reports in the Gas Turbine Services Market?
To stay informed about further developments, trends, and reports in the Gas Turbine Services Market, consider subscribing to industry newsletters, following relevant companies and organizations, or regularly checking reputable industry news sources and publications.
Methodology
Step 1 - Identification of Relevant Samples Size from Population Database


Step 2 - Approaches for Defining Global Market Size (Value, Volume* & Price*)

Note*: In applicable scenarios
Step 3 - Data Sources
Primary Research
- Web Analytics
- Survey Reports
- Research Institute
- Latest Research Reports
- Opinion Leaders
Secondary Research
- Annual Reports
- White Paper
- Latest Press Release
- Industry Association
- Paid Database
- Investor Presentations

Step 4 - Data Triangulation
Involves using different sources of information in order to increase the validity of a study
These sources are likely to be stakeholders in a program - participants, other researchers, program staff, other community members, and so on.
Then we put all data in single framework & apply various statistical tools to find out the dynamic on the market.
During the analysis stage, feedback from the stakeholder groups would be compared to determine areas of agreement as well as areas of divergence