

Key Insights
The GCC (Gulf Cooperation Council) Autonomous Underwater Vehicle (AUV) market is projected for significant expansion, propelled by escalating offshore oil and gas exploration, enhanced defense budgets for maritime security, and growing demand for underwater infrastructure inspection. The market is anticipated to reach a size of 3830.7 million by 2025, with a Compound Annual Growth Rate (CAGR) of 21.7%. Substantial investments in infrastructure, particularly in the UAE and Saudi Arabia, are driving AUV adoption for surveying, pipeline inspection, and underwater construction. The oil and gas sector remains a primary catalyst, with AUVs offering cost-effective seabed mapping and subsea asset inspection. Moreover, the region's strategic importance and emphasis on maritime security are increasing AUV utilization for surveillance and defense.
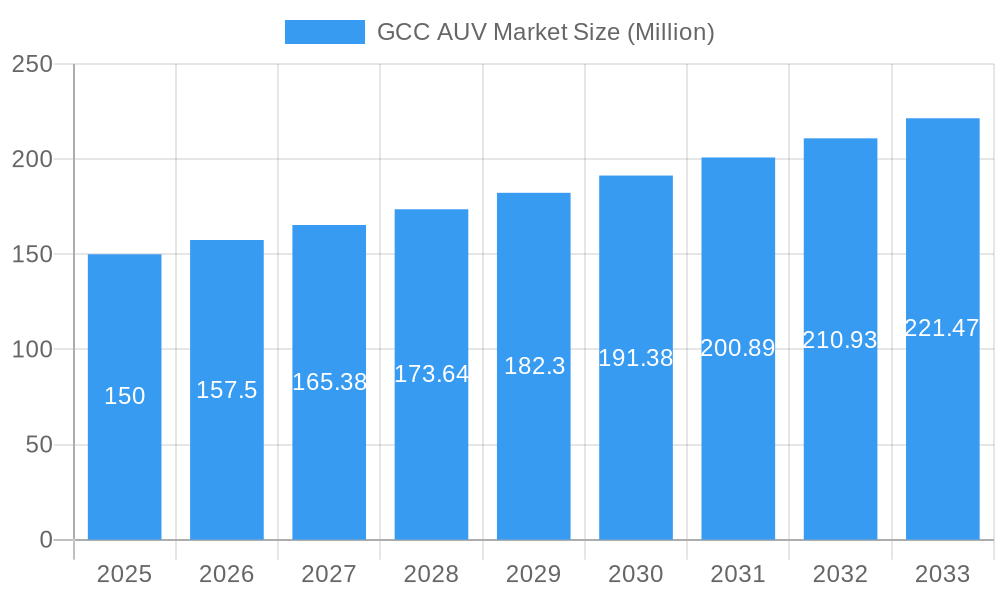
GCC AUV Market Market Size (In Billion)
Potential growth restraints include high initial AUV investment, the requirement for skilled operators, and evolving regulatory frameworks for autonomous systems. However, the outlook remains optimistic, supported by technological advancements enabling more accessible AUVs, government support for innovation, and a focus on sustainable resource management. The market is segmented by application, including oil and gas and defense, reflecting diverse regional needs. Key domestic and international players contribute to a dynamic market landscape. Future growth will be shaped by technological advancements, policy initiatives, and regional economic performance.
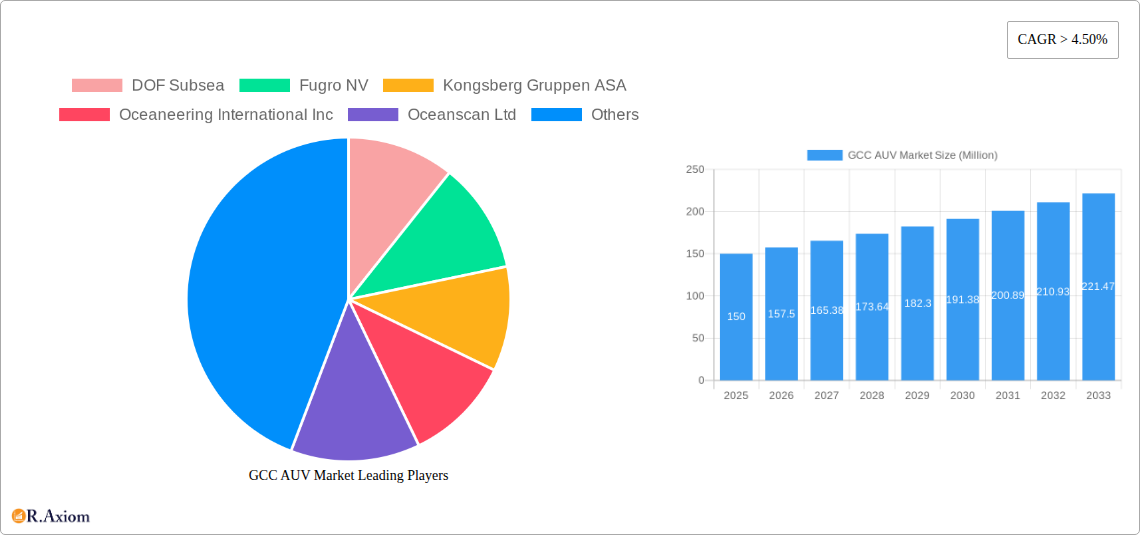
GCC AUV Market Company Market Share
GCC AUV Market: A Comprehensive Report (2019-2033)
This detailed report provides a comprehensive analysis of the Gulf Cooperation Council (GCC) Autonomous Underwater Vehicle (AUV) market, covering the period 2019-2033. It offers in-depth insights into market size, growth drivers, challenges, key players, and future opportunities, equipping stakeholders with actionable intelligence for strategic decision-making. The report utilizes data from the historical period (2019-2024), the base year (2025), and projects the market’s trajectory through the forecast period (2025-2033). The estimated market size in 2025 is valued at xx Million.
GCC AUV Market Concentration & Innovation
The GCC AUV market exhibits a moderately concentrated landscape, with key players like DOF Subsea, Fugro NV, Kongsberg Gruppen ASA, Oceaneering International Inc., and others holding significant market share. However, the emergence of smaller, specialized companies and ongoing technological advancements are driving increased competition. Market share dynamics are influenced by factors such as technological innovation, R&D investments, strategic partnerships, and M&A activities. While precise market share figures are proprietary to the full report, analysis indicates a xx% market concentration in 2025, expected to slightly increase to xx% by 2033 due to ongoing consolidation. M&A activity has been moderate, with deal values ranging from xx Million to xx Million in recent years, mainly driven by the need to access specialized technologies and expand geographical reach. Innovation in AUV technology is fueled by the demand for enhanced capabilities in areas such as navigation, sensor integration, endurance, and data processing. Stringent regulatory frameworks concerning underwater operations and data security also influence innovation and adoption. Product substitution is limited, with AUVs offering unique advantages over traditional underwater survey methods. End-user trends toward automation and data-driven decision-making are driving demand for advanced AUV systems.
GCC AUV Market Industry Trends & Insights
The GCC AUV market is experiencing robust growth, driven primarily by increasing exploration and production activities in the oil and gas sector, expanding defense budgets, and rising investments in underwater infrastructure projects. Technological advancements, such as improved battery technology, enhanced sensor capabilities, and the development of AI-powered navigation systems, are further accelerating market expansion. The market is witnessing a shift toward more sophisticated AUVs capable of performing complex tasks autonomously. Consumer preferences are focused on reliability, operational efficiency, data accuracy, and ease of use. Competitive dynamics are characterized by intense rivalry among established players and the emergence of innovative startups. The Compound Annual Growth Rate (CAGR) for the GCC AUV market during the forecast period (2025-2033) is projected to be xx%, with market penetration expected to reach xx% by 2033. This growth is partly attributed to increased government initiatives to adopt advanced technologies in various sectors.
Dominant Markets & Segments in GCC AUV Market
The Oil and Gas sector is the dominant segment in the GCC AUV market, accounting for a significant proportion of overall revenue. This dominance stems from the region's substantial hydrocarbon reserves and the ongoing need for efficient and cost-effective exploration and production techniques. Key drivers in this segment include:
- High investment in offshore oil and gas exploration: The GCC countries are heavily reliant on oil and gas revenues, leading to significant investments in offshore exploration and production.
- Demand for advanced underwater surveys: AUVs are crucial for conducting detailed underwater surveys, inspections, and maintenance of offshore infrastructure.
- Government initiatives to improve efficiency: Governments are actively promoting the adoption of advanced technologies like AUVs to enhance the efficiency and safety of offshore operations.
The Defense segment is also experiencing considerable growth, fueled by increasing geopolitical tensions and the need for advanced underwater surveillance and defense capabilities. The "Others" segment, which includes scientific research, environmental monitoring, and commercial applications, is expected to show steady growth driven by increasing environmental awareness and the need for better data collection methods. The United Arab Emirates (UAE) and Saudi Arabia are currently the leading markets in the GCC region, driven by their strong economies and investments in technologically advanced solutions.
GCC AUV Market Product Developments
Recent product innovations in the GCC AUV market are focused on enhancing autonomy, payload capacity, endurance, and data processing capabilities. This includes advancements in navigation systems, sensor technology, and communication protocols. New AUV models are being designed to operate in more challenging environments and perform more complex tasks. These improvements enhance the overall efficiency, safety, and cost-effectiveness of AUV operations, making them attractive to a wider range of industries and applications. The market is witnessing a trend towards modular AUV designs, allowing users to customize systems to their specific needs.
Report Scope & Segmentation Analysis
This report segments the GCC AUV market based on application:
Oil and Gas: This segment is characterized by high demand for AUVs capable of performing tasks such as pipeline inspection, subsea construction surveys, and seabed mapping. Growth is projected to be xx% CAGR, driven by ongoing investment in offshore oil and gas exploration and production.
Defense: This segment shows significant growth potential, fueled by increasing defense budgets and the need for advanced underwater surveillance and anti-submarine warfare capabilities. The projected CAGR is xx%, driven by increasing geopolitical concerns and national security priorities.
Others: This segment encompasses various applications, including scientific research, environmental monitoring, and commercial applications. Growth is moderate with a projected CAGR of xx%, driven by an increasing need for data collection and the use of AUVs in these various sectors.
Key Drivers of GCC AUV Market Growth
The GCC AUV market's growth is primarily driven by:
- Growing Oil and Gas Exploration: Increased exploration and production activities are a major driver of AUV adoption for surveys and inspections.
- Investments in Defense Capabilities: Rising defense spending fuels demand for AUVs in underwater surveillance and warfare applications.
- Technological Advancements: Improvements in battery technology, sensor systems, and AI enhance AUV capabilities and efficiency.
- Government Support: Government initiatives to promote technological innovation and modernization support the market's expansion.
Challenges in the GCC AUV Market Sector
The GCC AUV market faces several challenges, including:
- High initial investment costs: AUVs require significant upfront investment, which can be a barrier for smaller companies.
- Regulatory complexities: Navigating regulations surrounding AUV operations can be challenging and time-consuming.
- Skill gap: A shortage of skilled personnel to operate and maintain AUVs poses a significant constraint.
- Supply chain disruptions: Global supply chain challenges impact the availability and cost of AUV components.
Emerging Opportunities in GCC AUV Market
Several emerging opportunities exist within the GCC AUV market, such as:
- Expansion into new applications: AUVs are finding increased use in areas like aquaculture, renewable energy infrastructure inspection and environmental monitoring.
- Integration of AI and Machine Learning: Integrating AI and ML improves AUV autonomy and decision-making capabilities.
- Development of hybrid AUVs: Combining AUV and surface vehicle capabilities offers enhanced operational flexibility.
Leading Players in the GCC AUV Market Market
- DOF Subsea
- Fugro NV
- Kongsberg Gruppen ASA
- Oceaneering International Inc.
- Oceanscan Ltd
- Forum Energy Technologies Inc.
- Bluefin Robotics Corp
- Saab AB
- Atlas Elektronik GmbH
Key Developments in GCC AUV Market Industry
- November 2021: The United Arab Emirates Defense Conglomerate EDGE and Israel Aerospace Industries (IAI) announced a partnership to develop unmanned underwater vessels, signifying increased focus on defense applications.
- June 2022: King Abdullah University of Science and Technology (KAUST) collaborated with Ocean Aero, deploying solar and battery-powered AUVs in the Red Sea, showcasing the growing use of AUVs in research.
Strategic Outlook for GCC AUV Market Market
The GCC AUV market holds significant future potential, driven by continued investments in oil and gas exploration, defense modernization, and emerging applications in various sectors. Technological innovations, coupled with supportive government policies, are expected to further stimulate market growth. The market's trajectory will be shaped by factors such as the pace of technological advancements, geopolitical stability, and the ongoing need for efficient and cost-effective underwater solutions. The strategic outlook is positive, with continued expansion anticipated throughout the forecast period.
GCC AUV Market Segmentation
-
1. Application
- 1.1. Oil and Gas
- 1.2. Defense
- 1.3. Others
-
2. Geography
- 2.1. UAE
- 2.2. Saudi Arabia
- 2.3. Rest of GCC Countries
GCC AUV Market Segmentation By Geography
- 1. UAE
- 2. Saudi Arabia
- 3. Rest of GCC Countries
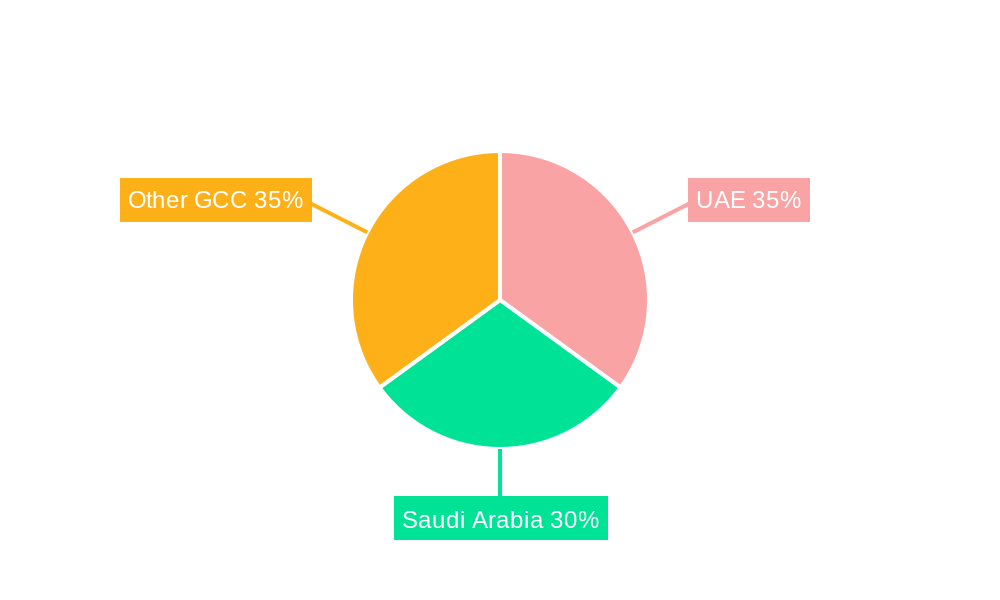
GCC AUV Market Regional Market Share
Geographic Coverage of GCC AUV Market
GCC AUV Market REPORT HIGHLIGHTS
| Aspects | Details |
|---|---|
| Study Period | 2020-2034 |
| Base Year | 2025 |
| Estimated Year | 2026 |
| Forecast Period | 2026-2034 |
| Historical Period | 2020-2025 |
| Growth Rate | CAGR of 21.7% from 2020-2034 |
| Segmentation |
|
Table of Contents
- 1. Introduction
- 1.1. Research Scope
- 1.2. Market Segmentation
- 1.3. Research Objective
- 1.4. Definitions and Assumptions
- 2. Executive Summary
- 2.1. Market Snapshot
- 3. Market Dynamics
- 3.1. Market Drivers
- 3.2. Market Restrains
- 3.3. Market Trends
- 3.4. Market Opportunities
- 4. Market Factor Analysis
- 4.1. Porters Five Forces
- 4.1.1. Bargaining Power of Suppliers
- 4.1.2. Bargaining Power of Buyers
- 4.1.3. Threat of New Entrants
- 4.1.4. Threat of Substitutes
- 4.1.5. Competitive Rivalry
- 4.2. PESTEL analysis
- 4.3. BCG Analysis
- 4.3.1. Stars (High Growth, High Market Share)
- 4.3.2. Cash Cows (Low Growth, High Market Share)
- 4.3.3. Question Mark (High Growth, Low Market Share)
- 4.3.4. Dogs (Low Growth, Low Market Share)
- 4.4. Ansoff Matrix Analysis
- 4.5. Supply Chain Analysis
- 4.6. Regulatory Landscape
- 4.7. Current Market Potential and Opportunity Assessment (TAM–SAM–SOM Framework)
- 4.8. RAX Analyst Note
- 4.1. Porters Five Forces
- 5. Market Analysis, Insights and Forecast 2021-2033
- 5.1. Market Analysis, Insights and Forecast - by Application
- 5.1.1. Oil and Gas
- 5.1.2. Defense
- 5.1.3. Others
- 5.2. Market Analysis, Insights and Forecast - by Geography
- 5.2.1. UAE
- 5.2.2. Saudi Arabia
- 5.2.3. Rest of GCC Countries
- 5.3. Market Analysis, Insights and Forecast - by Region
- 5.3.1. UAE
- 5.3.2. Saudi Arabia
- 5.3.3. Rest of GCC Countries
- 5.1. Market Analysis, Insights and Forecast - by Application
- 6. Global GCC AUV Market Analysis, Insights and Forecast, 2021-2033
- 6.1. Market Analysis, Insights and Forecast - by Application
- 6.1.1. Oil and Gas
- 6.1.2. Defense
- 6.1.3. Others
- 6.2. Market Analysis, Insights and Forecast - by Geography
- 6.2.1. UAE
- 6.2.2. Saudi Arabia
- 6.2.3. Rest of GCC Countries
- 6.1. Market Analysis, Insights and Forecast - by Application
- 7. UAE GCC AUV Market Analysis, Insights and Forecast, 2020-2032
- 7.1. Market Analysis, Insights and Forecast - by Application
- 7.1.1. Oil and Gas
- 7.1.2. Defense
- 7.1.3. Others
- 7.2. Market Analysis, Insights and Forecast - by Geography
- 7.2.1. UAE
- 7.2.2. Saudi Arabia
- 7.2.3. Rest of GCC Countries
- 7.1. Market Analysis, Insights and Forecast - by Application
- 8. Saudi Arabia GCC AUV Market Analysis, Insights and Forecast, 2020-2032
- 8.1. Market Analysis, Insights and Forecast - by Application
- 8.1.1. Oil and Gas
- 8.1.2. Defense
- 8.1.3. Others
- 8.2. Market Analysis, Insights and Forecast - by Geography
- 8.2.1. UAE
- 8.2.2. Saudi Arabia
- 8.2.3. Rest of GCC Countries
- 8.1. Market Analysis, Insights and Forecast - by Application
- 9. Rest of GCC Countries GCC AUV Market Analysis, Insights and Forecast, 2020-2032
- 9.1. Market Analysis, Insights and Forecast - by Application
- 9.1.1. Oil and Gas
- 9.1.2. Defense
- 9.1.3. Others
- 9.2. Market Analysis, Insights and Forecast - by Geography
- 9.2.1. UAE
- 9.2.2. Saudi Arabia
- 9.2.3. Rest of GCC Countries
- 9.1. Market Analysis, Insights and Forecast - by Application
- 10. Competitive Analysis
- 10.1. Company Profiles
- 10.1.1 DOF Subsea
- 10.1.1.1. Company Overview
- 10.1.1.2. Products
- 10.1.1.3. Company Financials
- 10.1.1.4. SWOT Analysis
- 10.1.2 Fugro NV
- 10.1.2.1. Company Overview
- 10.1.2.2. Products
- 10.1.2.3. Company Financials
- 10.1.2.4. SWOT Analysis
- 10.1.3 Kongsberg Gruppen ASA
- 10.1.3.1. Company Overview
- 10.1.3.2. Products
- 10.1.3.3. Company Financials
- 10.1.3.4. SWOT Analysis
- 10.1.4 Oceaneering International Inc
- 10.1.4.1. Company Overview
- 10.1.4.2. Products
- 10.1.4.3. Company Financials
- 10.1.4.4. SWOT Analysis
- 10.1.5 Oceanscan Ltd
- 10.1.5.1. Company Overview
- 10.1.5.2. Products
- 10.1.5.3. Company Financials
- 10.1.5.4. SWOT Analysis
- 10.1.6 Forum Energy Technologies Inc
- 10.1.6.1. Company Overview
- 10.1.6.2. Products
- 10.1.6.3. Company Financials
- 10.1.6.4. SWOT Analysis
- 10.1.7 Bluefin Robotics Corp
- 10.1.7.1. Company Overview
- 10.1.7.2. Products
- 10.1.7.3. Company Financials
- 10.1.7.4. SWOT Analysis
- 10.1.8 Saab AB*List Not Exhaustive
- 10.1.8.1. Company Overview
- 10.1.8.2. Products
- 10.1.8.3. Company Financials
- 10.1.8.4. SWOT Analysis
- 10.1.9 Atlas Elektronik GmbH
- 10.1.9.1. Company Overview
- 10.1.9.2. Products
- 10.1.9.3. Company Financials
- 10.1.9.4. SWOT Analysis
- 10.1.1 DOF Subsea
- 10.2. Market Entropy
- 10.2.1 Company's Key Areas Served
- 10.2.2 Recent Developments
- 10.3. Company Market Share Analysis 2025
- 10.3.1 Top 5 Companies Market Share Analysis
- 10.3.2 Top 3 Companies Market Share Analysis
- 10.4. List of Potential Customers
- 11. Research Methodology
List of Figures
- Figure 1: Global GCC AUV Market Revenue Breakdown (million, %) by Region 2025 & 2033
- Figure 2: Global GCC AUV Market Volume Breakdown (K Unit, %) by Region 2025 & 2033
- Figure 3: UAE GCC AUV Market Revenue (million), by Application 2025 & 2033
- Figure 4: UAE GCC AUV Market Volume (K Unit), by Application 2025 & 2033
- Figure 5: UAE GCC AUV Market Revenue Share (%), by Application 2025 & 2033
- Figure 6: UAE GCC AUV Market Volume Share (%), by Application 2025 & 2033
- Figure 7: UAE GCC AUV Market Revenue (million), by Geography 2025 & 2033
- Figure 8: UAE GCC AUV Market Volume (K Unit), by Geography 2025 & 2033
- Figure 9: UAE GCC AUV Market Revenue Share (%), by Geography 2025 & 2033
- Figure 10: UAE GCC AUV Market Volume Share (%), by Geography 2025 & 2033
- Figure 11: UAE GCC AUV Market Revenue (million), by Country 2025 & 2033
- Figure 12: UAE GCC AUV Market Volume (K Unit), by Country 2025 & 2033
- Figure 13: UAE GCC AUV Market Revenue Share (%), by Country 2025 & 2033
- Figure 14: UAE GCC AUV Market Volume Share (%), by Country 2025 & 2033
- Figure 15: Saudi Arabia GCC AUV Market Revenue (million), by Application 2025 & 2033
- Figure 16: Saudi Arabia GCC AUV Market Volume (K Unit), by Application 2025 & 2033
- Figure 17: Saudi Arabia GCC AUV Market Revenue Share (%), by Application 2025 & 2033
- Figure 18: Saudi Arabia GCC AUV Market Volume Share (%), by Application 2025 & 2033
- Figure 19: Saudi Arabia GCC AUV Market Revenue (million), by Geography 2025 & 2033
- Figure 20: Saudi Arabia GCC AUV Market Volume (K Unit), by Geography 2025 & 2033
- Figure 21: Saudi Arabia GCC AUV Market Revenue Share (%), by Geography 2025 & 2033
- Figure 22: Saudi Arabia GCC AUV Market Volume Share (%), by Geography 2025 & 2033
- Figure 23: Saudi Arabia GCC AUV Market Revenue (million), by Country 2025 & 2033
- Figure 24: Saudi Arabia GCC AUV Market Volume (K Unit), by Country 2025 & 2033
- Figure 25: Saudi Arabia GCC AUV Market Revenue Share (%), by Country 2025 & 2033
- Figure 26: Saudi Arabia GCC AUV Market Volume Share (%), by Country 2025 & 2033
- Figure 27: Rest of GCC Countries GCC AUV Market Revenue (million), by Application 2025 & 2033
- Figure 28: Rest of GCC Countries GCC AUV Market Volume (K Unit), by Application 2025 & 2033
- Figure 29: Rest of GCC Countries GCC AUV Market Revenue Share (%), by Application 2025 & 2033
- Figure 30: Rest of GCC Countries GCC AUV Market Volume Share (%), by Application 2025 & 2033
- Figure 31: Rest of GCC Countries GCC AUV Market Revenue (million), by Geography 2025 & 2033
- Figure 32: Rest of GCC Countries GCC AUV Market Volume (K Unit), by Geography 2025 & 2033
- Figure 33: Rest of GCC Countries GCC AUV Market Revenue Share (%), by Geography 2025 & 2033
- Figure 34: Rest of GCC Countries GCC AUV Market Volume Share (%), by Geography 2025 & 2033
- Figure 35: Rest of GCC Countries GCC AUV Market Revenue (million), by Country 2025 & 2033
- Figure 36: Rest of GCC Countries GCC AUV Market Volume (K Unit), by Country 2025 & 2033
- Figure 37: Rest of GCC Countries GCC AUV Market Revenue Share (%), by Country 2025 & 2033
- Figure 38: Rest of GCC Countries GCC AUV Market Volume Share (%), by Country 2025 & 2033
List of Tables
- Table 1: Global GCC AUV Market Revenue million Forecast, by Application 2020 & 2033
- Table 2: Global GCC AUV Market Volume K Unit Forecast, by Application 2020 & 2033
- Table 3: Global GCC AUV Market Revenue million Forecast, by Geography 2020 & 2033
- Table 4: Global GCC AUV Market Volume K Unit Forecast, by Geography 2020 & 2033
- Table 5: Global GCC AUV Market Revenue million Forecast, by Region 2020 & 2033
- Table 6: Global GCC AUV Market Volume K Unit Forecast, by Region 2020 & 2033
- Table 7: Global GCC AUV Market Revenue million Forecast, by Application 2020 & 2033
- Table 8: Global GCC AUV Market Volume K Unit Forecast, by Application 2020 & 2033
- Table 9: Global GCC AUV Market Revenue million Forecast, by Geography 2020 & 2033
- Table 10: Global GCC AUV Market Volume K Unit Forecast, by Geography 2020 & 2033
- Table 11: Global GCC AUV Market Revenue million Forecast, by Country 2020 & 2033
- Table 12: Global GCC AUV Market Volume K Unit Forecast, by Country 2020 & 2033
- Table 13: Global GCC AUV Market Revenue million Forecast, by Application 2020 & 2033
- Table 14: Global GCC AUV Market Volume K Unit Forecast, by Application 2020 & 2033
- Table 15: Global GCC AUV Market Revenue million Forecast, by Geography 2020 & 2033
- Table 16: Global GCC AUV Market Volume K Unit Forecast, by Geography 2020 & 2033
- Table 17: Global GCC AUV Market Revenue million Forecast, by Country 2020 & 2033
- Table 18: Global GCC AUV Market Volume K Unit Forecast, by Country 2020 & 2033
- Table 19: Global GCC AUV Market Revenue million Forecast, by Application 2020 & 2033
- Table 20: Global GCC AUV Market Volume K Unit Forecast, by Application 2020 & 2033
- Table 21: Global GCC AUV Market Revenue million Forecast, by Geography 2020 & 2033
- Table 22: Global GCC AUV Market Volume K Unit Forecast, by Geography 2020 & 2033
- Table 23: Global GCC AUV Market Revenue million Forecast, by Country 2020 & 2033
- Table 24: Global GCC AUV Market Volume K Unit Forecast, by Country 2020 & 2033
Frequently Asked Questions
1. What is the projected Compound Annual Growth Rate (CAGR) of the GCC AUV Market?
The projected CAGR is approximately 21.7%.
2. Which companies are prominent players in the GCC AUV Market?
Key companies in the market include DOF Subsea, Fugro NV, Kongsberg Gruppen ASA, Oceaneering International Inc, Oceanscan Ltd, Forum Energy Technologies Inc, Bluefin Robotics Corp, Saab AB*List Not Exhaustive, Atlas Elektronik GmbH.
3. What are the main segments of the GCC AUV Market?
The market segments include Application, Geography.
4. Can you provide details about the market size?
The market size is estimated to be USD 3830.7 million as of 2022.
5. What are some drivers contributing to market growth?
4.; Increasing Number of Automobiles4.; The Government Policy Regarding Pollution Emission Control Parameters.
6. What are the notable trends driving market growth?
Oil and gas Segment to have a Significant Share in the Market.
7. Are there any restraints impacting market growth?
4.; The Technological Limitations of Air Filters.
8. Can you provide examples of recent developments in the market?
June 2022: King Abdullah University of Science and Technology (KAUST) collaborated with Ocean Aero to deploy solar and battery-powered autonomous underwater and surface vehicles in the Red Sea, Saudi Arabia, which is expected to enhance KAUST research of the Red Sea.
9. What pricing options are available for accessing the report?
Pricing options include single-user, multi-user, and enterprise licenses priced at USD 4750, USD 5250, and USD 8750 respectively.
10. Is the market size provided in terms of value or volume?
The market size is provided in terms of value, measured in million and volume, measured in K Unit.
11. Are there any specific market keywords associated with the report?
Yes, the market keyword associated with the report is "GCC AUV Market," which aids in identifying and referencing the specific market segment covered.
12. How do I determine which pricing option suits my needs best?
The pricing options vary based on user requirements and access needs. Individual users may opt for single-user licenses, while businesses requiring broader access may choose multi-user or enterprise licenses for cost-effective access to the report.
13. Are there any additional resources or data provided in the GCC AUV Market report?
While the report offers comprehensive insights, it's advisable to review the specific contents or supplementary materials provided to ascertain if additional resources or data are available.
14. How can I stay updated on further developments or reports in the GCC AUV Market?
To stay informed about further developments, trends, and reports in the GCC AUV Market, consider subscribing to industry newsletters, following relevant companies and organizations, or regularly checking reputable industry news sources and publications.
Methodology
Step 1 - Identification of Relevant Samples Size from Population Database


Step 2 - Approaches for Defining Global Market Size (Value, Volume* & Price*)

Note*: In applicable scenarios
Step 3 - Data Sources
Primary Research
- Web Analytics
- Survey Reports
- Research Institute
- Latest Research Reports
- Opinion Leaders
Secondary Research
- Annual Reports
- White Paper
- Latest Press Release
- Industry Association
- Paid Database
- Investor Presentations

Step 4 - Data Triangulation
Involves using different sources of information in order to increase the validity of a study
These sources are likely to be stakeholders in a program - participants, other researchers, program staff, other community members, and so on.
Then we put all data in single framework & apply various statistical tools to find out the dynamic on the market.
During the analysis stage, feedback from the stakeholder groups would be compared to determine areas of agreement as well as areas of divergence