

Key Insights
The global gemstones market, valued at $12.7 billion in 2025, is projected for substantial growth with a CAGR of 6.3% from 2025 to 2033. Key drivers include rising disposable incomes in emerging economies, particularly Asia-Pacific, boosting luxury goods consumption. The expansion of online retail channels is enhancing customer reach and sales volume. Evolving fashion trends and a growing demand for unique, personalized jewelry further stimulate market expansion. The industry's segmentation across product types such as rings, necklaces, earrings, and bracelets caters to diverse consumer preferences.
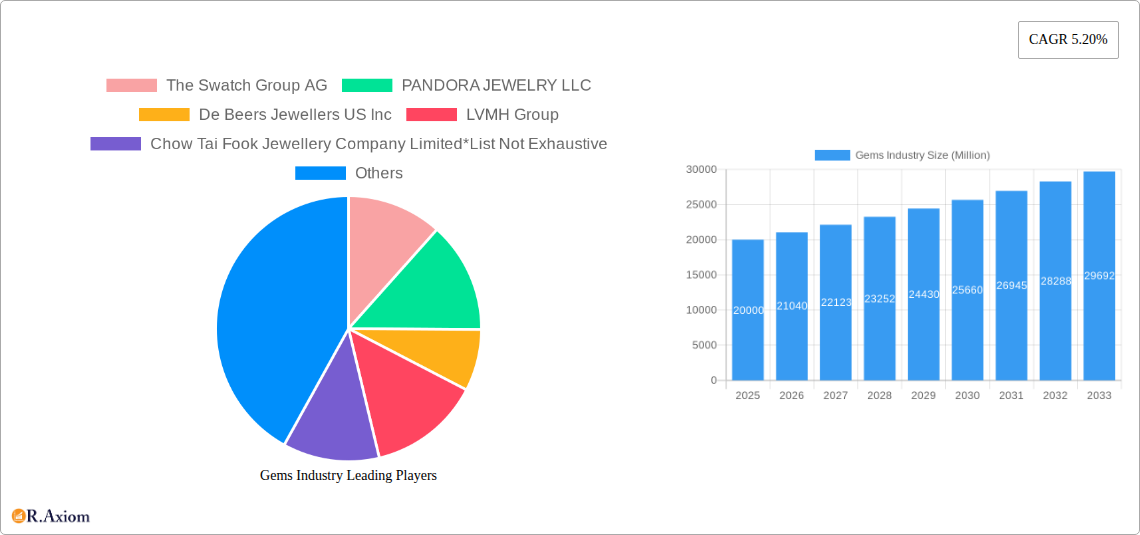
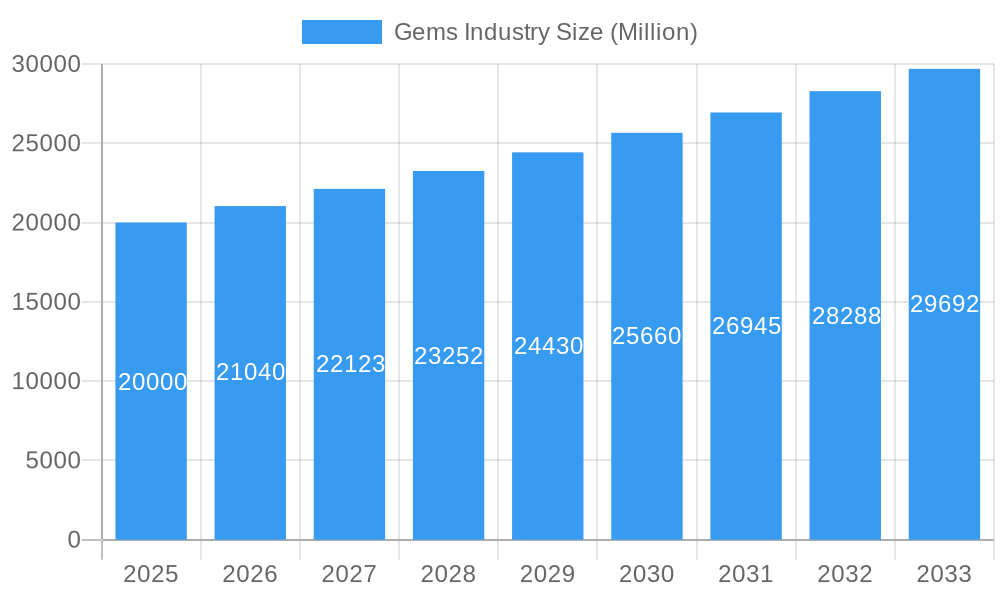
Gems Industry Market Size (In Billion)
Leading entities like The Swatch Group AG, Pandora, and LVMH are solidifying their market positions through brand equity, innovative designs, and strategic collaborations. However, the sector faces headwinds from volatile gemstone pricing, supply chain disruptions, economic uncertainties, ethical sourcing concerns, and increasing competition from synthetic alternatives.
Gems Industry Company Market Share
Despite these challenges, a positive long-term outlook prevails. The expanding global middle class and a heightened preference for ethically sourced, sustainable gemstones present significant opportunities. Strategic investments in supply chain transparency and traceability technologies, alongside targeted marketing that emphasizes the intrinsic value and craftsmanship of genuine gemstones, are critical for sustained growth. The continued proliferation of e-commerce platforms for luxury goods will further amplify market access and sales. Regionally, Asia-Pacific is anticipated to lead market share, driven by its vast and rapidly growing consumer base. North America and Europe will also be key contributors, albeit with potentially slower growth trajectories compared to Asia-Pacific.
Gems Industry Market Insights: 2019-2033
This comprehensive report offers an in-depth analysis of the global gems industry, detailing market dynamics, competitive landscapes, and future growth projections from 2019 to 2033. The analysis covers the historical period of 2019-2024, with 2025 serving as the base and estimated year, followed by a forecast period from 2025 to 2033. This study is an essential resource for industry stakeholders, investors, and those seeking a thorough understanding of this evolving sector. The global market is forecasted to reach significant valuations by 2033, indicating robust growth opportunities.
Gems Industry Market Concentration & Innovation
The gems industry exhibits a moderately concentrated market structure, with a few major players holding significant market share. The Swatch Group AG, PANDORA JEWELRY LLC, De Beers Jewellers US Inc, LVMH Group, and Richemont SA are among the leading companies, collectively accounting for approximately xx% of the global market in 2024. However, numerous smaller players and regional brands contribute significantly to overall market volume.
- Market Share Concentration: The top 5 players control approximately xx% of the global market, while the remaining xx% is shared among numerous smaller players.
- Innovation Drivers: The industry is driven by innovation in design, materials (e.g., lab-grown diamonds), and manufacturing technologies (e.g., 3D printing). Sustainability concerns are also a major driver, pushing companies to adopt ethical sourcing and eco-friendly practices.
- Regulatory Frameworks: Government regulations regarding ethical sourcing, diamond traceability, and consumer protection significantly impact market dynamics. Varying regulations across countries create complexity for international players.
- Product Substitutes: The primary substitutes for natural gemstones are lab-grown alternatives, which are becoming increasingly popular due to their lower cost and ethical production. Imitation jewelry made from other materials also offers competition.
- End-User Trends: Consumer preferences are shifting towards personalized jewelry, sustainable practices, and unique designs. Demand for ethically sourced gemstones and recycled materials is growing.
- M&A Activities: Mergers and acquisitions have played a role in shaping the industry landscape. The total value of M&A deals in the gems industry between 2019 and 2024 was approximately xx Million, with most transactions focused on consolidation and expansion into new markets. Major deals included [insert specific examples if available; otherwise, use 'Several strategic acquisitions focused on brand diversification and vertical integration'].
Gems Industry Industry Trends & Insights
The global gems industry is witnessing robust growth, driven by several key factors. The compound annual growth rate (CAGR) from 2019 to 2024 was approximately xx%, and is projected to be xx% from 2025 to 2033. Market penetration of online retail channels is increasing steadily, with an estimated xx% of total sales in 2024 and a projected increase to xx% by 2033. Rising disposable incomes in developing economies, coupled with increased demand for luxury goods, are significant growth drivers. The industry is also witnessing a growing trend toward personalized and bespoke jewelry, fueling innovation and higher price points. Technological advancements in manufacturing and design are enabling greater efficiency and customization. However, the industry faces challenges such as fluctuating raw material prices, ethical sourcing concerns, and competition from lab-grown alternatives. The competitive landscape is dynamic, with established players and new entrants vying for market share.
Dominant Markets & Segments in Gems Industry
The Asia-Pacific region dominated the global gems market in 2024, accounting for approximately xx% of the total revenue, followed by North America and Europe. Within the product type segment, rings hold the largest market share, driven by their popularity as engagement and wedding rings. Online retail stores are exhibiting the fastest growth rate, surpassing offline stores in terms of CAGR.
- Key Drivers for Asia-Pacific Dominance:
- Strong economic growth in key markets like China and India.
- Rising disposable incomes and increased consumer spending on luxury goods.
- Deeply rooted cultural traditions and significance of jewelry.
- A robust domestic manufacturing base and extensive distribution networks.
- Dominant Product Type: Rings (xx Million in 2024), followed by necklaces, earrings, bracelets, chains and pendants, and other product types.
- Dominant Distribution Channel: Offline retail stores maintained the largest market share in 2024 (xx Million), but online retail channels are rapidly growing.
Gems Industry Product Developments
Recent years have witnessed significant product innovations, including the rise of lab-grown diamonds, sustainable jewelry made from recycled materials, and the integration of technology into design and manufacturing. 3D printing is enabling customized jewelry designs, and advancements in material science are leading to the creation of new and unique gemstones. These developments are enhancing product offerings, catering to evolving consumer preferences for sustainability and personalization.
Report Scope & Segmentation Analysis
This report segments the gems market by product type (Rings, Necklaces, Earrings, Bracelets, Chains and Pendants, Other Product Types) and distribution channel (Offline Retail Stores, Online Retail Stores). Each segment’s market size, growth projections, and competitive dynamics are analyzed in detail. The market is expected to witness significant growth across all segments, with online retail channels showing the highest growth potential. Competition varies significantly across different segments, with some segments characterized by high competition and others by niche players.
Key Drivers of Gems Industry Growth
Key growth drivers include rising disposable incomes, especially in emerging markets, increasing demand for luxury goods, technological advancements in design and manufacturing, and growing consumer preference for personalized and sustainable jewelry. Government policies promoting ethical sourcing also play a significant role.
Challenges in the Gems Industry Sector
The gems industry faces challenges including fluctuating raw material prices, ethical sourcing concerns, competition from synthetic gemstones and imitations, stringent environmental regulations and supply chain disruptions (xx% impact on 2024 market value due to supply issues).
Emerging Opportunities in Gems Industry
Emerging opportunities lie in the growing demand for personalized jewelry, the rise of e-commerce, and the increasing focus on sustainability. New markets in developing economies, technological advancements such as 3D printing, and the integration of augmented reality/virtual reality (AR/VR) in retail offer significant potential.
Leading Players in the Gems Industry Market
- The Swatch Group AG
- PANDORA JEWELRY LLC
- De Beers Jewellers US Inc
- LVMH Group
- Chow Tai Fook Jewellery Company Limited
- Richemont SA
- Swarovski Crystal Online AG
- Chow Tai Fook Jewelry Company Limited
- Tata Sons Private Ltd
- Signet Jewelers
Key Developments in Gems Industry Industry
- August 2022: Pandora launched 'Pandora Brilliance,' a new line of jewelry featuring lab-grown diamonds produced from 100 percent renewable energy. This launch signals a significant shift towards sustainable practices within the industry.
- August 2022: Louis Vuitton launched a new Empreinte Fine Jewelry collection, drawing inspiration from the brand's emblematic codes. This demonstrates a focus on high-end jewelry and brand heritage.
- September 2022: Tanishq launched 'The Chola' collection, inspired by the Chola Dynasty, highlighting the growing market for culturally relevant jewelry.
Strategic Outlook for Gems Industry Market
The gems industry is poised for continued growth, driven by evolving consumer preferences and technological advancements. Focusing on sustainability, personalization, and leveraging digital channels will be key to success. The increasing demand for ethically sourced gemstones and lab-grown alternatives presents both challenges and opportunities for industry players. Market expansion in developing economies, coupled with innovation in design and manufacturing, will shape future market dynamics.
Gems Industry Segmentation
-
1. Product Type
- 1.1. Rings
- 1.2. Necklaces
- 1.3. Earrings
- 1.4. Bracelets
- 1.5. Chains and Pendants
- 1.6. Other Product Types
-
2. Distribution Channel
- 2.1. Offline Retail Stores
- 2.2. Online Retail Stores
Gems Industry Segmentation By Geography
-
1. North America
- 1.1. United States
- 1.2. Canada
- 1.3. Mexico
- 1.4. Rest of North America
-
2. Europe
- 2.1. Spain
- 2.2. United Kingdom
- 2.3. France
- 2.4. Germany
- 2.5. Russia
- 2.6. Italy
- 2.7. Rest of Europe
-
3. Asia Pacific
- 3.1. China
- 3.2. Japan
- 3.3. India
- 3.4. Australia
- 3.5. Rest of Asia Pacific
-
4. South America
- 4.1. Brazil
- 4.2. Argentina
- 4.3. Rest of South America
-
5. Middle East and Africa
- 5.1. South Africa
- 5.2. United Arab Emirates
- 5.3. Rest of Middle East and Africa
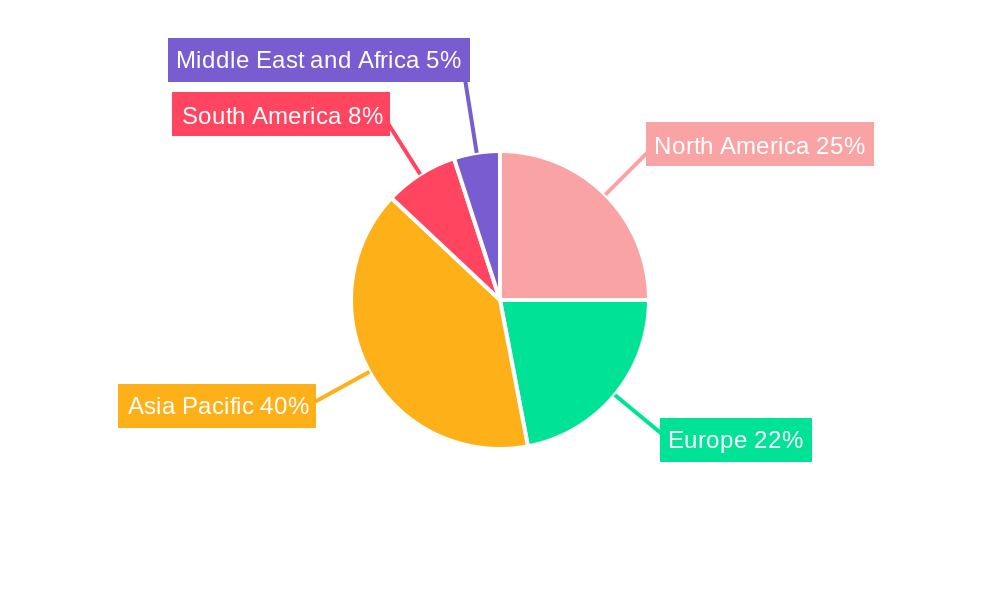
Gems Industry Regional Market Share
Geographic Coverage of Gems Industry
Gems Industry REPORT HIGHLIGHTS
| Aspects | Details |
|---|---|
| Study Period | 2020-2034 |
| Base Year | 2025 |
| Estimated Year | 2026 |
| Forecast Period | 2026-2034 |
| Historical Period | 2020-2025 |
| Growth Rate | CAGR of 6.3% from 2020-2034 |
| Segmentation |
|
Table of Contents
- 1. Introduction
- 1.1. Research Scope
- 1.2. Market Segmentation
- 1.3. Research Objective
- 1.4. Definitions and Assumptions
- 2. Executive Summary
- 2.1. Market Snapshot
- 3. Market Dynamics
- 3.1. Market Drivers
- 3.2. Market Restrains
- 3.3. Market Trends
- 3.4. Market Opportunities
- 4. Market Factor Analysis
- 4.1. Porters Five Forces
- 4.1.1. Bargaining Power of Suppliers
- 4.1.2. Bargaining Power of Buyers
- 4.1.3. Threat of New Entrants
- 4.1.4. Threat of Substitutes
- 4.1.5. Competitive Rivalry
- 4.2. PESTEL analysis
- 4.3. BCG Analysis
- 4.3.1. Stars (High Growth, High Market Share)
- 4.3.2. Cash Cows (Low Growth, High Market Share)
- 4.3.3. Question Mark (High Growth, Low Market Share)
- 4.3.4. Dogs (Low Growth, Low Market Share)
- 4.4. Ansoff Matrix Analysis
- 4.5. Supply Chain Analysis
- 4.6. Regulatory Landscape
- 4.7. Current Market Potential and Opportunity Assessment (TAM–SAM–SOM Framework)
- 4.8. RAX Analyst Note
- 4.1. Porters Five Forces
- 5. Market Analysis, Insights and Forecast 2021-2033
- 5.1. Market Analysis, Insights and Forecast - by Product Type
- 5.1.1. Rings
- 5.1.2. Necklaces
- 5.1.3. Earrings
- 5.1.4. Bracelets
- 5.1.5. Chains and Pendants
- 5.1.6. Other Product Types
- 5.2. Market Analysis, Insights and Forecast - by Distribution Channel
- 5.2.1. Offline Retail Stores
- 5.2.2. Online Retail Stores
- 5.3. Market Analysis, Insights and Forecast - by Region
- 5.3.1. North America
- 5.3.2. Europe
- 5.3.3. Asia Pacific
- 5.3.4. South America
- 5.3.5. Middle East and Africa
- 5.1. Market Analysis, Insights and Forecast - by Product Type
- 6. Global Gems Industry Analysis, Insights and Forecast, 2021-2033
- 6.1. Market Analysis, Insights and Forecast - by Product Type
- 6.1.1. Rings
- 6.1.2. Necklaces
- 6.1.3. Earrings
- 6.1.4. Bracelets
- 6.1.5. Chains and Pendants
- 6.1.6. Other Product Types
- 6.2. Market Analysis, Insights and Forecast - by Distribution Channel
- 6.2.1. Offline Retail Stores
- 6.2.2. Online Retail Stores
- 6.1. Market Analysis, Insights and Forecast - by Product Type
- 7. North America Gems Industry Analysis, Insights and Forecast, 2020-2032
- 7.1. Market Analysis, Insights and Forecast - by Product Type
- 7.1.1. Rings
- 7.1.2. Necklaces
- 7.1.3. Earrings
- 7.1.4. Bracelets
- 7.1.5. Chains and Pendants
- 7.1.6. Other Product Types
- 7.2. Market Analysis, Insights and Forecast - by Distribution Channel
- 7.2.1. Offline Retail Stores
- 7.2.2. Online Retail Stores
- 7.1. Market Analysis, Insights and Forecast - by Product Type
- 8. Europe Gems Industry Analysis, Insights and Forecast, 2020-2032
- 8.1. Market Analysis, Insights and Forecast - by Product Type
- 8.1.1. Rings
- 8.1.2. Necklaces
- 8.1.3. Earrings
- 8.1.4. Bracelets
- 8.1.5. Chains and Pendants
- 8.1.6. Other Product Types
- 8.2. Market Analysis, Insights and Forecast - by Distribution Channel
- 8.2.1. Offline Retail Stores
- 8.2.2. Online Retail Stores
- 8.1. Market Analysis, Insights and Forecast - by Product Type
- 9. Asia Pacific Gems Industry Analysis, Insights and Forecast, 2020-2032
- 9.1. Market Analysis, Insights and Forecast - by Product Type
- 9.1.1. Rings
- 9.1.2. Necklaces
- 9.1.3. Earrings
- 9.1.4. Bracelets
- 9.1.5. Chains and Pendants
- 9.1.6. Other Product Types
- 9.2. Market Analysis, Insights and Forecast - by Distribution Channel
- 9.2.1. Offline Retail Stores
- 9.2.2. Online Retail Stores
- 9.1. Market Analysis, Insights and Forecast - by Product Type
- 10. South America Gems Industry Analysis, Insights and Forecast, 2020-2032
- 10.1. Market Analysis, Insights and Forecast - by Product Type
- 10.1.1. Rings
- 10.1.2. Necklaces
- 10.1.3. Earrings
- 10.1.4. Bracelets
- 10.1.5. Chains and Pendants
- 10.1.6. Other Product Types
- 10.2. Market Analysis, Insights and Forecast - by Distribution Channel
- 10.2.1. Offline Retail Stores
- 10.2.2. Online Retail Stores
- 10.1. Market Analysis, Insights and Forecast - by Product Type
- 11. Middle East and Africa Gems Industry Analysis, Insights and Forecast, 2020-2032
- 11.1. Market Analysis, Insights and Forecast - by Product Type
- 11.1.1. Rings
- 11.1.2. Necklaces
- 11.1.3. Earrings
- 11.1.4. Bracelets
- 11.1.5. Chains and Pendants
- 11.1.6. Other Product Types
- 11.2. Market Analysis, Insights and Forecast - by Distribution Channel
- 11.2.1. Offline Retail Stores
- 11.2.2. Online Retail Stores
- 11.1. Market Analysis, Insights and Forecast - by Product Type
- 12. Competitive Analysis
- 12.1. Company Profiles
- 12.1.1 The Swatch Group AG
- 12.1.1.1. Company Overview
- 12.1.1.2. Products
- 12.1.1.3. Company Financials
- 12.1.1.4. SWOT Analysis
- 12.1.2 PANDORA JEWELRY LLC
- 12.1.2.1. Company Overview
- 12.1.2.2. Products
- 12.1.2.3. Company Financials
- 12.1.2.4. SWOT Analysis
- 12.1.3 De Beers Jewellers US Inc
- 12.1.3.1. Company Overview
- 12.1.3.2. Products
- 12.1.3.3. Company Financials
- 12.1.3.4. SWOT Analysis
- 12.1.4 LVMH Group
- 12.1.4.1. Company Overview
- 12.1.4.2. Products
- 12.1.4.3. Company Financials
- 12.1.4.4. SWOT Analysis
- 12.1.5 Chow Tai Fook Jewellery Company Limited*List Not Exhaustive
- 12.1.5.1. Company Overview
- 12.1.5.2. Products
- 12.1.5.3. Company Financials
- 12.1.5.4. SWOT Analysis
- 12.1.6 Richemont SA
- 12.1.6.1. Company Overview
- 12.1.6.2. Products
- 12.1.6.3. Company Financials
- 12.1.6.4. SWOT Analysis
- 12.1.7 Swarovski Crystal Online AG
- 12.1.7.1. Company Overview
- 12.1.7.2. Products
- 12.1.7.3. Company Financials
- 12.1.7.4. SWOT Analysis
- 12.1.8 Chow Tai Fook Jewelry Company Limited
- 12.1.8.1. Company Overview
- 12.1.8.2. Products
- 12.1.8.3. Company Financials
- 12.1.8.4. SWOT Analysis
- 12.1.9 Tata Sons Private Ltd
- 12.1.9.1. Company Overview
- 12.1.9.2. Products
- 12.1.9.3. Company Financials
- 12.1.9.4. SWOT Analysis
- 12.1.10 Signet Jewelers
- 12.1.10.1. Company Overview
- 12.1.10.2. Products
- 12.1.10.3. Company Financials
- 12.1.10.4. SWOT Analysis
- 12.1.1 The Swatch Group AG
- 12.2. Market Entropy
- 12.2.1 Company's Key Areas Served
- 12.2.2 Recent Developments
- 12.3. Company Market Share Analysis 2025
- 12.3.1 Top 5 Companies Market Share Analysis
- 12.3.2 Top 3 Companies Market Share Analysis
- 12.4. List of Potential Customers
- 13. Research Methodology
List of Figures
- Figure 1: Global Gems Industry Revenue Breakdown (billion, %) by Region 2025 & 2033
- Figure 2: North America Gems Industry Revenue (billion), by Product Type 2025 & 2033
- Figure 3: North America Gems Industry Revenue Share (%), by Product Type 2025 & 2033
- Figure 4: North America Gems Industry Revenue (billion), by Distribution Channel 2025 & 2033
- Figure 5: North America Gems Industry Revenue Share (%), by Distribution Channel 2025 & 2033
- Figure 6: North America Gems Industry Revenue (billion), by Country 2025 & 2033
- Figure 7: North America Gems Industry Revenue Share (%), by Country 2025 & 2033
- Figure 8: Europe Gems Industry Revenue (billion), by Product Type 2025 & 2033
- Figure 9: Europe Gems Industry Revenue Share (%), by Product Type 2025 & 2033
- Figure 10: Europe Gems Industry Revenue (billion), by Distribution Channel 2025 & 2033
- Figure 11: Europe Gems Industry Revenue Share (%), by Distribution Channel 2025 & 2033
- Figure 12: Europe Gems Industry Revenue (billion), by Country 2025 & 2033
- Figure 13: Europe Gems Industry Revenue Share (%), by Country 2025 & 2033
- Figure 14: Asia Pacific Gems Industry Revenue (billion), by Product Type 2025 & 2033
- Figure 15: Asia Pacific Gems Industry Revenue Share (%), by Product Type 2025 & 2033
- Figure 16: Asia Pacific Gems Industry Revenue (billion), by Distribution Channel 2025 & 2033
- Figure 17: Asia Pacific Gems Industry Revenue Share (%), by Distribution Channel 2025 & 2033
- Figure 18: Asia Pacific Gems Industry Revenue (billion), by Country 2025 & 2033
- Figure 19: Asia Pacific Gems Industry Revenue Share (%), by Country 2025 & 2033
- Figure 20: South America Gems Industry Revenue (billion), by Product Type 2025 & 2033
- Figure 21: South America Gems Industry Revenue Share (%), by Product Type 2025 & 2033
- Figure 22: South America Gems Industry Revenue (billion), by Distribution Channel 2025 & 2033
- Figure 23: South America Gems Industry Revenue Share (%), by Distribution Channel 2025 & 2033
- Figure 24: South America Gems Industry Revenue (billion), by Country 2025 & 2033
- Figure 25: South America Gems Industry Revenue Share (%), by Country 2025 & 2033
- Figure 26: Middle East and Africa Gems Industry Revenue (billion), by Product Type 2025 & 2033
- Figure 27: Middle East and Africa Gems Industry Revenue Share (%), by Product Type 2025 & 2033
- Figure 28: Middle East and Africa Gems Industry Revenue (billion), by Distribution Channel 2025 & 2033
- Figure 29: Middle East and Africa Gems Industry Revenue Share (%), by Distribution Channel 2025 & 2033
- Figure 30: Middle East and Africa Gems Industry Revenue (billion), by Country 2025 & 2033
- Figure 31: Middle East and Africa Gems Industry Revenue Share (%), by Country 2025 & 2033
List of Tables
- Table 1: Global Gems Industry Revenue billion Forecast, by Product Type 2020 & 2033
- Table 2: Global Gems Industry Revenue billion Forecast, by Distribution Channel 2020 & 2033
- Table 3: Global Gems Industry Revenue billion Forecast, by Region 2020 & 2033
- Table 4: Global Gems Industry Revenue billion Forecast, by Product Type 2020 & 2033
- Table 5: Global Gems Industry Revenue billion Forecast, by Distribution Channel 2020 & 2033
- Table 6: Global Gems Industry Revenue billion Forecast, by Country 2020 & 2033
- Table 7: United States Gems Industry Revenue (billion) Forecast, by Application 2020 & 2033
- Table 8: Canada Gems Industry Revenue (billion) Forecast, by Application 2020 & 2033
- Table 9: Mexico Gems Industry Revenue (billion) Forecast, by Application 2020 & 2033
- Table 10: Rest of North America Gems Industry Revenue (billion) Forecast, by Application 2020 & 2033
- Table 11: Global Gems Industry Revenue billion Forecast, by Product Type 2020 & 2033
- Table 12: Global Gems Industry Revenue billion Forecast, by Distribution Channel 2020 & 2033
- Table 13: Global Gems Industry Revenue billion Forecast, by Country 2020 & 2033
- Table 14: Spain Gems Industry Revenue (billion) Forecast, by Application 2020 & 2033
- Table 15: United Kingdom Gems Industry Revenue (billion) Forecast, by Application 2020 & 2033
- Table 16: France Gems Industry Revenue (billion) Forecast, by Application 2020 & 2033
- Table 17: Germany Gems Industry Revenue (billion) Forecast, by Application 2020 & 2033
- Table 18: Russia Gems Industry Revenue (billion) Forecast, by Application 2020 & 2033
- Table 19: Italy Gems Industry Revenue (billion) Forecast, by Application 2020 & 2033
- Table 20: Rest of Europe Gems Industry Revenue (billion) Forecast, by Application 2020 & 2033
- Table 21: Global Gems Industry Revenue billion Forecast, by Product Type 2020 & 2033
- Table 22: Global Gems Industry Revenue billion Forecast, by Distribution Channel 2020 & 2033
- Table 23: Global Gems Industry Revenue billion Forecast, by Country 2020 & 2033
- Table 24: China Gems Industry Revenue (billion) Forecast, by Application 2020 & 2033
- Table 25: Japan Gems Industry Revenue (billion) Forecast, by Application 2020 & 2033
- Table 26: India Gems Industry Revenue (billion) Forecast, by Application 2020 & 2033
- Table 27: Australia Gems Industry Revenue (billion) Forecast, by Application 2020 & 2033
- Table 28: Rest of Asia Pacific Gems Industry Revenue (billion) Forecast, by Application 2020 & 2033
- Table 29: Global Gems Industry Revenue billion Forecast, by Product Type 2020 & 2033
- Table 30: Global Gems Industry Revenue billion Forecast, by Distribution Channel 2020 & 2033
- Table 31: Global Gems Industry Revenue billion Forecast, by Country 2020 & 2033
- Table 32: Brazil Gems Industry Revenue (billion) Forecast, by Application 2020 & 2033
- Table 33: Argentina Gems Industry Revenue (billion) Forecast, by Application 2020 & 2033
- Table 34: Rest of South America Gems Industry Revenue (billion) Forecast, by Application 2020 & 2033
- Table 35: Global Gems Industry Revenue billion Forecast, by Product Type 2020 & 2033
- Table 36: Global Gems Industry Revenue billion Forecast, by Distribution Channel 2020 & 2033
- Table 37: Global Gems Industry Revenue billion Forecast, by Country 2020 & 2033
- Table 38: South Africa Gems Industry Revenue (billion) Forecast, by Application 2020 & 2033
- Table 39: United Arab Emirates Gems Industry Revenue (billion) Forecast, by Application 2020 & 2033
- Table 40: Rest of Middle East and Africa Gems Industry Revenue (billion) Forecast, by Application 2020 & 2033
Frequently Asked Questions
1. What is the projected Compound Annual Growth Rate (CAGR) of the Gems Industry?
The projected CAGR is approximately 6.3%.
2. Which companies are prominent players in the Gems Industry?
Key companies in the market include The Swatch Group AG, PANDORA JEWELRY LLC, De Beers Jewellers US Inc, LVMH Group, Chow Tai Fook Jewellery Company Limited*List Not Exhaustive, Richemont SA, Swarovski Crystal Online AG, Chow Tai Fook Jewelry Company Limited, Tata Sons Private Ltd, Signet Jewelers.
3. What are the main segments of the Gems Industry?
The market segments include Product Type, Distribution Channel.
4. Can you provide details about the market size?
The market size is estimated to be USD 12.7 billion as of 2022.
5. What are some drivers contributing to market growth?
Product Innovations to Drive Demand for Watches; Rising Demand for Premium Fashion Items.
6. What are the notable trends driving market growth?
Rising Demand for Gems & Jewellery Owing to the Emerging Middle Class.
7. Are there any restraints impacting market growth?
Presence of Counterfeit Products.
8. Can you provide examples of recent developments in the market?
September 2022: As an ode to the Chola Dynasty, which is considered a golden age of Indian history, Tanishq launched its new exclusive collection The Chola, which is an ode to the dynasty.
9. What pricing options are available for accessing the report?
Pricing options include single-user, multi-user, and enterprise licenses priced at USD 4750, USD 5250, and USD 8750 respectively.
10. Is the market size provided in terms of value or volume?
The market size is provided in terms of value, measured in billion.
11. Are there any specific market keywords associated with the report?
Yes, the market keyword associated with the report is "Gems Industry," which aids in identifying and referencing the specific market segment covered.
12. How do I determine which pricing option suits my needs best?
The pricing options vary based on user requirements and access needs. Individual users may opt for single-user licenses, while businesses requiring broader access may choose multi-user or enterprise licenses for cost-effective access to the report.
13. Are there any additional resources or data provided in the Gems Industry report?
While the report offers comprehensive insights, it's advisable to review the specific contents or supplementary materials provided to ascertain if additional resources or data are available.
14. How can I stay updated on further developments or reports in the Gems Industry?
To stay informed about further developments, trends, and reports in the Gems Industry, consider subscribing to industry newsletters, following relevant companies and organizations, or regularly checking reputable industry news sources and publications.
Methodology
Step 1 - Identification of Relevant Samples Size from Population Database


Step 2 - Approaches for Defining Global Market Size (Value, Volume* & Price*)

Note*: In applicable scenarios
Step 3 - Data Sources
Primary Research
- Web Analytics
- Survey Reports
- Research Institute
- Latest Research Reports
- Opinion Leaders
Secondary Research
- Annual Reports
- White Paper
- Latest Press Release
- Industry Association
- Paid Database
- Investor Presentations

Step 4 - Data Triangulation
Involves using different sources of information in order to increase the validity of a study
These sources are likely to be stakeholders in a program - participants, other researchers, program staff, other community members, and so on.
Then we put all data in single framework & apply various statistical tools to find out the dynamic on the market.
During the analysis stage, feedback from the stakeholder groups would be compared to determine areas of agreement as well as areas of divergence