

Key Insights
The Geostationary Earth Orbit (GEO) satellite market is experiencing robust growth, driven by increasing demand for high-throughput communication services, advanced Earth observation capabilities, and precise navigation systems. A compound annual growth rate (CAGR) of 4.96% from 2019-2024 suggests a steadily expanding market. This growth is fueled by several key factors. The proliferation of high-bandwidth applications like 4K video streaming and the Internet of Things (IoT) necessitates greater satellite capacity, boosting demand for GEO satellites. Furthermore, advancements in electric propulsion technologies are enabling the launch of larger, more powerful satellites at a lower cost. Government initiatives focused on national security and environmental monitoring also contribute significantly to market expansion. The segmentation reveals a strong focus on communication applications, with commercial end-users leading the demand. Larger satellite mass segments (above 1000kg) are likely experiencing higher growth due to their increased capacity, although the market share across various mass categories requires further detailed analysis.
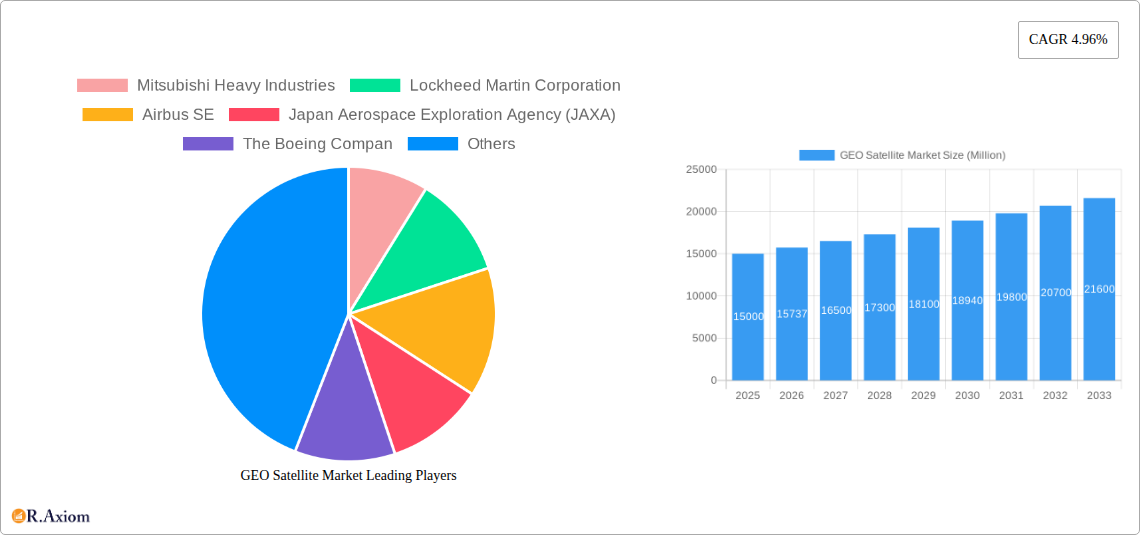
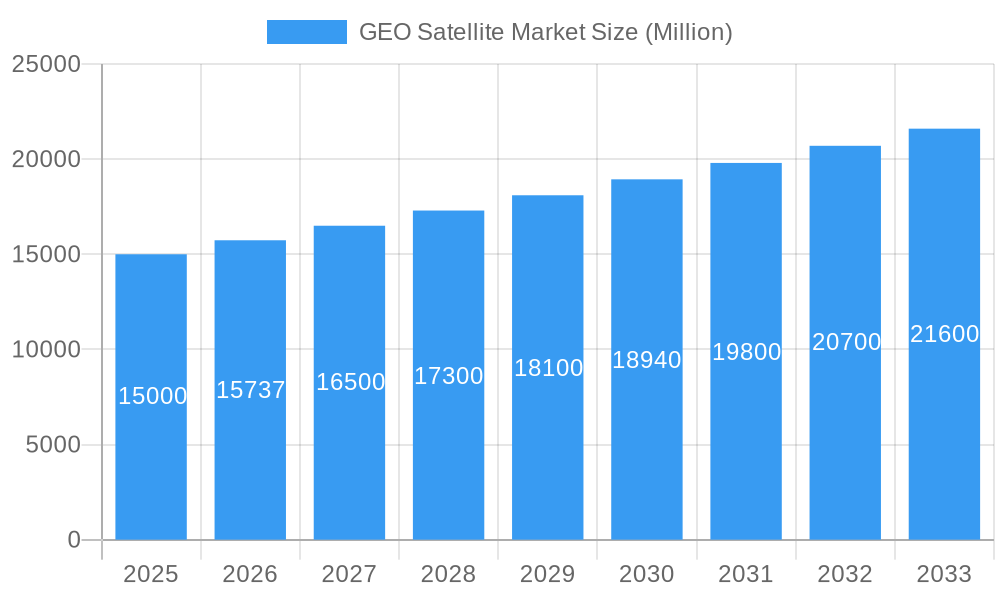
GEO Satellite Market Market Size (In Billion)
While the market presents significant opportunities, challenges remain. The high cost of launching and operating GEO satellites, coupled with the increasing complexity of satellite technology, could act as restraints. Competition among established players like Lockheed Martin, Airbus, and Boeing, along with emerging players from countries like India and China, intensifies market dynamics. However, technological advancements and strategic partnerships are anticipated to mitigate these challenges. The forecast period (2025-2033) is expected to witness continued market expansion, with a probable shift towards more efficient and sustainable satellite designs driven by growing environmental consciousness and governmental regulations. Estimating the overall market size in 2025 to be around $15 billion (a reasonable assumption given the CAGR and market trends) and projecting based on the 4.96% CAGR, significant market growth can be anticipated for the coming years.
GEO Satellite Market Company Market Share
This in-depth report provides a comprehensive analysis of the GEO Satellite Market, offering invaluable insights for industry stakeholders, investors, and strategic decision-makers. With a focus on market trends, competitive landscapes, and future growth projections, this report covers the period from 2019 to 2033, with 2025 as the base year and estimated year. The forecast period spans from 2025 to 2033, while the historical period encompasses 2019-2024. The report segments the market by application, satellite mass, end-user, and propulsion technology, offering a granular understanding of this dynamic sector.
GEO Satellite Market Market Concentration & Innovation
The GEO satellite market is characterized by a moderately concentrated landscape, dominated by a handful of major players like Lockheed Martin, Boeing, Airbus, and Mitsubishi Heavy Industries. These established entities collectively hold a significant portion of the global market share, leveraging their extensive experience, advanced technological capabilities, and robust supply chains. However, the market is also witnessing dynamic shifts with increased participation from agile emerging players, particularly in the development of smaller, more cost-effective, and purpose-built satellites. Innovation remains a paramount driver, propelled by breakthroughs in propulsion technology, with electric propulsion systems gaining substantial traction due to their superior fuel efficiency and extended operational lifespans. Advancements in satellite design are leading to lighter, more powerful, and resilient platforms, while the increasing adoption of Software-Defined Radios (SDRs) is providing unparalleled flexibility and adaptability in response to evolving communication needs and mission requirements.
Regulatory frameworks, which exhibit considerable variation across different geographical regions, play a crucial role in shaping market dynamics. Stringent licensing requirements and complex spectrum allocation processes can significantly influence market entry strategies, investment decisions, and the pace of expansion for both established and new entrants. The presence of advanced product substitutes, such as sophisticated terrestrial communication networks and alternative navigation systems, continues to exert competitive pressure on market growth, necessitating continuous technological innovation and service differentiation to maintain a competitive edge. End-user trends are decidedly shifting towards an insatiable demand for High-Throughput Satellites (HTS) that offer increased bandwidth, lower latency, and significantly improved performance metrics. Mergers and Acquisitions (M&A) activities are prevalent, reflecting a strategic pursuit of technological synergies, market consolidation, and the strengthening of competitive positioning. These strategic moves are essential for players aiming to expand their service portfolios, geographical reach, and technological prowess.
GEO Satellite Market Industry Trends & Insights
The GEO satellite market is experiencing robust growth, projected to reach xx Million USD by 2033, with a Compound Annual Growth Rate (CAGR) of xx% during the forecast period (2025-2033). This growth is largely driven by the rising demand for high-bandwidth communication services, particularly in emerging economies, increasing government investment in space exploration and national security initiatives, and growing adoption of satellite-based navigation and earth observation applications. Technological disruptions, such as the development of miniaturized satellites and advanced propulsion systems, are reducing the cost of launching and operating GEO satellites. Consumer preferences are increasingly shifting towards seamless connectivity and reliable data transmission, fueling the demand for advanced GEO satellite technologies. Competitive dynamics are intense, with major players vying for market share through technological innovation, strategic partnerships, and M&A activities. Market penetration is increasing, particularly in sectors like broadband communication and government applications, with a significant portion of the untapped potential still available in developing nations. The industry is undergoing a significant transformation, shifting from traditional government-dominated procurement towards a more commercially-driven model.
Dominant Markets & Segments in GEO Satellite Market
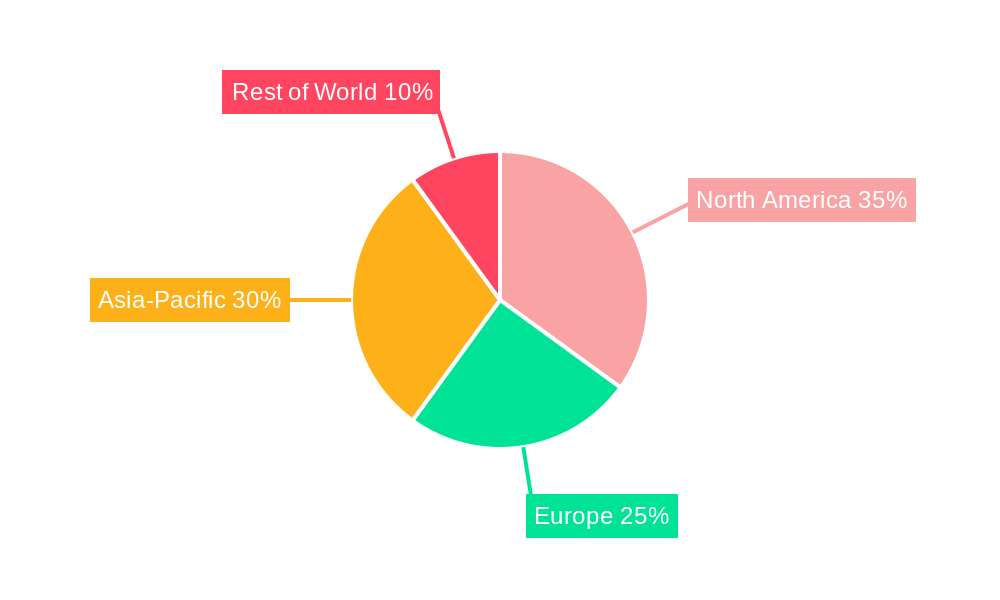
Dominant Regions and Countries: North America, with a pronounced leadership from the United States, currently commands the largest market share in the GEO satellite sector. This dominance is largely attributed to substantial government spending on defense, intelligence, and national security applications, coupled with a highly developed and innovative commercial space ecosystem. Europe and the Asia-Pacific region represent other significant and rapidly growing markets, fueled by increasing investments in communication infrastructure, broadcasting, and emerging space programs in economies like China, India, and Japan.
Dominant Segments:
- Application: Communication services unequivocally dominate the GEO satellite market, forming the largest segment. The ever-growing demand for seamless broadband internet access, high-definition broadcasting, and robust telecommunications solutions across diverse industries and consumer segments is the primary catalyst.
- Satellite Mass: While the 500-1000kg segment continues to hold a substantial share due to its established balance of capability and cost-effectiveness for many mission profiles, the 100-500kg segment is experiencing considerable and accelerated growth. This expansion is driven by advancements in miniaturization, enabling more agile and cost-efficient satellite deployments for specialized applications.
- End-User: Commercial applications constitute a significant and expanding market share, propelled by the escalating demand from the telecommunications, broadcasting, media, and earth observation sectors. Nevertheless, the military and government segment is also demonstrating robust and consistent growth, driven by national security imperatives and the need for resilient communication and surveillance capabilities.
- Propulsion Tech: Gas-based propulsion technology currently maintains a leading market share, owing to its well-established reliability and proven performance characteristics. However, electric propulsion systems are rapidly gaining widespread adoption due to their demonstrably superior fuel efficiency, reduced launch mass, and significant long-term cost savings, making them increasingly attractive for a variety of missions.
Key Drivers:
- Substantial and consistent government funding for ambitious space programs, advanced research, and critical defense and intelligence applications.
- The escalating global demand for high-bandwidth, reliable communication services, essential for an increasingly connected world.
- The dynamic rise of the "New Space" sector, characterized by its innovative approach to developing smaller, more cost-effective, and rapidly deployable satellite solutions.
- Continuous technological advancements in satellite design, materials, and systems integration, leading to enhanced performance, greater reliability, and expanded mission capabilities.
- Growing strategic investments in the development and enhancement of ground infrastructure, including ground stations, network operations centers, and data processing facilities to support sophisticated satellite operations.
GEO Satellite Market Product Developments
Recent product innovations focus on high-throughput satellites (HTS) with advanced technologies such as laser communication and phased array antennas, improving bandwidth and data transmission speeds. These new generation satellites offer enhanced capabilities, improved efficiency, and cost reductions, thereby expanding applications and attracting new market segments. The increasing miniaturization of satellites is leading to more cost-effective solutions and easier deployment, enhancing the appeal of GEO satellites for a wider range of applications.
Report Scope & Segmentation Analysis
The report segments the GEO Satellite market by application (Communication, Earth Observation, Navigation, Space Observation, Others), satellite mass (10-100kg, 100-500kg, 500-1000kg, above 1000kg), end-user (Commercial, Military & Government, Other), and propulsion technology (Electric, Gas-based, Liquid Fuel). Each segment is comprehensively analyzed, providing market size estimations, growth projections, and competitive dynamics for the forecast period. The Communication segment exhibits the fastest growth, propelled by the expansion of global internet access and the demand for high-bandwidth services. The demand for larger satellites (above 1000kg) remains strong for high-capacity applications while the demand for smaller satellites is rapidly increasing due to reduced costs and improved technology. The Commercial segment is expected to drive significant growth due to increasing private sector investment.
Key Drivers of GEO Satellite Market Growth
The GEO satellite market's expansion is underpinned by a confluence of compelling factors. Foremost among these is the escalating demand for high-bandwidth communication services, particularly critical for bridging the digital divide in remote geographical areas and facilitating connectivity in developing nations. Government initiatives aimed at bolstering national security, enhancing space exploration capabilities, and establishing robust communication networks are also pivotal drivers. Technological advancements, notably the trend towards satellite miniaturization and the increasing adoption of energy-efficient electric propulsion systems, are significantly reducing deployment costs and optimizing the operational efficiency of GEO satellites. Furthermore, evolving and more favorable regulatory policies in select regions are actively reducing barriers to entry and fostering a more conducive environment for market growth and innovation.
Challenges in the GEO Satellite Market Sector
The GEO satellite market faces challenges such as high initial investment costs for satellite development and launch, complex regulatory frameworks varying by region, and potential disruptions to the supply chain, impacting production timelines and costs. Intense competition among established players and new entrants necessitates constant innovation and cost-effective solutions to maintain a competitive edge.
Emerging Opportunities in GEO Satellite Market
The GEO satellite market is poised to capitalize on several nascent and rapidly developing opportunities. These include the burgeoning demand for reliable and widespread Internet of Things (IoT) applications, the strategic potential of advanced satellite constellations to offer comprehensive global broadband coverage, and the expanding applications in critical areas such as earth observation for climate monitoring, precise disaster management response, and detailed environmental surveillance. Emerging markets in developing economies, often characterized by limited terrestrial infrastructure, present significant untapped growth potential for satellite-based services. The increasing need for secure and resilient communication solutions for various industries further amplifies these opportunities.
Leading Players in the GEO Satellite Market Market
- Mitsubishi Heavy Industries
- Lockheed Martin Corporation (Lockheed Martin)
- Airbus SE (Airbus)
- Japan Aerospace Exploration Agency (JAXA)
- The Boeing Company (Boeing)
- China Aerospace Science and Technology Corporation (CASC)
- Thales (Thales)
- Maxar Technologies Inc (Maxar Technologies)
- Northrop Grumman Corporation (Northrop Grumman)
- Indian Space Research Organisation (ISRO)
Key Developments in GEO Satellite Market Industry
- February 2023: China's successful launch of the Zhongxing-26 communications satellite, widely believed to be for advanced military applications, underscores the growing strategic importance of GEO satellites in bolstering national security capabilities and command-and-control infrastructure.
- January 2023: Airbus secured a significant contract from Inmarsat to construct a state-of-the-art geostationary telecommunications satellite. This deal highlights the persistent and robust demand for high-capacity, high-performance communication satellites essential for global connectivity.
- December 2022: Airbus achieved a critical milestone by completing the System Critical Design Review for the EGNOS V3 satellite navigation system. This advancement signals progress in sophisticated navigation technology and a heightened focus on enhancing cybersecurity resilience within critical space infrastructure.
Strategic Outlook for GEO Satellite Market Market
The GEO satellite market is poised for significant growth, driven by increasing demand for high-bandwidth connectivity, government investments in space programs, and advancements in satellite technologies. The rising adoption of miniaturized satellites and electric propulsion systems is expected to lower launch costs and boost market expansion. The market's future hinges on continuous technological innovation, effective regulatory frameworks, and strategic collaborations among industry players. The emergence of new space companies and increased private sector investment is expected to further shape market dynamics, creating both opportunities and challenges for established players.
GEO Satellite Market Segmentation
-
1. Application
- 1.1. Communication
- 1.2. Earth Observation
- 1.3. Navigation
- 1.4. Space Observation
- 1.5. Others
-
2. Satellite Mass
- 2.1. 10-100kg
- 2.2. 100-500kg
- 2.3. 500-1000kg
- 2.4. above 1000kg
-
3. End User
- 3.1. Commercial
- 3.2. Military & Government
- 3.3. Other
-
4. Propulsion Tech
- 4.1. Electric
- 4.2. Gas based
- 4.3. Liquid Fuel
GEO Satellite Market Segmentation By Geography
-
1. North America
- 1.1. United States
- 1.2. Canada
- 1.3. Mexico
-
2. South America
- 2.1. Brazil
- 2.2. Argentina
- 2.3. Rest of South America
-
3. Europe
- 3.1. United Kingdom
- 3.2. Germany
- 3.3. France
- 3.4. Italy
- 3.5. Spain
- 3.6. Russia
- 3.7. Benelux
- 3.8. Nordics
- 3.9. Rest of Europe
-
4. Middle East & Africa
- 4.1. Turkey
- 4.2. Israel
- 4.3. GCC
- 4.4. North Africa
- 4.5. South Africa
- 4.6. Rest of Middle East & Africa
-
5. Asia Pacific
- 5.1. China
- 5.2. India
- 5.3. Japan
- 5.4. South Korea
- 5.5. ASEAN
- 5.6. Oceania
- 5.7. Rest of Asia Pacific
GEO Satellite Market Regional Market Share
Geographic Coverage of GEO Satellite Market
GEO Satellite Market REPORT HIGHLIGHTS
| Aspects | Details |
|---|---|
| Study Period | 2020-2034 |
| Base Year | 2025 |
| Estimated Year | 2026 |
| Forecast Period | 2026-2034 |
| Historical Period | 2020-2025 |
| Growth Rate | CAGR of 18.1% from 2020-2034 |
| Segmentation |
|
Table of Contents
- 1. Introduction
- 1.1. Research Scope
- 1.2. Market Segmentation
- 1.3. Research Objective
- 1.4. Definitions and Assumptions
- 2. Executive Summary
- 2.1. Market Snapshot
- 3. Market Dynamics
- 3.1. Market Drivers
- 3.2. Market Restrains
- 3.3. Market Trends
- 3.4. Market Opportunities
- 4. Market Factor Analysis
- 4.1. Porters Five Forces
- 4.1.1. Bargaining Power of Suppliers
- 4.1.2. Bargaining Power of Buyers
- 4.1.3. Threat of New Entrants
- 4.1.4. Threat of Substitutes
- 4.1.5. Competitive Rivalry
- 4.2. PESTEL analysis
- 4.3. BCG Analysis
- 4.3.1. Stars (High Growth, High Market Share)
- 4.3.2. Cash Cows (Low Growth, High Market Share)
- 4.3.3. Question Mark (High Growth, Low Market Share)
- 4.3.4. Dogs (Low Growth, Low Market Share)
- 4.4. Ansoff Matrix Analysis
- 4.5. Supply Chain Analysis
- 4.6. Regulatory Landscape
- 4.7. Current Market Potential and Opportunity Assessment (TAM–SAM–SOM Framework)
- 4.8. RAX Analyst Note
- 4.1. Porters Five Forces
- 5. Market Analysis, Insights and Forecast 2021-2033
- 5.1. Market Analysis, Insights and Forecast - by Application
- 5.1.1. Communication
- 5.1.2. Earth Observation
- 5.1.3. Navigation
- 5.1.4. Space Observation
- 5.1.5. Others
- 5.2. Market Analysis, Insights and Forecast - by Satellite Mass
- 5.2.1. 10-100kg
- 5.2.2. 100-500kg
- 5.2.3. 500-1000kg
- 5.2.4. above 1000kg
- 5.3. Market Analysis, Insights and Forecast - by End User
- 5.3.1. Commercial
- 5.3.2. Military & Government
- 5.3.3. Other
- 5.4. Market Analysis, Insights and Forecast - by Propulsion Tech
- 5.4.1. Electric
- 5.4.2. Gas based
- 5.4.3. Liquid Fuel
- 5.5. Market Analysis, Insights and Forecast - by Region
- 5.5.1. North America
- 5.5.2. South America
- 5.5.3. Europe
- 5.5.4. Middle East & Africa
- 5.5.5. Asia Pacific
- 5.1. Market Analysis, Insights and Forecast - by Application
- 6. Global GEO Satellite Market Analysis, Insights and Forecast, 2021-2033
- 6.1. Market Analysis, Insights and Forecast - by Application
- 6.1.1. Communication
- 6.1.2. Earth Observation
- 6.1.3. Navigation
- 6.1.4. Space Observation
- 6.1.5. Others
- 6.2. Market Analysis, Insights and Forecast - by Satellite Mass
- 6.2.1. 10-100kg
- 6.2.2. 100-500kg
- 6.2.3. 500-1000kg
- 6.2.4. above 1000kg
- 6.3. Market Analysis, Insights and Forecast - by End User
- 6.3.1. Commercial
- 6.3.2. Military & Government
- 6.3.3. Other
- 6.4. Market Analysis, Insights and Forecast - by Propulsion Tech
- 6.4.1. Electric
- 6.4.2. Gas based
- 6.4.3. Liquid Fuel
- 6.1. Market Analysis, Insights and Forecast - by Application
- 7. North America GEO Satellite Market Analysis, Insights and Forecast, 2020-2032
- 7.1. Market Analysis, Insights and Forecast - by Application
- 7.1.1. Communication
- 7.1.2. Earth Observation
- 7.1.3. Navigation
- 7.1.4. Space Observation
- 7.1.5. Others
- 7.2. Market Analysis, Insights and Forecast - by Satellite Mass
- 7.2.1. 10-100kg
- 7.2.2. 100-500kg
- 7.2.3. 500-1000kg
- 7.2.4. above 1000kg
- 7.3. Market Analysis, Insights and Forecast - by End User
- 7.3.1. Commercial
- 7.3.2. Military & Government
- 7.3.3. Other
- 7.4. Market Analysis, Insights and Forecast - by Propulsion Tech
- 7.4.1. Electric
- 7.4.2. Gas based
- 7.4.3. Liquid Fuel
- 7.1. Market Analysis, Insights and Forecast - by Application
- 8. South America GEO Satellite Market Analysis, Insights and Forecast, 2020-2032
- 8.1. Market Analysis, Insights and Forecast - by Application
- 8.1.1. Communication
- 8.1.2. Earth Observation
- 8.1.3. Navigation
- 8.1.4. Space Observation
- 8.1.5. Others
- 8.2. Market Analysis, Insights and Forecast - by Satellite Mass
- 8.2.1. 10-100kg
- 8.2.2. 100-500kg
- 8.2.3. 500-1000kg
- 8.2.4. above 1000kg
- 8.3. Market Analysis, Insights and Forecast - by End User
- 8.3.1. Commercial
- 8.3.2. Military & Government
- 8.3.3. Other
- 8.4. Market Analysis, Insights and Forecast - by Propulsion Tech
- 8.4.1. Electric
- 8.4.2. Gas based
- 8.4.3. Liquid Fuel
- 8.1. Market Analysis, Insights and Forecast - by Application
- 9. Europe GEO Satellite Market Analysis, Insights and Forecast, 2020-2032
- 9.1. Market Analysis, Insights and Forecast - by Application
- 9.1.1. Communication
- 9.1.2. Earth Observation
- 9.1.3. Navigation
- 9.1.4. Space Observation
- 9.1.5. Others
- 9.2. Market Analysis, Insights and Forecast - by Satellite Mass
- 9.2.1. 10-100kg
- 9.2.2. 100-500kg
- 9.2.3. 500-1000kg
- 9.2.4. above 1000kg
- 9.3. Market Analysis, Insights and Forecast - by End User
- 9.3.1. Commercial
- 9.3.2. Military & Government
- 9.3.3. Other
- 9.4. Market Analysis, Insights and Forecast - by Propulsion Tech
- 9.4.1. Electric
- 9.4.2. Gas based
- 9.4.3. Liquid Fuel
- 9.1. Market Analysis, Insights and Forecast - by Application
- 10. Middle East & Africa GEO Satellite Market Analysis, Insights and Forecast, 2020-2032
- 10.1. Market Analysis, Insights and Forecast - by Application
- 10.1.1. Communication
- 10.1.2. Earth Observation
- 10.1.3. Navigation
- 10.1.4. Space Observation
- 10.1.5. Others
- 10.2. Market Analysis, Insights and Forecast - by Satellite Mass
- 10.2.1. 10-100kg
- 10.2.2. 100-500kg
- 10.2.3. 500-1000kg
- 10.2.4. above 1000kg
- 10.3. Market Analysis, Insights and Forecast - by End User
- 10.3.1. Commercial
- 10.3.2. Military & Government
- 10.3.3. Other
- 10.4. Market Analysis, Insights and Forecast - by Propulsion Tech
- 10.4.1. Electric
- 10.4.2. Gas based
- 10.4.3. Liquid Fuel
- 10.1. Market Analysis, Insights and Forecast - by Application
- 11. Asia Pacific GEO Satellite Market Analysis, Insights and Forecast, 2020-2032
- 11.1. Market Analysis, Insights and Forecast - by Application
- 11.1.1. Communication
- 11.1.2. Earth Observation
- 11.1.3. Navigation
- 11.1.4. Space Observation
- 11.1.5. Others
- 11.2. Market Analysis, Insights and Forecast - by Satellite Mass
- 11.2.1. 10-100kg
- 11.2.2. 100-500kg
- 11.2.3. 500-1000kg
- 11.2.4. above 1000kg
- 11.3. Market Analysis, Insights and Forecast - by End User
- 11.3.1. Commercial
- 11.3.2. Military & Government
- 11.3.3. Other
- 11.4. Market Analysis, Insights and Forecast - by Propulsion Tech
- 11.4.1. Electric
- 11.4.2. Gas based
- 11.4.3. Liquid Fuel
- 11.1. Market Analysis, Insights and Forecast - by Application
- 12. Competitive Analysis
- 12.1. Company Profiles
- 12.1.1 Mitsubishi Heavy Industries
- 12.1.1.1. Company Overview
- 12.1.1.2. Products
- 12.1.1.3. Company Financials
- 12.1.1.4. SWOT Analysis
- 12.1.2 Lockheed Martin Corporation
- 12.1.2.1. Company Overview
- 12.1.2.2. Products
- 12.1.2.3. Company Financials
- 12.1.2.4. SWOT Analysis
- 12.1.3 Airbus SE
- 12.1.3.1. Company Overview
- 12.1.3.2. Products
- 12.1.3.3. Company Financials
- 12.1.3.4. SWOT Analysis
- 12.1.4 Japan Aerospace Exploration Agency (JAXA)
- 12.1.4.1. Company Overview
- 12.1.4.2. Products
- 12.1.4.3. Company Financials
- 12.1.4.4. SWOT Analysis
- 12.1.5 The Boeing Compan
- 12.1.5.1. Company Overview
- 12.1.5.2. Products
- 12.1.5.3. Company Financials
- 12.1.5.4. SWOT Analysis
- 12.1.6 China Aerospace Science and Technology Corporation (CASC)
- 12.1.6.1. Company Overview
- 12.1.6.2. Products
- 12.1.6.3. Company Financials
- 12.1.6.4. SWOT Analysis
- 12.1.7 Thales
- 12.1.7.1. Company Overview
- 12.1.7.2. Products
- 12.1.7.3. Company Financials
- 12.1.7.4. SWOT Analysis
- 12.1.8 Maxar Technologies Inc
- 12.1.8.1. Company Overview
- 12.1.8.2. Products
- 12.1.8.3. Company Financials
- 12.1.8.4. SWOT Analysis
- 12.1.9 Northrop Grumman Corporation
- 12.1.9.1. Company Overview
- 12.1.9.2. Products
- 12.1.9.3. Company Financials
- 12.1.9.4. SWOT Analysis
- 12.1.10 Indian Space Research Organisation (ISRO)
- 12.1.10.1. Company Overview
- 12.1.10.2. Products
- 12.1.10.3. Company Financials
- 12.1.10.4. SWOT Analysis
- 12.1.1 Mitsubishi Heavy Industries
- 12.2. Market Entropy
- 12.2.1 Company's Key Areas Served
- 12.2.2 Recent Developments
- 12.3. Company Market Share Analysis 2025
- 12.3.1 Top 5 Companies Market Share Analysis
- 12.3.2 Top 3 Companies Market Share Analysis
- 12.4. List of Potential Customers
- 13. Research Methodology
List of Figures
- Figure 1: Global GEO Satellite Market Revenue Breakdown (billion, %) by Region 2025 & 2033
- Figure 2: North America GEO Satellite Market Revenue (billion), by Application 2025 & 2033
- Figure 3: North America GEO Satellite Market Revenue Share (%), by Application 2025 & 2033
- Figure 4: North America GEO Satellite Market Revenue (billion), by Satellite Mass 2025 & 2033
- Figure 5: North America GEO Satellite Market Revenue Share (%), by Satellite Mass 2025 & 2033
- Figure 6: North America GEO Satellite Market Revenue (billion), by End User 2025 & 2033
- Figure 7: North America GEO Satellite Market Revenue Share (%), by End User 2025 & 2033
- Figure 8: North America GEO Satellite Market Revenue (billion), by Propulsion Tech 2025 & 2033
- Figure 9: North America GEO Satellite Market Revenue Share (%), by Propulsion Tech 2025 & 2033
- Figure 10: North America GEO Satellite Market Revenue (billion), by Country 2025 & 2033
- Figure 11: North America GEO Satellite Market Revenue Share (%), by Country 2025 & 2033
- Figure 12: South America GEO Satellite Market Revenue (billion), by Application 2025 & 2033
- Figure 13: South America GEO Satellite Market Revenue Share (%), by Application 2025 & 2033
- Figure 14: South America GEO Satellite Market Revenue (billion), by Satellite Mass 2025 & 2033
- Figure 15: South America GEO Satellite Market Revenue Share (%), by Satellite Mass 2025 & 2033
- Figure 16: South America GEO Satellite Market Revenue (billion), by End User 2025 & 2033
- Figure 17: South America GEO Satellite Market Revenue Share (%), by End User 2025 & 2033
- Figure 18: South America GEO Satellite Market Revenue (billion), by Propulsion Tech 2025 & 2033
- Figure 19: South America GEO Satellite Market Revenue Share (%), by Propulsion Tech 2025 & 2033
- Figure 20: South America GEO Satellite Market Revenue (billion), by Country 2025 & 2033
- Figure 21: South America GEO Satellite Market Revenue Share (%), by Country 2025 & 2033
- Figure 22: Europe GEO Satellite Market Revenue (billion), by Application 2025 & 2033
- Figure 23: Europe GEO Satellite Market Revenue Share (%), by Application 2025 & 2033
- Figure 24: Europe GEO Satellite Market Revenue (billion), by Satellite Mass 2025 & 2033
- Figure 25: Europe GEO Satellite Market Revenue Share (%), by Satellite Mass 2025 & 2033
- Figure 26: Europe GEO Satellite Market Revenue (billion), by End User 2025 & 2033
- Figure 27: Europe GEO Satellite Market Revenue Share (%), by End User 2025 & 2033
- Figure 28: Europe GEO Satellite Market Revenue (billion), by Propulsion Tech 2025 & 2033
- Figure 29: Europe GEO Satellite Market Revenue Share (%), by Propulsion Tech 2025 & 2033
- Figure 30: Europe GEO Satellite Market Revenue (billion), by Country 2025 & 2033
- Figure 31: Europe GEO Satellite Market Revenue Share (%), by Country 2025 & 2033
- Figure 32: Middle East & Africa GEO Satellite Market Revenue (billion), by Application 2025 & 2033
- Figure 33: Middle East & Africa GEO Satellite Market Revenue Share (%), by Application 2025 & 2033
- Figure 34: Middle East & Africa GEO Satellite Market Revenue (billion), by Satellite Mass 2025 & 2033
- Figure 35: Middle East & Africa GEO Satellite Market Revenue Share (%), by Satellite Mass 2025 & 2033
- Figure 36: Middle East & Africa GEO Satellite Market Revenue (billion), by End User 2025 & 2033
- Figure 37: Middle East & Africa GEO Satellite Market Revenue Share (%), by End User 2025 & 2033
- Figure 38: Middle East & Africa GEO Satellite Market Revenue (billion), by Propulsion Tech 2025 & 2033
- Figure 39: Middle East & Africa GEO Satellite Market Revenue Share (%), by Propulsion Tech 2025 & 2033
- Figure 40: Middle East & Africa GEO Satellite Market Revenue (billion), by Country 2025 & 2033
- Figure 41: Middle East & Africa GEO Satellite Market Revenue Share (%), by Country 2025 & 2033
- Figure 42: Asia Pacific GEO Satellite Market Revenue (billion), by Application 2025 & 2033
- Figure 43: Asia Pacific GEO Satellite Market Revenue Share (%), by Application 2025 & 2033
- Figure 44: Asia Pacific GEO Satellite Market Revenue (billion), by Satellite Mass 2025 & 2033
- Figure 45: Asia Pacific GEO Satellite Market Revenue Share (%), by Satellite Mass 2025 & 2033
- Figure 46: Asia Pacific GEO Satellite Market Revenue (billion), by End User 2025 & 2033
- Figure 47: Asia Pacific GEO Satellite Market Revenue Share (%), by End User 2025 & 2033
- Figure 48: Asia Pacific GEO Satellite Market Revenue (billion), by Propulsion Tech 2025 & 2033
- Figure 49: Asia Pacific GEO Satellite Market Revenue Share (%), by Propulsion Tech 2025 & 2033
- Figure 50: Asia Pacific GEO Satellite Market Revenue (billion), by Country 2025 & 2033
- Figure 51: Asia Pacific GEO Satellite Market Revenue Share (%), by Country 2025 & 2033
List of Tables
- Table 1: Global GEO Satellite Market Revenue billion Forecast, by Application 2020 & 2033
- Table 2: Global GEO Satellite Market Revenue billion Forecast, by Satellite Mass 2020 & 2033
- Table 3: Global GEO Satellite Market Revenue billion Forecast, by End User 2020 & 2033
- Table 4: Global GEO Satellite Market Revenue billion Forecast, by Propulsion Tech 2020 & 2033
- Table 5: Global GEO Satellite Market Revenue billion Forecast, by Region 2020 & 2033
- Table 6: Global GEO Satellite Market Revenue billion Forecast, by Application 2020 & 2033
- Table 7: Global GEO Satellite Market Revenue billion Forecast, by Satellite Mass 2020 & 2033
- Table 8: Global GEO Satellite Market Revenue billion Forecast, by End User 2020 & 2033
- Table 9: Global GEO Satellite Market Revenue billion Forecast, by Propulsion Tech 2020 & 2033
- Table 10: Global GEO Satellite Market Revenue billion Forecast, by Country 2020 & 2033
- Table 11: United States GEO Satellite Market Revenue (billion) Forecast, by Application 2020 & 2033
- Table 12: Canada GEO Satellite Market Revenue (billion) Forecast, by Application 2020 & 2033
- Table 13: Mexico GEO Satellite Market Revenue (billion) Forecast, by Application 2020 & 2033
- Table 14: Global GEO Satellite Market Revenue billion Forecast, by Application 2020 & 2033
- Table 15: Global GEO Satellite Market Revenue billion Forecast, by Satellite Mass 2020 & 2033
- Table 16: Global GEO Satellite Market Revenue billion Forecast, by End User 2020 & 2033
- Table 17: Global GEO Satellite Market Revenue billion Forecast, by Propulsion Tech 2020 & 2033
- Table 18: Global GEO Satellite Market Revenue billion Forecast, by Country 2020 & 2033
- Table 19: Brazil GEO Satellite Market Revenue (billion) Forecast, by Application 2020 & 2033
- Table 20: Argentina GEO Satellite Market Revenue (billion) Forecast, by Application 2020 & 2033
- Table 21: Rest of South America GEO Satellite Market Revenue (billion) Forecast, by Application 2020 & 2033
- Table 22: Global GEO Satellite Market Revenue billion Forecast, by Application 2020 & 2033
- Table 23: Global GEO Satellite Market Revenue billion Forecast, by Satellite Mass 2020 & 2033
- Table 24: Global GEO Satellite Market Revenue billion Forecast, by End User 2020 & 2033
- Table 25: Global GEO Satellite Market Revenue billion Forecast, by Propulsion Tech 2020 & 2033
- Table 26: Global GEO Satellite Market Revenue billion Forecast, by Country 2020 & 2033
- Table 27: United Kingdom GEO Satellite Market Revenue (billion) Forecast, by Application 2020 & 2033
- Table 28: Germany GEO Satellite Market Revenue (billion) Forecast, by Application 2020 & 2033
- Table 29: France GEO Satellite Market Revenue (billion) Forecast, by Application 2020 & 2033
- Table 30: Italy GEO Satellite Market Revenue (billion) Forecast, by Application 2020 & 2033
- Table 31: Spain GEO Satellite Market Revenue (billion) Forecast, by Application 2020 & 2033
- Table 32: Russia GEO Satellite Market Revenue (billion) Forecast, by Application 2020 & 2033
- Table 33: Benelux GEO Satellite Market Revenue (billion) Forecast, by Application 2020 & 2033
- Table 34: Nordics GEO Satellite Market Revenue (billion) Forecast, by Application 2020 & 2033
- Table 35: Rest of Europe GEO Satellite Market Revenue (billion) Forecast, by Application 2020 & 2033
- Table 36: Global GEO Satellite Market Revenue billion Forecast, by Application 2020 & 2033
- Table 37: Global GEO Satellite Market Revenue billion Forecast, by Satellite Mass 2020 & 2033
- Table 38: Global GEO Satellite Market Revenue billion Forecast, by End User 2020 & 2033
- Table 39: Global GEO Satellite Market Revenue billion Forecast, by Propulsion Tech 2020 & 2033
- Table 40: Global GEO Satellite Market Revenue billion Forecast, by Country 2020 & 2033
- Table 41: Turkey GEO Satellite Market Revenue (billion) Forecast, by Application 2020 & 2033
- Table 42: Israel GEO Satellite Market Revenue (billion) Forecast, by Application 2020 & 2033
- Table 43: GCC GEO Satellite Market Revenue (billion) Forecast, by Application 2020 & 2033
- Table 44: North Africa GEO Satellite Market Revenue (billion) Forecast, by Application 2020 & 2033
- Table 45: South Africa GEO Satellite Market Revenue (billion) Forecast, by Application 2020 & 2033
- Table 46: Rest of Middle East & Africa GEO Satellite Market Revenue (billion) Forecast, by Application 2020 & 2033
- Table 47: Global GEO Satellite Market Revenue billion Forecast, by Application 2020 & 2033
- Table 48: Global GEO Satellite Market Revenue billion Forecast, by Satellite Mass 2020 & 2033
- Table 49: Global GEO Satellite Market Revenue billion Forecast, by End User 2020 & 2033
- Table 50: Global GEO Satellite Market Revenue billion Forecast, by Propulsion Tech 2020 & 2033
- Table 51: Global GEO Satellite Market Revenue billion Forecast, by Country 2020 & 2033
- Table 52: China GEO Satellite Market Revenue (billion) Forecast, by Application 2020 & 2033
- Table 53: India GEO Satellite Market Revenue (billion) Forecast, by Application 2020 & 2033
- Table 54: Japan GEO Satellite Market Revenue (billion) Forecast, by Application 2020 & 2033
- Table 55: South Korea GEO Satellite Market Revenue (billion) Forecast, by Application 2020 & 2033
- Table 56: ASEAN GEO Satellite Market Revenue (billion) Forecast, by Application 2020 & 2033
- Table 57: Oceania GEO Satellite Market Revenue (billion) Forecast, by Application 2020 & 2033
- Table 58: Rest of Asia Pacific GEO Satellite Market Revenue (billion) Forecast, by Application 2020 & 2033
Frequently Asked Questions
1. What is the projected Compound Annual Growth Rate (CAGR) of the GEO Satellite Market?
The projected CAGR is approximately 18.1%.
2. Which companies are prominent players in the GEO Satellite Market?
Key companies in the market include Mitsubishi Heavy Industries, Lockheed Martin Corporation, Airbus SE, Japan Aerospace Exploration Agency (JAXA), The Boeing Compan, China Aerospace Science and Technology Corporation (CASC), Thales, Maxar Technologies Inc, Northrop Grumman Corporation, Indian Space Research Organisation (ISRO).
3. What are the main segments of the GEO Satellite Market?
The market segments include Application, Satellite Mass, End User, Propulsion Tech.
4. Can you provide details about the market size?
The market size is estimated to be USD 14.56 billion as of 2022.
5. What are some drivers contributing to market growth?
N/A
6. What are the notable trends driving market growth?
Liquid fuel propulsion is expected to surge during the forecast period.
7. Are there any restraints impacting market growth?
N/A
8. Can you provide examples of recent developments in the market?
February 2023: China sent the Zhongxing-26 communications satellite into orbit,it is expected to be a military satelliteJanuary 2023: Airbus was awarded to build a geostationary telecommunications satellite by Inmarsat. The Airbus-built Inmarsat-6 telecommunications satellite (I-6 F2) has brought on board an Airbus Beluga at the Kennedy Space Center in Florida ready for its launch in February 2023.December 2022: Airbus has successfully achieved the System Critical Design Review on the EGNOS V3 (European Geostationary Navigation Overlay Service) satellite-based augmentation system. The new V3 generation of EGNOS being developed by Airbus will introduce new services based on multiple frequencies of multiple constellations (GPS, Galileo), and will embed sophisticated security protection against cyber-attacks.
9. What pricing options are available for accessing the report?
Pricing options include single-user, multi-user, and enterprise licenses priced at USD 3800, USD 4500, and USD 5800 respectively.
10. Is the market size provided in terms of value or volume?
The market size is provided in terms of value, measured in billion.
11. Are there any specific market keywords associated with the report?
Yes, the market keyword associated with the report is "GEO Satellite Market," which aids in identifying and referencing the specific market segment covered.
12. How do I determine which pricing option suits my needs best?
The pricing options vary based on user requirements and access needs. Individual users may opt for single-user licenses, while businesses requiring broader access may choose multi-user or enterprise licenses for cost-effective access to the report.
13. Are there any additional resources or data provided in the GEO Satellite Market report?
While the report offers comprehensive insights, it's advisable to review the specific contents or supplementary materials provided to ascertain if additional resources or data are available.
14. How can I stay updated on further developments or reports in the GEO Satellite Market?
To stay informed about further developments, trends, and reports in the GEO Satellite Market, consider subscribing to industry newsletters, following relevant companies and organizations, or regularly checking reputable industry news sources and publications.
Methodology
Step 1 - Identification of Relevant Samples Size from Population Database


Step 2 - Approaches for Defining Global Market Size (Value, Volume* & Price*)

Note*: In applicable scenarios
Step 3 - Data Sources
Primary Research
- Web Analytics
- Survey Reports
- Research Institute
- Latest Research Reports
- Opinion Leaders
Secondary Research
- Annual Reports
- White Paper
- Latest Press Release
- Industry Association
- Paid Database
- Investor Presentations

Step 4 - Data Triangulation
Involves using different sources of information in order to increase the validity of a study
These sources are likely to be stakeholders in a program - participants, other researchers, program staff, other community members, and so on.
Then we put all data in single framework & apply various statistical tools to find out the dynamic on the market.
During the analysis stage, feedback from the stakeholder groups would be compared to determine areas of agreement as well as areas of divergence