


Key Insights
The Gigabit Ethernet Test Equipment market is experiencing robust growth, driven by the increasing adoption of high-speed Ethernet networks across diverse sectors. The market's Compound Annual Growth Rate (CAGR) of 6.45% from 2019 to 2024 indicates a consistent expansion, projected to continue through 2033. Key drivers include the rising demand for faster data transmission speeds in industries like automotive, manufacturing, and telecommunications, necessitating thorough testing and validation of Ethernet equipment. Furthermore, the expanding deployment of 5G networks and the Internet of Things (IoT) are fueling the need for sophisticated Gigabit Ethernet testing solutions. The market is segmented by Ethernet speed (1GbE, 10GbE, 25/50GbE) and end-user industry, with the automotive and telecommunications sectors exhibiting particularly strong growth. Leading companies like Keysight Technologies, Viavi Solutions, and Anritsu are investing heavily in R&D to develop advanced testing solutions capable of handling the complexities of modern high-speed networks. The geographic distribution of the market reveals significant opportunities in North America and Asia-Pacific regions, driven by robust technological advancements and infrastructural developments. However, the market faces certain restraints, including the high cost of advanced testing equipment and the need for specialized technical expertise to operate these systems. Despite these challenges, the long-term outlook for the Gigabit Ethernet Test Equipment market remains positive, fueled by ongoing technological innovation and the expanding demand for reliable high-speed network connectivity.

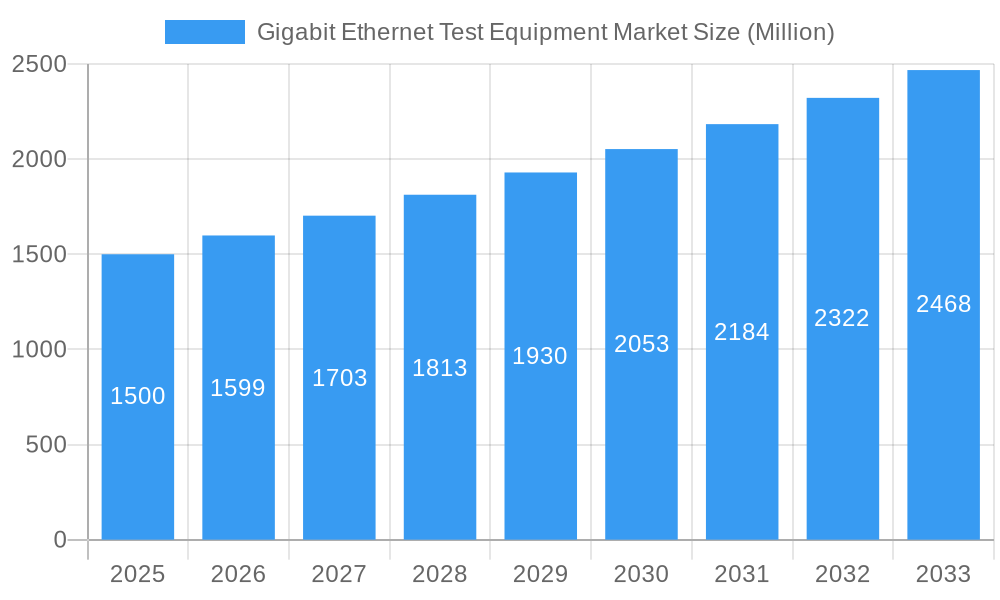
Gigabit Ethernet Test Equipment Market Market Size (In Billion)

The market's projected growth is underpinned by several factors. The increasing adoption of cloud computing and data center virtualization demands high-performance networking solutions, directly impacting the need for comprehensive testing equipment. Furthermore, the rise of automation and Industry 4.0 initiatives within the manufacturing sector are driving significant investment in advanced testing capabilities to ensure network reliability and efficiency. Regional variations in market growth are anticipated, with faster growth in developing economies driven by infrastructure investments and rising technological adoption. Competitive landscape analysis reveals a mix of established players and emerging technology providers, fostering innovation and driving price competitiveness. The overall market scenario points toward a continued period of expansion, influenced by factors such as technological advancements, expanding applications, and increased global connectivity needs. Ongoing research and development efforts will likely focus on developing cost-effective, user-friendly, and more comprehensive test solutions catering to the diverse needs of various industry sectors.
Gigabit Ethernet Test Equipment Market Company Market Share
Gigabit Ethernet Test Equipment Market: A Comprehensive Report (2019-2033)
This detailed report provides a comprehensive analysis of the Gigabit Ethernet Test Equipment market, offering invaluable insights for industry stakeholders, investors, and strategic decision-makers. The report covers the period 2019-2033, with 2025 as the base year and a forecast period of 2025-2033. It delves into market dynamics, competitive landscape, technological advancements, and growth opportunities, providing actionable intelligence for navigating this rapidly evolving sector. The market is segmented by type (1GBE, 10GBE, 25/50GBE) and end-user industry (Automotive, Manufacturing, Telecommunication, Transportation and Logistics, Other End-user Industries). Key players analyzed include GAO Tek Inc, Viavi Solutions Inc, TE Connectivity Ltd, Xena Networks Inc, Anritsu Corp, IDEAL Industries Inc, Exfo Inc, Keysight Technologies Inc, Spirent Communications PLC, and Aquantia Corp. The report projects a market value of xx Million by 2033.
Gigabit Ethernet Test Equipment Market Market Concentration & Innovation
The Gigabit Ethernet Test Equipment market exhibits a moderately concentrated landscape, with a few dominant players holding significant market share. Keysight Technologies, Viavi Solutions, and Spirent Communications, for example, command substantial portions of the market. However, the presence of several smaller, specialized players indicates a competitive environment. Innovation is a key driver, with ongoing advancements in higher-speed Ethernet technologies (e.g., 800GE) fueling demand for advanced test equipment.
- Market Concentration: The Herfindahl-Hirschman Index (HHI) is estimated at xx, suggesting a moderately concentrated market.
- Innovation Drivers: The demand for higher bandwidths, improved network performance, and increased data transmission speeds necessitates continuous technological advancement in test equipment.
- Regulatory Frameworks: Compliance with industry standards (e.g., IEEE standards) influences the design and features of Gigabit Ethernet test equipment.
- Product Substitutes: While direct substitutes are limited, the choice between different testing solutions (e.g., hardware-based vs. software-based) influences market dynamics.
- End-User Trends: The increasing adoption of cloud computing, IoT, and 5G networks drives the need for robust testing solutions.
- M&A Activities: The market has witnessed several mergers and acquisitions in recent years, with deal values ranging from xx Million to xx Million, reflecting consolidation and expansion strategies among key players.
Gigabit Ethernet Test Equipment Market Industry Trends & Insights
The Gigabit Ethernet Test Equipment market is experiencing robust growth, driven by several factors. The proliferation of high-speed data transmission requirements across diverse sectors, including telecommunications, automotive, and manufacturing, fuels demand. Technological advancements like the evolution of 800GE and the adoption of new standards and protocols further stimulate market expansion. The CAGR for the forecast period (2025-2033) is projected to be xx%. Market penetration in key end-user segments continues to grow, particularly in the telecommunications and data center sectors. Competitive dynamics are characterized by both intense rivalry among established players and the emergence of new entrants focusing on niche applications and innovative solutions. Consumer preference is shifting towards integrated, versatile, and user-friendly test equipment offering greater accuracy and efficiency.
Dominant Markets & Segments in Gigabit Ethernet Test Equipment Market
The telecommunications sector represents the dominant end-user industry for Gigabit Ethernet test equipment, followed by the manufacturing sector. Geographically, North America and Europe currently hold significant market shares, driven by strong technological infrastructure and high adoption rates. However, the Asia-Pacific region is projected to experience rapid growth in the coming years.
Key Drivers for Telecommunications Dominance:
- Extensive deployment of high-speed networks (5G, fiber optics).
- Stringent quality assurance requirements.
- Continuous network upgrades and expansions.
Key Drivers for Manufacturing Sector Growth:
- Automation and digitization trends in manufacturing plants.
- Increased adoption of Industrial IoT (IIoT).
- Need for reliable network infrastructure for data acquisition and control.
Asia-Pacific Growth Drivers:
- Rapid infrastructure development and digital transformation initiatives.
- Increasing government support for technological advancement.
- Growing adoption of 5G technology.
Type Segmentation: The 10GBE segment currently holds the largest market share, but the 25/50GBE segment is projected to experience the highest growth rate due to the increasing demand for higher bandwidths.
Gigabit Ethernet Test Equipment Market Product Developments
Recent product innovations focus on increased testing speeds, improved accuracy, and enhanced capabilities to handle newer Ethernet standards, such as 800GE. This includes advancements in modularity, automation, and software features that streamline testing workflows and minimize downtime. The market trend is towards integrated solutions providing comprehensive testing capabilities for various Ethernet technologies, alongside improved user interfaces and data analysis tools. These advancements enhance market fit by catering to evolving industry needs and providing a competitive advantage to vendors offering these advanced solutions.
Report Scope & Segmentation Analysis
Type: The report segments the market by type into 1 GBE, 10 GBE, and 25/50 GBE. Each segment's growth trajectory, market size, and competitive intensity are analyzed. The 25/50 GBE segment is anticipated to experience the most significant growth due to increasing demands for high-bandwidth applications.
End-user Industry: The market is segmented by end-user industries into Automotive, Manufacturing, Telecommunication, Transportation and Logistics, and Other End-user Industries. The telecommunication segment currently dominates, driven by the rapid expansion of 5G networks and increased data traffic. The manufacturing sector is also projected to witness significant growth due to the adoption of Industry 4.0 technologies. Each segment's market size, growth potential, and competitive landscape are comprehensively explored.
Key Drivers of Gigabit Ethernet Test Equipment Market Growth
Several factors drive the growth of the Gigabit Ethernet Test Equipment market. The escalating demand for high-speed data transmission in various applications like 5G networks, cloud computing, and the Internet of Things (IoT) significantly contributes to market expansion. Technological advancements, such as the development of 800GE and other high-speed Ethernet standards, further fuel this growth. Government initiatives promoting digital infrastructure development in several regions also play a vital role. Stringent quality control standards within industries necessitate reliable test equipment for ensuring network performance and reliability.
Challenges in the Gigabit Ethernet Test Equipment Market Sector
The market faces challenges, including the high cost of advanced test equipment, which can limit adoption, especially among smaller companies. The complexity of new Ethernet standards and the need for specialized expertise to operate the equipment present another hurdle. Competition from both established players and new entrants keeps pressure on pricing and margins. Supply chain disruptions can also impact the availability of components, leading to delays in production and delivery. These factors collectively influence market growth and necessitate strategic adaptation from market participants.
Emerging Opportunities in Gigabit Ethernet Test Equipment Market
Emerging opportunities lie in the development of cost-effective, user-friendly test equipment for smaller organizations. The integration of artificial intelligence (AI) and machine learning (ML) into test systems to automate testing processes and enhance data analysis represents another promising avenue. The expansion into new and emerging markets, particularly in developing economies, offers considerable growth potential. Furthermore, the demand for testing solutions for specialized applications, such as autonomous vehicles and industrial IoT, presents lucrative opportunities for innovation and expansion.
Leading Players in the Gigabit Ethernet Test Equipment Market Market
- GAO Tek Inc
- Viavi Solutions Inc (Viavi Solutions)
- TE Connectivity Ltd (TE Connectivity)
- Xena Networks Inc
- Anritsu Corp (Anritsu)
- IDEAL Industries Inc (IDEAL Industries)
- Exfo Inc (Exfo)
- Keysight Technologies Inc (Keysight Technologies)
- Spirent Communications PLC (Spirent Communications)
- Aquantia Corp
Key Developments in Gigabit Ethernet Test Equipment Market Industry
- March 2022: Keysight Technologies demonstrated optical and high-speed digital test solutions at the Optical Fiber Communications (OFC) Conference, showcasing its capabilities in the evolving Ethernet landscape. This highlighted the company's commitment to innovation in high-speed testing.
- January 2022: Bharti Airtel's partnership with Google, involving a significant investment, underscores the growing importance of digital infrastructure and the need for robust testing to support its expansion. This development indirectly boosts demand for Gigabit Ethernet test equipment in the telecommunications sector.
Strategic Outlook for Gigabit Ethernet Test Equipment Market Market
The Gigabit Ethernet Test Equipment market is poised for continued growth, driven by the ongoing expansion of high-speed networks and the increasing adoption of advanced technologies. Opportunities lie in developing innovative solutions to address emerging challenges, such as higher testing speeds, increased bandwidths, and the need for automation. Strategic partnerships, mergers and acquisitions, and continuous product innovation will be critical for success in this competitive landscape. The market's long-term prospects remain positive, reflecting the fundamental role of robust testing in ensuring the reliability and performance of next-generation network infrastructures.
Gigabit Ethernet Test Equipment Market Segmentation
-
1. Type
- 1.1. 1 GBE
- 1.2. 10 GBE
- 1.3. 25/50 GBE
-
2. End-user Industry
- 2.1. Automotive
- 2.2. Manufacturing
- 2.3. Telecommunication
- 2.4. Transportation and Logistics
- 2.5. Other End-user Industries
Gigabit Ethernet Test Equipment Market Segmentation By Geography
- 1. North America
- 2. Europe
- 3. Asia Pacific
- 4. Rest of the World

Gigabit Ethernet Test Equipment Market Regional Market Share
Geographic Coverage of Gigabit Ethernet Test Equipment Market
Gigabit Ethernet Test Equipment Market REPORT HIGHLIGHTS
| Aspects | Details |
|---|---|
| Study Period | 2020-2034 |
| Base Year | 2025 |
| Estimated Year | 2026 |
| Forecast Period | 2026-2034 |
| Historical Period | 2020-2025 |
| Growth Rate | CAGR of 7.8% from 2020-2034 |
| Segmentation |
|
Table of Contents
- 1. Introduction
- 1.1. Research Scope
- 1.2. Market Segmentation
- 1.3. Research Methodology
- 1.4. Definitions and Assumptions
- 2. Executive Summary
- 2.1. Introduction
- 3. Market Dynamics
- 3.1. Introduction
- 3.2. Market Drivers
- 3.2.1. Increasing Need for Ethernet in the Manufacturing Industries; Growth in Mobile Backhaul; Adoption of Cloud Services and Big Data
- 3.3. Market Restrains
- 3.3.1. Operational Challenges and High Levels of Competition Leading to Price Pressures for Manufacturers
- 3.4. Market Trends
- 3.4.1. Telecommunication Segment is Expected to Hold a Significant Market Share
- 4. Market Factor Analysis
- 4.1. Porters Five Forces
- 4.2. Supply/Value Chain
- 4.3. PESTEL analysis
- 4.4. Market Entropy
- 4.5. Patent/Trademark Analysis
- 5. Global Gigabit Ethernet Test Equipment Market Analysis, Insights and Forecast, 2020-2032
- 5.1. Market Analysis, Insights and Forecast - by Type
- 5.1.1. 1 GBE
- 5.1.2. 10 GBE
- 5.1.3. 25/50 GBE
- 5.2. Market Analysis, Insights and Forecast - by End-user Industry
- 5.2.1. Automotive
- 5.2.2. Manufacturing
- 5.2.3. Telecommunication
- 5.2.4. Transportation and Logistics
- 5.2.5. Other End-user Industries
- 5.3. Market Analysis, Insights and Forecast - by Region
- 5.3.1. North America
- 5.3.2. Europe
- 5.3.3. Asia Pacific
- 5.3.4. Rest of the World
- 5.1. Market Analysis, Insights and Forecast - by Type
- 6. North America Gigabit Ethernet Test Equipment Market Analysis, Insights and Forecast, 2020-2032
- 6.1. Market Analysis, Insights and Forecast - by Type
- 6.1.1. 1 GBE
- 6.1.2. 10 GBE
- 6.1.3. 25/50 GBE
- 6.2. Market Analysis, Insights and Forecast - by End-user Industry
- 6.2.1. Automotive
- 6.2.2. Manufacturing
- 6.2.3. Telecommunication
- 6.2.4. Transportation and Logistics
- 6.2.5. Other End-user Industries
- 6.1. Market Analysis, Insights and Forecast - by Type
- 7. Europe Gigabit Ethernet Test Equipment Market Analysis, Insights and Forecast, 2020-2032
- 7.1. Market Analysis, Insights and Forecast - by Type
- 7.1.1. 1 GBE
- 7.1.2. 10 GBE
- 7.1.3. 25/50 GBE
- 7.2. Market Analysis, Insights and Forecast - by End-user Industry
- 7.2.1. Automotive
- 7.2.2. Manufacturing
- 7.2.3. Telecommunication
- 7.2.4. Transportation and Logistics
- 7.2.5. Other End-user Industries
- 7.1. Market Analysis, Insights and Forecast - by Type
- 8. Asia Pacific Gigabit Ethernet Test Equipment Market Analysis, Insights and Forecast, 2020-2032
- 8.1. Market Analysis, Insights and Forecast - by Type
- 8.1.1. 1 GBE
- 8.1.2. 10 GBE
- 8.1.3. 25/50 GBE
- 8.2. Market Analysis, Insights and Forecast - by End-user Industry
- 8.2.1. Automotive
- 8.2.2. Manufacturing
- 8.2.3. Telecommunication
- 8.2.4. Transportation and Logistics
- 8.2.5. Other End-user Industries
- 8.1. Market Analysis, Insights and Forecast - by Type
- 9. Rest of the World Gigabit Ethernet Test Equipment Market Analysis, Insights and Forecast, 2020-2032
- 9.1. Market Analysis, Insights and Forecast - by Type
- 9.1.1. 1 GBE
- 9.1.2. 10 GBE
- 9.1.3. 25/50 GBE
- 9.2. Market Analysis, Insights and Forecast - by End-user Industry
- 9.2.1. Automotive
- 9.2.2. Manufacturing
- 9.2.3. Telecommunication
- 9.2.4. Transportation and Logistics
- 9.2.5. Other End-user Industries
- 9.1. Market Analysis, Insights and Forecast - by Type
- 10. Competitive Analysis
- 10.1. Global Market Share Analysis 2025
- 10.2. Company Profiles
- 10.2.1 GAO Tek Inc
- 10.2.1.1. Overview
- 10.2.1.2. Products
- 10.2.1.3. SWOT Analysis
- 10.2.1.4. Recent Developments
- 10.2.1.5. Financials (Based on Availability)
- 10.2.2 Viavi Solutions Inc
- 10.2.2.1. Overview
- 10.2.2.2. Products
- 10.2.2.3. SWOT Analysis
- 10.2.2.4. Recent Developments
- 10.2.2.5. Financials (Based on Availability)
- 10.2.3 TE Connectivity Ltd
- 10.2.3.1. Overview
- 10.2.3.2. Products
- 10.2.3.3. SWOT Analysis
- 10.2.3.4. Recent Developments
- 10.2.3.5. Financials (Based on Availability)
- 10.2.4 Xena Networks Inc
- 10.2.4.1. Overview
- 10.2.4.2. Products
- 10.2.4.3. SWOT Analysis
- 10.2.4.4. Recent Developments
- 10.2.4.5. Financials (Based on Availability)
- 10.2.5 Anritsu Corp
- 10.2.5.1. Overview
- 10.2.5.2. Products
- 10.2.5.3. SWOT Analysis
- 10.2.5.4. Recent Developments
- 10.2.5.5. Financials (Based on Availability)
- 10.2.6 IDEAL Industries Inc
- 10.2.6.1. Overview
- 10.2.6.2. Products
- 10.2.6.3. SWOT Analysis
- 10.2.6.4. Recent Developments
- 10.2.6.5. Financials (Based on Availability)
- 10.2.7 Exfo Inc
- 10.2.7.1. Overview
- 10.2.7.2. Products
- 10.2.7.3. SWOT Analysis
- 10.2.7.4. Recent Developments
- 10.2.7.5. Financials (Based on Availability)
- 10.2.8 Keysight Technologies Inc
- 10.2.8.1. Overview
- 10.2.8.2. Products
- 10.2.8.3. SWOT Analysis
- 10.2.8.4. Recent Developments
- 10.2.8.5. Financials (Based on Availability)
- 10.2.9 Spirent Communications PLC
- 10.2.9.1. Overview
- 10.2.9.2. Products
- 10.2.9.3. SWOT Analysis
- 10.2.9.4. Recent Developments
- 10.2.9.5. Financials (Based on Availability)
- 10.2.10 Aquantia Corp
- 10.2.10.1. Overview
- 10.2.10.2. Products
- 10.2.10.3. SWOT Analysis
- 10.2.10.4. Recent Developments
- 10.2.10.5. Financials (Based on Availability)
- 10.2.1 GAO Tek Inc
List of Figures
- Figure 1: Global Gigabit Ethernet Test Equipment Market Revenue Breakdown (undefined, %) by Region 2025 & 2033
- Figure 2: Global Gigabit Ethernet Test Equipment Market Volume Breakdown (K Unit, %) by Region 2025 & 2033
- Figure 3: North America Gigabit Ethernet Test Equipment Market Revenue (undefined), by Type 2025 & 2033
- Figure 4: North America Gigabit Ethernet Test Equipment Market Volume (K Unit), by Type 2025 & 2033
- Figure 5: North America Gigabit Ethernet Test Equipment Market Revenue Share (%), by Type 2025 & 2033
- Figure 6: North America Gigabit Ethernet Test Equipment Market Volume Share (%), by Type 2025 & 2033
- Figure 7: North America Gigabit Ethernet Test Equipment Market Revenue (undefined), by End-user Industry 2025 & 2033
- Figure 8: North America Gigabit Ethernet Test Equipment Market Volume (K Unit), by End-user Industry 2025 & 2033
- Figure 9: North America Gigabit Ethernet Test Equipment Market Revenue Share (%), by End-user Industry 2025 & 2033
- Figure 10: North America Gigabit Ethernet Test Equipment Market Volume Share (%), by End-user Industry 2025 & 2033
- Figure 11: North America Gigabit Ethernet Test Equipment Market Revenue (undefined), by Country 2025 & 2033
- Figure 12: North America Gigabit Ethernet Test Equipment Market Volume (K Unit), by Country 2025 & 2033
- Figure 13: North America Gigabit Ethernet Test Equipment Market Revenue Share (%), by Country 2025 & 2033
- Figure 14: North America Gigabit Ethernet Test Equipment Market Volume Share (%), by Country 2025 & 2033
- Figure 15: Europe Gigabit Ethernet Test Equipment Market Revenue (undefined), by Type 2025 & 2033
- Figure 16: Europe Gigabit Ethernet Test Equipment Market Volume (K Unit), by Type 2025 & 2033
- Figure 17: Europe Gigabit Ethernet Test Equipment Market Revenue Share (%), by Type 2025 & 2033
- Figure 18: Europe Gigabit Ethernet Test Equipment Market Volume Share (%), by Type 2025 & 2033
- Figure 19: Europe Gigabit Ethernet Test Equipment Market Revenue (undefined), by End-user Industry 2025 & 2033
- Figure 20: Europe Gigabit Ethernet Test Equipment Market Volume (K Unit), by End-user Industry 2025 & 2033
- Figure 21: Europe Gigabit Ethernet Test Equipment Market Revenue Share (%), by End-user Industry 2025 & 2033
- Figure 22: Europe Gigabit Ethernet Test Equipment Market Volume Share (%), by End-user Industry 2025 & 2033
- Figure 23: Europe Gigabit Ethernet Test Equipment Market Revenue (undefined), by Country 2025 & 2033
- Figure 24: Europe Gigabit Ethernet Test Equipment Market Volume (K Unit), by Country 2025 & 2033
- Figure 25: Europe Gigabit Ethernet Test Equipment Market Revenue Share (%), by Country 2025 & 2033
- Figure 26: Europe Gigabit Ethernet Test Equipment Market Volume Share (%), by Country 2025 & 2033
- Figure 27: Asia Pacific Gigabit Ethernet Test Equipment Market Revenue (undefined), by Type 2025 & 2033
- Figure 28: Asia Pacific Gigabit Ethernet Test Equipment Market Volume (K Unit), by Type 2025 & 2033
- Figure 29: Asia Pacific Gigabit Ethernet Test Equipment Market Revenue Share (%), by Type 2025 & 2033
- Figure 30: Asia Pacific Gigabit Ethernet Test Equipment Market Volume Share (%), by Type 2025 & 2033
- Figure 31: Asia Pacific Gigabit Ethernet Test Equipment Market Revenue (undefined), by End-user Industry 2025 & 2033
- Figure 32: Asia Pacific Gigabit Ethernet Test Equipment Market Volume (K Unit), by End-user Industry 2025 & 2033
- Figure 33: Asia Pacific Gigabit Ethernet Test Equipment Market Revenue Share (%), by End-user Industry 2025 & 2033
- Figure 34: Asia Pacific Gigabit Ethernet Test Equipment Market Volume Share (%), by End-user Industry 2025 & 2033
- Figure 35: Asia Pacific Gigabit Ethernet Test Equipment Market Revenue (undefined), by Country 2025 & 2033
- Figure 36: Asia Pacific Gigabit Ethernet Test Equipment Market Volume (K Unit), by Country 2025 & 2033
- Figure 37: Asia Pacific Gigabit Ethernet Test Equipment Market Revenue Share (%), by Country 2025 & 2033
- Figure 38: Asia Pacific Gigabit Ethernet Test Equipment Market Volume Share (%), by Country 2025 & 2033
- Figure 39: Rest of the World Gigabit Ethernet Test Equipment Market Revenue (undefined), by Type 2025 & 2033
- Figure 40: Rest of the World Gigabit Ethernet Test Equipment Market Volume (K Unit), by Type 2025 & 2033
- Figure 41: Rest of the World Gigabit Ethernet Test Equipment Market Revenue Share (%), by Type 2025 & 2033
- Figure 42: Rest of the World Gigabit Ethernet Test Equipment Market Volume Share (%), by Type 2025 & 2033
- Figure 43: Rest of the World Gigabit Ethernet Test Equipment Market Revenue (undefined), by End-user Industry 2025 & 2033
- Figure 44: Rest of the World Gigabit Ethernet Test Equipment Market Volume (K Unit), by End-user Industry 2025 & 2033
- Figure 45: Rest of the World Gigabit Ethernet Test Equipment Market Revenue Share (%), by End-user Industry 2025 & 2033
- Figure 46: Rest of the World Gigabit Ethernet Test Equipment Market Volume Share (%), by End-user Industry 2025 & 2033
- Figure 47: Rest of the World Gigabit Ethernet Test Equipment Market Revenue (undefined), by Country 2025 & 2033
- Figure 48: Rest of the World Gigabit Ethernet Test Equipment Market Volume (K Unit), by Country 2025 & 2033
- Figure 49: Rest of the World Gigabit Ethernet Test Equipment Market Revenue Share (%), by Country 2025 & 2033
- Figure 50: Rest of the World Gigabit Ethernet Test Equipment Market Volume Share (%), by Country 2025 & 2033
List of Tables
- Table 1: Global Gigabit Ethernet Test Equipment Market Revenue undefined Forecast, by Type 2020 & 2033
- Table 2: Global Gigabit Ethernet Test Equipment Market Volume K Unit Forecast, by Type 2020 & 2033
- Table 3: Global Gigabit Ethernet Test Equipment Market Revenue undefined Forecast, by End-user Industry 2020 & 2033
- Table 4: Global Gigabit Ethernet Test Equipment Market Volume K Unit Forecast, by End-user Industry 2020 & 2033
- Table 5: Global Gigabit Ethernet Test Equipment Market Revenue undefined Forecast, by Region 2020 & 2033
- Table 6: Global Gigabit Ethernet Test Equipment Market Volume K Unit Forecast, by Region 2020 & 2033
- Table 7: Global Gigabit Ethernet Test Equipment Market Revenue undefined Forecast, by Type 2020 & 2033
- Table 8: Global Gigabit Ethernet Test Equipment Market Volume K Unit Forecast, by Type 2020 & 2033
- Table 9: Global Gigabit Ethernet Test Equipment Market Revenue undefined Forecast, by End-user Industry 2020 & 2033
- Table 10: Global Gigabit Ethernet Test Equipment Market Volume K Unit Forecast, by End-user Industry 2020 & 2033
- Table 11: Global Gigabit Ethernet Test Equipment Market Revenue undefined Forecast, by Country 2020 & 2033
- Table 12: Global Gigabit Ethernet Test Equipment Market Volume K Unit Forecast, by Country 2020 & 2033
- Table 13: Global Gigabit Ethernet Test Equipment Market Revenue undefined Forecast, by Type 2020 & 2033
- Table 14: Global Gigabit Ethernet Test Equipment Market Volume K Unit Forecast, by Type 2020 & 2033
- Table 15: Global Gigabit Ethernet Test Equipment Market Revenue undefined Forecast, by End-user Industry 2020 & 2033
- Table 16: Global Gigabit Ethernet Test Equipment Market Volume K Unit Forecast, by End-user Industry 2020 & 2033
- Table 17: Global Gigabit Ethernet Test Equipment Market Revenue undefined Forecast, by Country 2020 & 2033
- Table 18: Global Gigabit Ethernet Test Equipment Market Volume K Unit Forecast, by Country 2020 & 2033
- Table 19: Global Gigabit Ethernet Test Equipment Market Revenue undefined Forecast, by Type 2020 & 2033
- Table 20: Global Gigabit Ethernet Test Equipment Market Volume K Unit Forecast, by Type 2020 & 2033
- Table 21: Global Gigabit Ethernet Test Equipment Market Revenue undefined Forecast, by End-user Industry 2020 & 2033
- Table 22: Global Gigabit Ethernet Test Equipment Market Volume K Unit Forecast, by End-user Industry 2020 & 2033
- Table 23: Global Gigabit Ethernet Test Equipment Market Revenue undefined Forecast, by Country 2020 & 2033
- Table 24: Global Gigabit Ethernet Test Equipment Market Volume K Unit Forecast, by Country 2020 & 2033
- Table 25: Global Gigabit Ethernet Test Equipment Market Revenue undefined Forecast, by Type 2020 & 2033
- Table 26: Global Gigabit Ethernet Test Equipment Market Volume K Unit Forecast, by Type 2020 & 2033
- Table 27: Global Gigabit Ethernet Test Equipment Market Revenue undefined Forecast, by End-user Industry 2020 & 2033
- Table 28: Global Gigabit Ethernet Test Equipment Market Volume K Unit Forecast, by End-user Industry 2020 & 2033
- Table 29: Global Gigabit Ethernet Test Equipment Market Revenue undefined Forecast, by Country 2020 & 2033
- Table 30: Global Gigabit Ethernet Test Equipment Market Volume K Unit Forecast, by Country 2020 & 2033
Frequently Asked Questions
1. What is the projected Compound Annual Growth Rate (CAGR) of the Gigabit Ethernet Test Equipment Market?
The projected CAGR is approximately 7.8%.
2. Which companies are prominent players in the Gigabit Ethernet Test Equipment Market?
Key companies in the market include GAO Tek Inc, Viavi Solutions Inc, TE Connectivity Ltd, Xena Networks Inc, Anritsu Corp, IDEAL Industries Inc, Exfo Inc, Keysight Technologies Inc, Spirent Communications PLC, Aquantia Corp.
3. What are the main segments of the Gigabit Ethernet Test Equipment Market?
The market segments include Type, End-user Industry.
4. Can you provide details about the market size?
The market size is estimated to be USD XXX N/A as of 2022.
5. What are some drivers contributing to market growth?
Increasing Need for Ethernet in the Manufacturing Industries; Growth in Mobile Backhaul; Adoption of Cloud Services and Big Data.
6. What are the notable trends driving market growth?
Telecommunication Segment is Expected to Hold a Significant Market Share.
7. Are there any restraints impacting market growth?
Operational Challenges and High Levels of Competition Leading to Price Pressures for Manufacturers.
8. Can you provide examples of recent developments in the market?
March 2022 - Keysight Demonstrated Optical and High-speed Digital Test Solutions at Optical Fiber Communications (OFC) Conference. IEEE 802.3ck 112 Gigabits/second (112G) PAM4 electrical lanes support full line-rate 800 Gigabit Ethernet (GE) traffic. The G800GE Ethernet test system will demonstrate the performance of Octal Small Form Factor Pluggable (OSFP) 112 and Quad Small Form Factor Pluggable Double Density (QSFP-DD) 800 optical transceivers in terms of bit error rate (BER) and forward error correction (FEC).
9. What pricing options are available for accessing the report?
Pricing options include single-user, multi-user, and enterprise licenses priced at USD 4750, USD 5250, and USD 8750 respectively.
10. Is the market size provided in terms of value or volume?
The market size is provided in terms of value, measured in N/A and volume, measured in K Unit.
11. Are there any specific market keywords associated with the report?
Yes, the market keyword associated with the report is "Gigabit Ethernet Test Equipment Market," which aids in identifying and referencing the specific market segment covered.
12. How do I determine which pricing option suits my needs best?
The pricing options vary based on user requirements and access needs. Individual users may opt for single-user licenses, while businesses requiring broader access may choose multi-user or enterprise licenses for cost-effective access to the report.
13. Are there any additional resources or data provided in the Gigabit Ethernet Test Equipment Market report?
While the report offers comprehensive insights, it's advisable to review the specific contents or supplementary materials provided to ascertain if additional resources or data are available.
14. How can I stay updated on further developments or reports in the Gigabit Ethernet Test Equipment Market?
To stay informed about further developments, trends, and reports in the Gigabit Ethernet Test Equipment Market, consider subscribing to industry newsletters, following relevant companies and organizations, or regularly checking reputable industry news sources and publications.
Methodology
Step 1 - Identification of Relevant Samples Size from Population Database


Step 2 - Approaches for Defining Global Market Size (Value, Volume* & Price*)

Note*: In applicable scenarios
Step 3 - Data Sources
Primary Research
- Web Analytics
- Survey Reports
- Research Institute
- Latest Research Reports
- Opinion Leaders
Secondary Research
- Annual Reports
- White Paper
- Latest Press Release
- Industry Association
- Paid Database
- Investor Presentations

Step 4 - Data Triangulation
Involves using different sources of information in order to increase the validity of a study
These sources are likely to be stakeholders in a program - participants, other researchers, program staff, other community members, and so on.
Then we put all data in single framework & apply various statistical tools to find out the dynamic on the market.
During the analysis stage, feedback from the stakeholder groups would be compared to determine areas of agreement as well as areas of divergence