

Key Insights
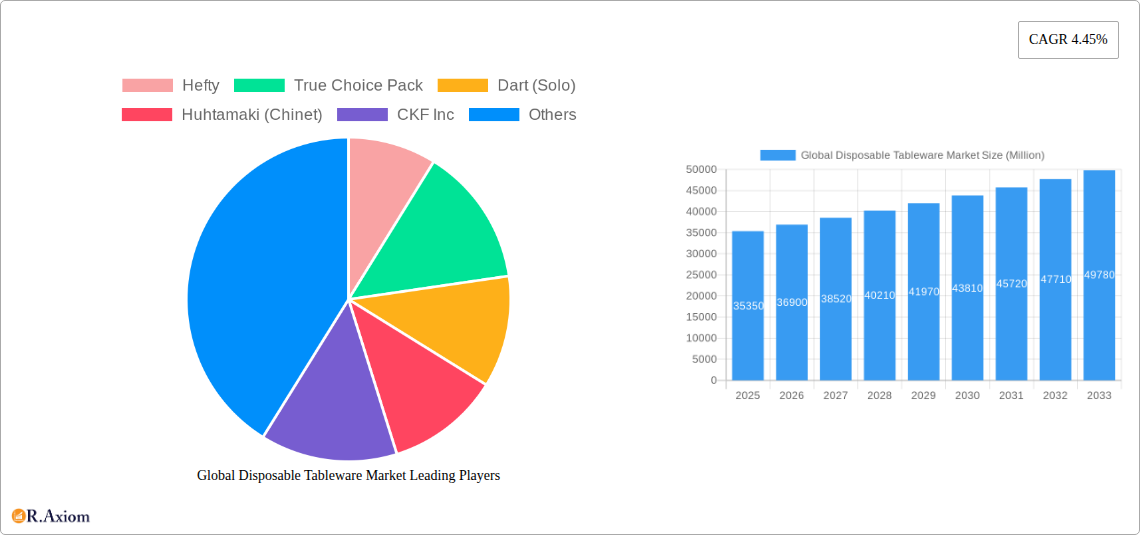
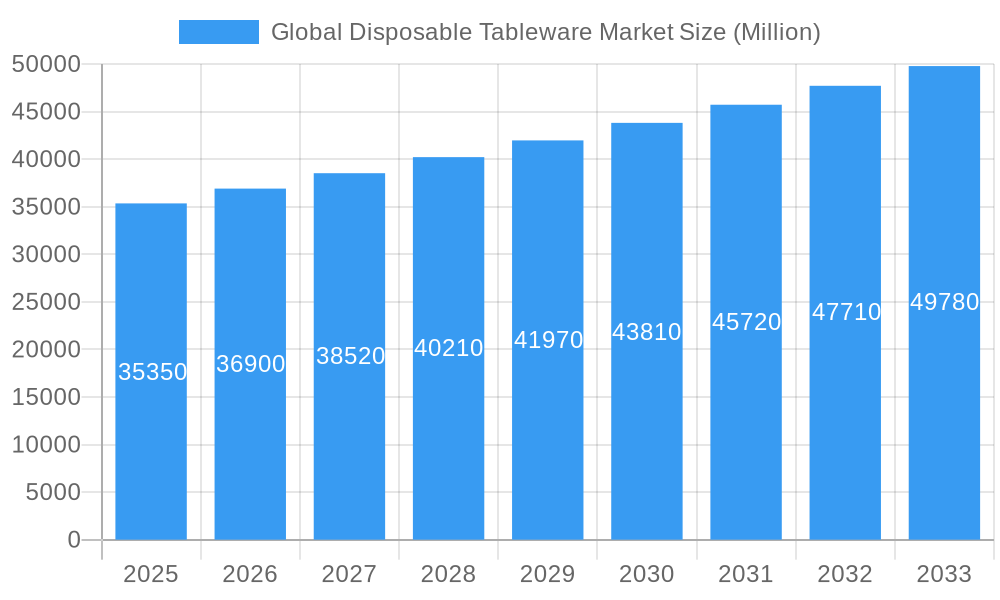
The global disposable tableware market, valued at $35.35 billion in 2025, is projected to experience robust growth, exhibiting a compound annual growth rate (CAGR) of 4.45% from 2025 to 2033. This expansion is driven by several key factors. The rising prevalence of quick-service restaurants (QSRs) and food delivery services fuels significant demand for convenient and cost-effective disposable tableware. Furthermore, increasing consumer preference for single-use products in both residential and commercial settings contributes to market growth. Convenience, hygiene concerns, and the ease of disposal associated with disposable tableware are primary drivers. However, growing environmental concerns regarding plastic waste and increasing awareness of sustainable alternatives present a significant restraint. This is leading to a notable shift towards eco-friendly options like biodegradable and compostable tableware, creating a new segment within the market with considerable growth potential. Regional variations exist, with North America and Asia-Pacific expected to dominate market share due to high consumption levels and robust food service sectors. Key players like Hefty, Dart (Solo), and Huhtamaki (Chinet) are strategically focusing on product innovation and expanding distribution channels to maintain their market presence. The market segmentation by product type (cups, plates, bowls, silverware), application (residential, commercial), and distribution channel (supermarkets, online retailers) further reveals lucrative niche opportunities for businesses.
Global Disposable Tableware Market Market Size (In Billion)
The market's future trajectory hinges on several trends. The increasing demand for sustainable and eco-friendly disposable tableware is pushing manufacturers to invest in research and development of biodegradable and compostable alternatives. Simultaneously, technological advancements in material science are leading to the development of more durable and functional disposable tableware. The rise of e-commerce and online food delivery platforms is also reshaping the distribution landscape, opening new avenues for market expansion. Regulatory changes related to plastic waste management are also shaping the market, incentivizing the adoption of environmentally responsible materials. Competitive pressures are leading to pricing strategies and innovations that ensure cost-effectiveness for both consumers and businesses. The continuing growth of the global population and urbanization further contributes to the overall market expansion.
Global Disposable Tableware Market Company Market Share
This comprehensive report provides an in-depth analysis of the global disposable tableware market, covering market size, growth drivers, challenges, key players, and future trends. The study period spans from 2019 to 2033, with 2025 serving as the base and estimated year. The report offers actionable insights for industry stakeholders, including manufacturers, distributors, and investors.
Global Disposable Tableware Market Concentration & Innovation
This section analyzes the competitive landscape of the global disposable tableware market, focusing on market concentration, innovation drivers, regulatory frameworks, product substitutes, end-user trends, and mergers and acquisitions (M&A) activities.
The market exhibits a moderately concentrated structure, with key players like Hefty, Dart (Solo), Huhtamaki (Chinet), and International Paper holding significant market share. However, the presence of numerous smaller players, particularly in regional markets, indicates a dynamic competitive environment. Precise market share figures for each company vary and are unavailable for all companies without access to proprietary data. We estimate a top 5 market share of approximately xx%.
Innovation in the disposable tableware market is driven by increasing consumer demand for sustainable and eco-friendly products. This has led to a surge in the development of biodegradable and compostable tableware options, made from materials like bagasse and bamboo. Regulatory frameworks, particularly concerning plastic waste reduction, are playing a significant role in shaping industry innovation. For example, bans on single-use plastics in several regions are driving manufacturers to invest in alternative materials and packaging solutions.
Product substitutes, such as reusable tableware and washable alternatives, pose a moderate threat to the disposable market. However, the convenience and affordability of disposable tableware continue to drive significant demand, particularly in commercial settings. M&A activity within the industry is moderate. Deal values vary significantly, depending on the size and strategic importance of the acquired company; however, data on specific M&A deals is not publicly accessible and can be estimated at xx Million in the past 5 years. End-user trends, such as the increasing popularity of takeaway meals and food delivery services, are driving growth in the disposable tableware market.
Global Disposable Tableware Market Industry Trends & Insights
The global disposable tableware market is witnessing robust growth, driven by several key factors. The rising popularity of fast food and quick-service restaurants fuels demand for convenient and cost-effective disposable tableware. Furthermore, the increasing prevalence of food delivery and takeaway services has significantly boosted consumption of disposable plates, cups, and cutlery. Technological advancements in materials science are contributing to the development of more sustainable and eco-friendly alternatives. These developments include the introduction of biodegradable and compostable tableware options, offering consumers a more responsible choice. The adoption of automation and advanced manufacturing techniques is also improving efficiency and lowering production costs. However, consumer preferences towards sustainability are creating a demand for eco-friendly disposable tableware which influences competition dynamics among market players. The market is expected to grow at a Compound Annual Growth Rate (CAGR) of xx% during the forecast period (2025-2033). Market penetration of sustainable options is increasing steadily, but it varies significantly across regions due to factors such as consumer awareness and governmental regulations.
Dominant Markets & Segments in Global Disposable Tableware Market
Several segments and regions are driving the growth of the global disposable tableware market.
- By Product Type: Disposable plates dominate the market due to their widespread use in both residential and commercial settings. Disposable cups and bowls follow, with strong demand in food service and beverage sectors. Disposable silverware holds a comparatively smaller share due to growing popularity of reusable cutlery options. Other product types (e.g., napkins, straws) contribute significantly.
- By Application: The commercial segment, including restaurants, cafes, and event venues, is the largest contributor, owing to high consumption volumes. The residential segment shows steady growth fueled by increased consumption of ready-made food and convenience meals.
- By Distribution Channel: Hypermarkets and supermarkets represent the largest distribution channel, offering wide availability and convenience. Convenience stores and online channels are showing rapid growth, driven by increased consumer access and convenience.
- By Region: North America holds the largest market share due to the high consumption of disposable tableware in the food service industry and the presence of major players. The Asia-Pacific region is expected to show significant growth during the forecast period, driven by rapid urbanization, economic growth, and rising disposable incomes. Europe follows similar trends, showing steady market growth.
Key drivers for dominance vary across segments and regions: North America’s dominance stems from established foodservice culture, high disposable incomes, and the presence of major manufacturers. Asia-Pacific’s growth is linked to increasing urbanization and rising disposable incomes, while Europe's growth is related to strong consumer demand and an increased focus on sustainable products. Similarly, growth within each region and segment is significantly impacted by both economic conditions and the degree of awareness and availability of ecologically responsible products.
Global Disposable Tableware Market Product Developments
Recent product innovations focus on sustainability and convenience. Manufacturers are increasingly incorporating biodegradable and compostable materials into their products, driven by growing consumer awareness of environmental issues. Technological advancements in material science are creating new possibilities for sustainable packaging and tableware, enhancing both material properties and eco-friendly performance. The market also sees the development of more innovative designs and sizes to better suit various applications. The integration of compostable or recyclable packaging enhances the appeal of the products and aligns with increasingly conscious consumer preferences.
Report Scope & Segmentation Analysis
This report segments the global disposable tableware market by product type (disposable cups, plates, bowls, silverware, other), application (residential, commercial), distribution channel (hypermarkets/supermarkets, convenience stores, online, others), and region (North America, Canada, Asia-Pacific, Rest of Asia-Pacific, Europe, Rest of Europe, South America, Rest of South America, Middle East & Africa). Each segment's growth projections, market sizes, and competitive dynamics are analyzed extensively. Growth projections vary widely; for example, while the Asia-Pacific region is projected to experience substantial growth, the rate will depend on factors such as economic development, evolving consumer lifestyles and government policies.
Key Drivers of Global Disposable Tableware Market Growth
Several factors drive the growth of the disposable tableware market. These include the expansion of the food service industry, particularly fast food and takeaway services; the rise in disposable income and changing consumer lifestyles (convenience over sustainability); and technological advancements leading to innovative, sustainable product offerings. Government regulations focusing on plastic waste management are also indirectly boosting the adoption of eco-friendly alternatives. All of these factors result in an increased market demand.
Challenges in the Global Disposable Tableware Market Sector
Significant challenges exist within the disposable tableware market. Fluctuations in raw material prices impact production costs. Stringent environmental regulations and consumer pressure for sustainable products pose a challenge to companies relying on traditional non-sustainable materials. Intense competition among manufacturers and the availability of cheaper, albeit less sustainable products are also critical hurdles to consider. These challenges collectively influence production costs and market pricing strategies.
Emerging Opportunities in Global Disposable Tableware Market
Emerging opportunities reside in the growing demand for sustainable and eco-friendly options. The development of biodegradable and compostable tableware offers significant growth potential. Expansion into new and developing markets, especially in regions with rapidly growing populations and changing consumer lifestyles, represents another major opportunity. Furthermore, technological innovation in material science and manufacturing processes offer additional opportunities for market expansion.
Leading Players in the Global Disposable Tableware Market Market
- Hefty
- True Choice Pack
- Dart (Solo)
- Huhtamaki (Chinet)
- CKF Inc
- Natural Tableware
- Letica
- Dixie
- Solia
- Lollicup USA
- International Paper
Key Developments in Global Disposable Tableware Market Industry
- August 2023: Hefty relaunched its Hefty Zoo Pals plates, boosting appeal among children and families.
- February 2022: Huhtamaki collaborated with Carte D'OR to switch to recyclable paper ice cream tubs and lids, reducing plastic waste.
Strategic Outlook for Global Disposable Tableware Market Market
The future of the global disposable tableware market is bright, fueled by the continued growth of the food service industry and increasing consumer demand. The focus on sustainability will continue to drive innovation, with manufacturers increasingly adopting eco-friendly materials and production processes. Expansion into emerging markets and the development of innovative products will further propel market growth. Companies with a strong focus on sustainability and innovation are poised to capture significant market share in the coming years.
Global Disposable Tableware Market Segmentation
-
1. Product Type
- 1.1. Disposable Cups
- 1.2. Disposable Plates
- 1.3. Disposable Bowls
- 1.4. Disposable Silverware
- 1.5. Other Product Types
-
2. Application
- 2.1. Residential
- 2.2. Commercial
-
3. Distribution Channel
- 3.1. Hypermarkets and Supermarkets
- 3.2. Convenience Stores
- 3.3. Online
- 3.4. Other Distribution Channels
Global Disposable Tableware Market Segmentation By Geography
-
1. North America
- 1.1. United States
- 1.2. Canada
- 1.3. Mexico
-
2. South America
- 2.1. Brazil
- 2.2. Argentina
- 2.3. Rest of South America
-
3. Europe
- 3.1. United Kingdom
- 3.2. Germany
- 3.3. France
- 3.4. Italy
- 3.5. Spain
- 3.6. Russia
- 3.7. Benelux
- 3.8. Nordics
- 3.9. Rest of Europe
-
4. Middle East & Africa
- 4.1. Turkey
- 4.2. Israel
- 4.3. GCC
- 4.4. North Africa
- 4.5. South Africa
- 4.6. Rest of Middle East & Africa
-
5. Asia Pacific
- 5.1. China
- 5.2. India
- 5.3. Japan
- 5.4. South Korea
- 5.5. ASEAN
- 5.6. Oceania
- 5.7. Rest of Asia Pacific
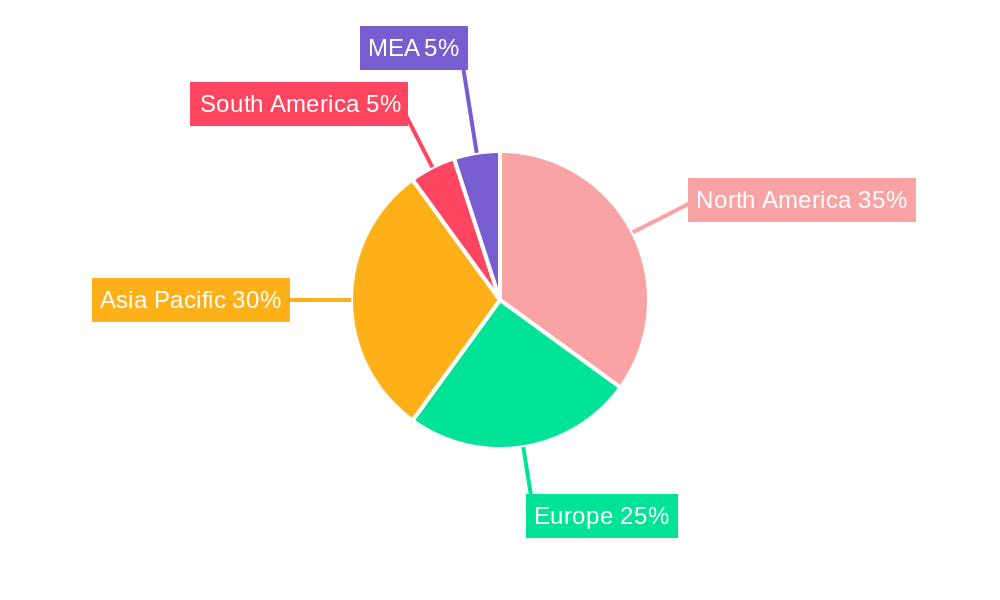
Global Disposable Tableware Market Regional Market Share
Geographic Coverage of Global Disposable Tableware Market
Global Disposable Tableware Market REPORT HIGHLIGHTS
| Aspects | Details |
|---|---|
| Study Period | 2020-2034 |
| Base Year | 2025 |
| Estimated Year | 2026 |
| Forecast Period | 2026-2034 |
| Historical Period | 2020-2025 |
| Growth Rate | CAGR of 4.45% from 2020-2034 |
| Segmentation |
|
Table of Contents
- 1. Introduction
- 1.1. Research Scope
- 1.2. Market Segmentation
- 1.3. Research Objective
- 1.4. Definitions and Assumptions
- 2. Executive Summary
- 2.1. Market Snapshot
- 3. Market Dynamics
- 3.1. Market Drivers
- 3.2. Market Restrains
- 3.3. Market Trends
- 3.4. Market Opportunities
- 4. Market Factor Analysis
- 4.1. Porters Five Forces
- 4.1.1. Bargaining Power of Suppliers
- 4.1.2. Bargaining Power of Buyers
- 4.1.3. Threat of New Entrants
- 4.1.4. Threat of Substitutes
- 4.1.5. Competitive Rivalry
- 4.2. PESTEL analysis
- 4.3. BCG Analysis
- 4.3.1. Stars (High Growth, High Market Share)
- 4.3.2. Cash Cows (Low Growth, High Market Share)
- 4.3.3. Question Mark (High Growth, Low Market Share)
- 4.3.4. Dogs (Low Growth, Low Market Share)
- 4.4. Ansoff Matrix Analysis
- 4.5. Supply Chain Analysis
- 4.6. Regulatory Landscape
- 4.7. Current Market Potential and Opportunity Assessment (TAM–SAM–SOM Framework)
- 4.8. RAX Analyst Note
- 4.1. Porters Five Forces
- 5. Market Analysis, Insights and Forecast 2021-2033
- 5.1. Market Analysis, Insights and Forecast - by Product Type
- 5.1.1. Disposable Cups
- 5.1.2. Disposable Plates
- 5.1.3. Disposable Bowls
- 5.1.4. Disposable Silverware
- 5.1.5. Other Product Types
- 5.2. Market Analysis, Insights and Forecast - by Application
- 5.2.1. Residential
- 5.2.2. Commercial
- 5.3. Market Analysis, Insights and Forecast - by Distribution Channel
- 5.3.1. Hypermarkets and Supermarkets
- 5.3.2. Convenience Stores
- 5.3.3. Online
- 5.3.4. Other Distribution Channels
- 5.4. Market Analysis, Insights and Forecast - by Region
- 5.4.1. North America
- 5.4.2. South America
- 5.4.3. Europe
- 5.4.4. Middle East & Africa
- 5.4.5. Asia Pacific
- 5.1. Market Analysis, Insights and Forecast - by Product Type
- 6. Global Disposable Tableware Market Analysis, Insights and Forecast, 2021-2033
- 6.1. Market Analysis, Insights and Forecast - by Product Type
- 6.1.1. Disposable Cups
- 6.1.2. Disposable Plates
- 6.1.3. Disposable Bowls
- 6.1.4. Disposable Silverware
- 6.1.5. Other Product Types
- 6.2. Market Analysis, Insights and Forecast - by Application
- 6.2.1. Residential
- 6.2.2. Commercial
- 6.3. Market Analysis, Insights and Forecast - by Distribution Channel
- 6.3.1. Hypermarkets and Supermarkets
- 6.3.2. Convenience Stores
- 6.3.3. Online
- 6.3.4. Other Distribution Channels
- 6.1. Market Analysis, Insights and Forecast - by Product Type
- 7. North America Global Disposable Tableware Market Analysis, Insights and Forecast, 2020-2032
- 7.1. Market Analysis, Insights and Forecast - by Product Type
- 7.1.1. Disposable Cups
- 7.1.2. Disposable Plates
- 7.1.3. Disposable Bowls
- 7.1.4. Disposable Silverware
- 7.1.5. Other Product Types
- 7.2. Market Analysis, Insights and Forecast - by Application
- 7.2.1. Residential
- 7.2.2. Commercial
- 7.3. Market Analysis, Insights and Forecast - by Distribution Channel
- 7.3.1. Hypermarkets and Supermarkets
- 7.3.2. Convenience Stores
- 7.3.3. Online
- 7.3.4. Other Distribution Channels
- 7.1. Market Analysis, Insights and Forecast - by Product Type
- 8. South America Global Disposable Tableware Market Analysis, Insights and Forecast, 2020-2032
- 8.1. Market Analysis, Insights and Forecast - by Product Type
- 8.1.1. Disposable Cups
- 8.1.2. Disposable Plates
- 8.1.3. Disposable Bowls
- 8.1.4. Disposable Silverware
- 8.1.5. Other Product Types
- 8.2. Market Analysis, Insights and Forecast - by Application
- 8.2.1. Residential
- 8.2.2. Commercial
- 8.3. Market Analysis, Insights and Forecast - by Distribution Channel
- 8.3.1. Hypermarkets and Supermarkets
- 8.3.2. Convenience Stores
- 8.3.3. Online
- 8.3.4. Other Distribution Channels
- 8.1. Market Analysis, Insights and Forecast - by Product Type
- 9. Europe Global Disposable Tableware Market Analysis, Insights and Forecast, 2020-2032
- 9.1. Market Analysis, Insights and Forecast - by Product Type
- 9.1.1. Disposable Cups
- 9.1.2. Disposable Plates
- 9.1.3. Disposable Bowls
- 9.1.4. Disposable Silverware
- 9.1.5. Other Product Types
- 9.2. Market Analysis, Insights and Forecast - by Application
- 9.2.1. Residential
- 9.2.2. Commercial
- 9.3. Market Analysis, Insights and Forecast - by Distribution Channel
- 9.3.1. Hypermarkets and Supermarkets
- 9.3.2. Convenience Stores
- 9.3.3. Online
- 9.3.4. Other Distribution Channels
- 9.1. Market Analysis, Insights and Forecast - by Product Type
- 10. Middle East & Africa Global Disposable Tableware Market Analysis, Insights and Forecast, 2020-2032
- 10.1. Market Analysis, Insights and Forecast - by Product Type
- 10.1.1. Disposable Cups
- 10.1.2. Disposable Plates
- 10.1.3. Disposable Bowls
- 10.1.4. Disposable Silverware
- 10.1.5. Other Product Types
- 10.2. Market Analysis, Insights and Forecast - by Application
- 10.2.1. Residential
- 10.2.2. Commercial
- 10.3. Market Analysis, Insights and Forecast - by Distribution Channel
- 10.3.1. Hypermarkets and Supermarkets
- 10.3.2. Convenience Stores
- 10.3.3. Online
- 10.3.4. Other Distribution Channels
- 10.1. Market Analysis, Insights and Forecast - by Product Type
- 11. Asia Pacific Global Disposable Tableware Market Analysis, Insights and Forecast, 2020-2032
- 11.1. Market Analysis, Insights and Forecast - by Product Type
- 11.1.1. Disposable Cups
- 11.1.2. Disposable Plates
- 11.1.3. Disposable Bowls
- 11.1.4. Disposable Silverware
- 11.1.5. Other Product Types
- 11.2. Market Analysis, Insights and Forecast - by Application
- 11.2.1. Residential
- 11.2.2. Commercial
- 11.3. Market Analysis, Insights and Forecast - by Distribution Channel
- 11.3.1. Hypermarkets and Supermarkets
- 11.3.2. Convenience Stores
- 11.3.3. Online
- 11.3.4. Other Distribution Channels
- 11.1. Market Analysis, Insights and Forecast - by Product Type
- 12. Competitive Analysis
- 12.1. Company Profiles
- 12.1.1 Hefty
- 12.1.1.1. Company Overview
- 12.1.1.2. Products
- 12.1.1.3. Company Financials
- 12.1.1.4. SWOT Analysis
- 12.1.2 True Choice Pack
- 12.1.2.1. Company Overview
- 12.1.2.2. Products
- 12.1.2.3. Company Financials
- 12.1.2.4. SWOT Analysis
- 12.1.3 Dart (Solo)
- 12.1.3.1. Company Overview
- 12.1.3.2. Products
- 12.1.3.3. Company Financials
- 12.1.3.4. SWOT Analysis
- 12.1.4 Huhtamaki (Chinet)
- 12.1.4.1. Company Overview
- 12.1.4.2. Products
- 12.1.4.3. Company Financials
- 12.1.4.4. SWOT Analysis
- 12.1.5 CKF Inc
- 12.1.5.1. Company Overview
- 12.1.5.2. Products
- 12.1.5.3. Company Financials
- 12.1.5.4. SWOT Analysis
- 12.1.6 Natural Tableware
- 12.1.6.1. Company Overview
- 12.1.6.2. Products
- 12.1.6.3. Company Financials
- 12.1.6.4. SWOT Analysis
- 12.1.7 Letica**List Not Exhaustive
- 12.1.7.1. Company Overview
- 12.1.7.2. Products
- 12.1.7.3. Company Financials
- 12.1.7.4. SWOT Analysis
- 12.1.8 Dixie
- 12.1.8.1. Company Overview
- 12.1.8.2. Products
- 12.1.8.3. Company Financials
- 12.1.8.4. SWOT Analysis
- 12.1.9 Solia
- 12.1.9.1. Company Overview
- 12.1.9.2. Products
- 12.1.9.3. Company Financials
- 12.1.9.4. SWOT Analysis
- 12.1.10 Lollicup USA
- 12.1.10.1. Company Overview
- 12.1.10.2. Products
- 12.1.10.3. Company Financials
- 12.1.10.4. SWOT Analysis
- 12.1.11 International Paper
- 12.1.11.1. Company Overview
- 12.1.11.2. Products
- 12.1.11.3. Company Financials
- 12.1.11.4. SWOT Analysis
- 12.1.1 Hefty
- 12.2. Market Entropy
- 12.2.1 Company's Key Areas Served
- 12.2.2 Recent Developments
- 12.3. Company Market Share Analysis 2025
- 12.3.1 Top 5 Companies Market Share Analysis
- 12.3.2 Top 3 Companies Market Share Analysis
- 12.4. List of Potential Customers
- 13. Research Methodology
List of Figures
- Figure 1: Global Global Disposable Tableware Market Revenue Breakdown (Million, %) by Region 2025 & 2033
- Figure 2: North America Global Disposable Tableware Market Revenue (Million), by Product Type 2025 & 2033
- Figure 3: North America Global Disposable Tableware Market Revenue Share (%), by Product Type 2025 & 2033
- Figure 4: North America Global Disposable Tableware Market Revenue (Million), by Application 2025 & 2033
- Figure 5: North America Global Disposable Tableware Market Revenue Share (%), by Application 2025 & 2033
- Figure 6: North America Global Disposable Tableware Market Revenue (Million), by Distribution Channel 2025 & 2033
- Figure 7: North America Global Disposable Tableware Market Revenue Share (%), by Distribution Channel 2025 & 2033
- Figure 8: North America Global Disposable Tableware Market Revenue (Million), by Country 2025 & 2033
- Figure 9: North America Global Disposable Tableware Market Revenue Share (%), by Country 2025 & 2033
- Figure 10: South America Global Disposable Tableware Market Revenue (Million), by Product Type 2025 & 2033
- Figure 11: South America Global Disposable Tableware Market Revenue Share (%), by Product Type 2025 & 2033
- Figure 12: South America Global Disposable Tableware Market Revenue (Million), by Application 2025 & 2033
- Figure 13: South America Global Disposable Tableware Market Revenue Share (%), by Application 2025 & 2033
- Figure 14: South America Global Disposable Tableware Market Revenue (Million), by Distribution Channel 2025 & 2033
- Figure 15: South America Global Disposable Tableware Market Revenue Share (%), by Distribution Channel 2025 & 2033
- Figure 16: South America Global Disposable Tableware Market Revenue (Million), by Country 2025 & 2033
- Figure 17: South America Global Disposable Tableware Market Revenue Share (%), by Country 2025 & 2033
- Figure 18: Europe Global Disposable Tableware Market Revenue (Million), by Product Type 2025 & 2033
- Figure 19: Europe Global Disposable Tableware Market Revenue Share (%), by Product Type 2025 & 2033
- Figure 20: Europe Global Disposable Tableware Market Revenue (Million), by Application 2025 & 2033
- Figure 21: Europe Global Disposable Tableware Market Revenue Share (%), by Application 2025 & 2033
- Figure 22: Europe Global Disposable Tableware Market Revenue (Million), by Distribution Channel 2025 & 2033
- Figure 23: Europe Global Disposable Tableware Market Revenue Share (%), by Distribution Channel 2025 & 2033
- Figure 24: Europe Global Disposable Tableware Market Revenue (Million), by Country 2025 & 2033
- Figure 25: Europe Global Disposable Tableware Market Revenue Share (%), by Country 2025 & 2033
- Figure 26: Middle East & Africa Global Disposable Tableware Market Revenue (Million), by Product Type 2025 & 2033
- Figure 27: Middle East & Africa Global Disposable Tableware Market Revenue Share (%), by Product Type 2025 & 2033
- Figure 28: Middle East & Africa Global Disposable Tableware Market Revenue (Million), by Application 2025 & 2033
- Figure 29: Middle East & Africa Global Disposable Tableware Market Revenue Share (%), by Application 2025 & 2033
- Figure 30: Middle East & Africa Global Disposable Tableware Market Revenue (Million), by Distribution Channel 2025 & 2033
- Figure 31: Middle East & Africa Global Disposable Tableware Market Revenue Share (%), by Distribution Channel 2025 & 2033
- Figure 32: Middle East & Africa Global Disposable Tableware Market Revenue (Million), by Country 2025 & 2033
- Figure 33: Middle East & Africa Global Disposable Tableware Market Revenue Share (%), by Country 2025 & 2033
- Figure 34: Asia Pacific Global Disposable Tableware Market Revenue (Million), by Product Type 2025 & 2033
- Figure 35: Asia Pacific Global Disposable Tableware Market Revenue Share (%), by Product Type 2025 & 2033
- Figure 36: Asia Pacific Global Disposable Tableware Market Revenue (Million), by Application 2025 & 2033
- Figure 37: Asia Pacific Global Disposable Tableware Market Revenue Share (%), by Application 2025 & 2033
- Figure 38: Asia Pacific Global Disposable Tableware Market Revenue (Million), by Distribution Channel 2025 & 2033
- Figure 39: Asia Pacific Global Disposable Tableware Market Revenue Share (%), by Distribution Channel 2025 & 2033
- Figure 40: Asia Pacific Global Disposable Tableware Market Revenue (Million), by Country 2025 & 2033
- Figure 41: Asia Pacific Global Disposable Tableware Market Revenue Share (%), by Country 2025 & 2033
List of Tables
- Table 1: Global Disposable Tableware Market Revenue Million Forecast, by Product Type 2020 & 2033
- Table 2: Global Disposable Tableware Market Revenue Million Forecast, by Application 2020 & 2033
- Table 3: Global Disposable Tableware Market Revenue Million Forecast, by Distribution Channel 2020 & 2033
- Table 4: Global Disposable Tableware Market Revenue Million Forecast, by Region 2020 & 2033
- Table 5: Global Disposable Tableware Market Revenue Million Forecast, by Product Type 2020 & 2033
- Table 6: Global Disposable Tableware Market Revenue Million Forecast, by Application 2020 & 2033
- Table 7: Global Disposable Tableware Market Revenue Million Forecast, by Distribution Channel 2020 & 2033
- Table 8: Global Disposable Tableware Market Revenue Million Forecast, by Country 2020 & 2033
- Table 9: United States Global Disposable Tableware Market Revenue (Million) Forecast, by Application 2020 & 2033
- Table 10: Canada Global Disposable Tableware Market Revenue (Million) Forecast, by Application 2020 & 2033
- Table 11: Mexico Global Disposable Tableware Market Revenue (Million) Forecast, by Application 2020 & 2033
- Table 12: Global Disposable Tableware Market Revenue Million Forecast, by Product Type 2020 & 2033
- Table 13: Global Disposable Tableware Market Revenue Million Forecast, by Application 2020 & 2033
- Table 14: Global Disposable Tableware Market Revenue Million Forecast, by Distribution Channel 2020 & 2033
- Table 15: Global Disposable Tableware Market Revenue Million Forecast, by Country 2020 & 2033
- Table 16: Brazil Global Disposable Tableware Market Revenue (Million) Forecast, by Application 2020 & 2033
- Table 17: Argentina Global Disposable Tableware Market Revenue (Million) Forecast, by Application 2020 & 2033
- Table 18: Rest of South America Global Disposable Tableware Market Revenue (Million) Forecast, by Application 2020 & 2033
- Table 19: Global Disposable Tableware Market Revenue Million Forecast, by Product Type 2020 & 2033
- Table 20: Global Disposable Tableware Market Revenue Million Forecast, by Application 2020 & 2033
- Table 21: Global Disposable Tableware Market Revenue Million Forecast, by Distribution Channel 2020 & 2033
- Table 22: Global Disposable Tableware Market Revenue Million Forecast, by Country 2020 & 2033
- Table 23: United Kingdom Global Disposable Tableware Market Revenue (Million) Forecast, by Application 2020 & 2033
- Table 24: Germany Global Disposable Tableware Market Revenue (Million) Forecast, by Application 2020 & 2033
- Table 25: France Global Disposable Tableware Market Revenue (Million) Forecast, by Application 2020 & 2033
- Table 26: Italy Global Disposable Tableware Market Revenue (Million) Forecast, by Application 2020 & 2033
- Table 27: Spain Global Disposable Tableware Market Revenue (Million) Forecast, by Application 2020 & 2033
- Table 28: Russia Global Disposable Tableware Market Revenue (Million) Forecast, by Application 2020 & 2033
- Table 29: Benelux Global Disposable Tableware Market Revenue (Million) Forecast, by Application 2020 & 2033
- Table 30: Nordics Global Disposable Tableware Market Revenue (Million) Forecast, by Application 2020 & 2033
- Table 31: Rest of Europe Global Disposable Tableware Market Revenue (Million) Forecast, by Application 2020 & 2033
- Table 32: Global Disposable Tableware Market Revenue Million Forecast, by Product Type 2020 & 2033
- Table 33: Global Disposable Tableware Market Revenue Million Forecast, by Application 2020 & 2033
- Table 34: Global Disposable Tableware Market Revenue Million Forecast, by Distribution Channel 2020 & 2033
- Table 35: Global Disposable Tableware Market Revenue Million Forecast, by Country 2020 & 2033
- Table 36: Turkey Global Disposable Tableware Market Revenue (Million) Forecast, by Application 2020 & 2033
- Table 37: Israel Global Disposable Tableware Market Revenue (Million) Forecast, by Application 2020 & 2033
- Table 38: GCC Global Disposable Tableware Market Revenue (Million) Forecast, by Application 2020 & 2033
- Table 39: North Africa Global Disposable Tableware Market Revenue (Million) Forecast, by Application 2020 & 2033
- Table 40: South Africa Global Disposable Tableware Market Revenue (Million) Forecast, by Application 2020 & 2033
- Table 41: Rest of Middle East & Africa Global Disposable Tableware Market Revenue (Million) Forecast, by Application 2020 & 2033
- Table 42: Global Disposable Tableware Market Revenue Million Forecast, by Product Type 2020 & 2033
- Table 43: Global Disposable Tableware Market Revenue Million Forecast, by Application 2020 & 2033
- Table 44: Global Disposable Tableware Market Revenue Million Forecast, by Distribution Channel 2020 & 2033
- Table 45: Global Disposable Tableware Market Revenue Million Forecast, by Country 2020 & 2033
- Table 46: China Global Disposable Tableware Market Revenue (Million) Forecast, by Application 2020 & 2033
- Table 47: India Global Disposable Tableware Market Revenue (Million) Forecast, by Application 2020 & 2033
- Table 48: Japan Global Disposable Tableware Market Revenue (Million) Forecast, by Application 2020 & 2033
- Table 49: South Korea Global Disposable Tableware Market Revenue (Million) Forecast, by Application 2020 & 2033
- Table 50: ASEAN Global Disposable Tableware Market Revenue (Million) Forecast, by Application 2020 & 2033
- Table 51: Oceania Global Disposable Tableware Market Revenue (Million) Forecast, by Application 2020 & 2033
- Table 52: Rest of Asia Pacific Global Disposable Tableware Market Revenue (Million) Forecast, by Application 2020 & 2033
Frequently Asked Questions
1. What is the projected Compound Annual Growth Rate (CAGR) of the Global Disposable Tableware Market?
The projected CAGR is approximately 4.45%.
2. Which companies are prominent players in the Global Disposable Tableware Market?
Key companies in the market include Hefty, True Choice Pack, Dart (Solo), Huhtamaki (Chinet), CKF Inc, Natural Tableware, Letica**List Not Exhaustive, Dixie, Solia, Lollicup USA, International Paper.
3. What are the main segments of the Global Disposable Tableware Market?
The market segments include Product Type, Application, Distribution Channel.
4. Can you provide details about the market size?
The market size is estimated to be USD 35.35 Million as of 2022.
5. What are some drivers contributing to market growth?
Rise of Affrodable Disposable Tableware; Growing Urbanisation is Driving Need for Easy to Use Tableware.
6. What are the notable trends driving market growth?
Increasing Popularity of Online Retailing for Disposable Tableware.
7. Are there any restraints impacting market growth?
Changing Needs and Taste of Customers; Limited Usage of the Product.
8. Can you provide examples of recent developments in the market?
In August 2023, the Hefty brand brought back Hefty Zoo Pals plates. Zoo Pals plates are colorful paper plates featuring original, loveable animal "Pals" like Curly the Pig, Domino the Dalmatian, and more. This makes the product line popular amongst the kids and parents.
9. What pricing options are available for accessing the report?
Pricing options include single-user, multi-user, and enterprise licenses priced at USD 4750, USD 5250, and USD 8750 respectively.
10. Is the market size provided in terms of value or volume?
The market size is provided in terms of value, measured in Million.
11. Are there any specific market keywords associated with the report?
Yes, the market keyword associated with the report is "Global Disposable Tableware Market," which aids in identifying and referencing the specific market segment covered.
12. How do I determine which pricing option suits my needs best?
The pricing options vary based on user requirements and access needs. Individual users may opt for single-user licenses, while businesses requiring broader access may choose multi-user or enterprise licenses for cost-effective access to the report.
13. Are there any additional resources or data provided in the Global Disposable Tableware Market report?
While the report offers comprehensive insights, it's advisable to review the specific contents or supplementary materials provided to ascertain if additional resources or data are available.
14. How can I stay updated on further developments or reports in the Global Disposable Tableware Market?
To stay informed about further developments, trends, and reports in the Global Disposable Tableware Market, consider subscribing to industry newsletters, following relevant companies and organizations, or regularly checking reputable industry news sources and publications.
Methodology
Step 1 - Identification of Relevant Samples Size from Population Database


Step 2 - Approaches for Defining Global Market Size (Value, Volume* & Price*)

Note*: In applicable scenarios
Step 3 - Data Sources
Primary Research
- Web Analytics
- Survey Reports
- Research Institute
- Latest Research Reports
- Opinion Leaders
Secondary Research
- Annual Reports
- White Paper
- Latest Press Release
- Industry Association
- Paid Database
- Investor Presentations

Step 4 - Data Triangulation
Involves using different sources of information in order to increase the validity of a study
These sources are likely to be stakeholders in a program - participants, other researchers, program staff, other community members, and so on.
Then we put all data in single framework & apply various statistical tools to find out the dynamic on the market.
During the analysis stage, feedback from the stakeholder groups would be compared to determine areas of agreement as well as areas of divergence