Key Insights
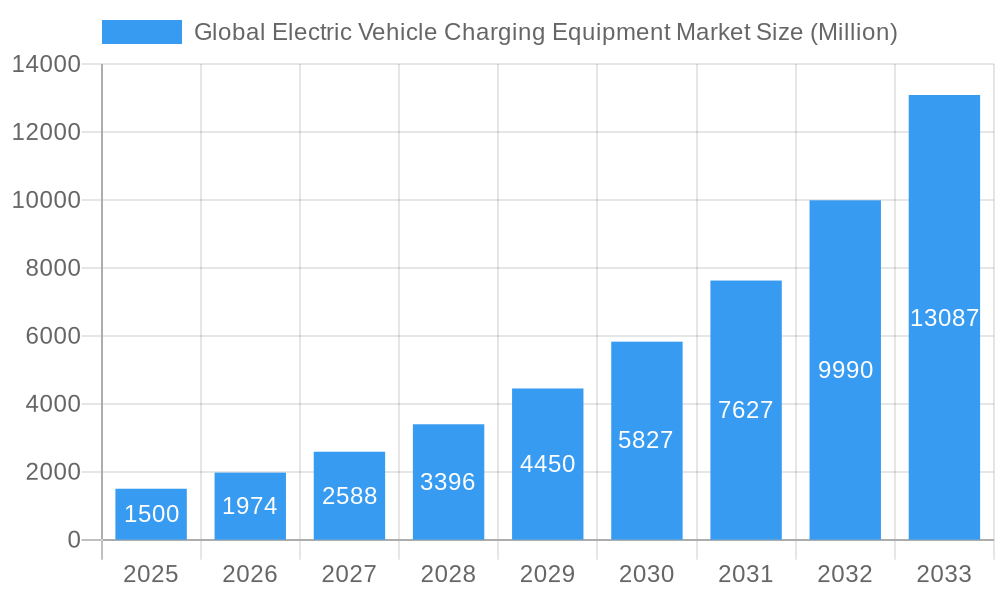
The global electric vehicle (EV) charging equipment market is experiencing substantial growth, propelled by widespread EV adoption and favorable government initiatives for sustainable transportation. The market, valued at $28.46 billion in 2025, is projected for significant expansion throughout the forecast period (2025-2033) with an estimated CAGR of 15.1%. This growth is driven by expanding EV infrastructure, advancements in charging technology (including faster charging speeds and improved efficiency), and increasing consumer demand for convenient charging solutions. The market is segmented by application (residential, commercial, and public charging) and charging type (AC and DC charging). DC fast charging is anticipated to lead growth due to its ability to substantially reduce charging times. While North America and Europe currently lead market share due to established EV adoption and charging networks, the Asia-Pacific region is set for rapid expansion, fueled by rising EV production and sales in key markets like China and India. The market features intense competition from established players such as ABB and ChargePoint, alongside innovative emerging companies.
Global Electric Vehicle Charging Equipment Market Market Size (In Billion)
Key market trends include the integration of smart grid technologies to enhance charging infrastructure efficiency and grid stability. The growing adoption of Vehicle-to-Grid (V2G) technology, enabling EVs to supply energy back to the grid, will further shape the market. Potential restraints include high initial investment costs for infrastructure, concerns regarding reliability, and uneven geographical distribution of charging stations. Overcoming these challenges through public-private partnerships and technological innovation is crucial for sustained market expansion. The future of the EV charging equipment market depends on continuous technological advancements, supportive regulatory frameworks, and increased EV adoption globally.
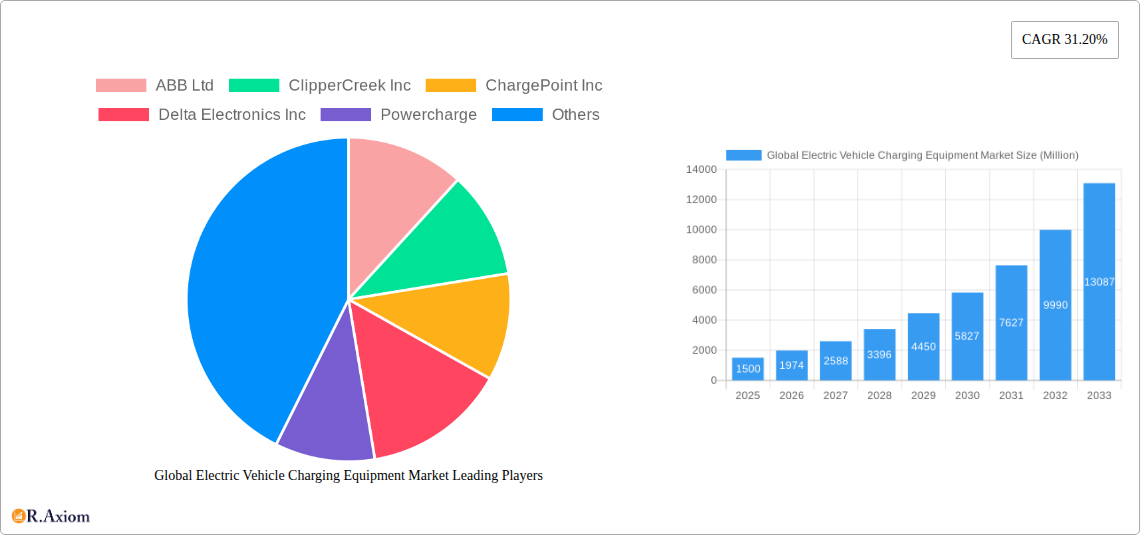
Global Electric Vehicle Charging Equipment Market Company Market Share
Global Electric Vehicle Charging Equipment Market: A Comprehensive Report (2019-2033)
This comprehensive report provides a detailed analysis of the global electric vehicle (EV) charging equipment market, offering invaluable insights for industry stakeholders, investors, and policymakers. The study covers the period from 2019 to 2033, with 2025 as the base year and a forecast period spanning 2025-2033. The report utilizes rigorous data analysis and expert insights to present a holistic view of this rapidly evolving market. Key segments analyzed include charging application (home, workplace, public), charging type (AC Level 1 & 2, DC), and leading geographical markets. The report also features detailed company profiles of key players, including ABB Ltd, ClipperCreek Inc, ChargePoint Inc, Delta Electronics Inc, Powercharge, Siemens AG, Tesla Inc, Robert Bosch GmbH, Exicom Tele-Systems Ltd, and Ather Energy (list not exhaustive).
Global Electric Vehicle Charging Equipment Market Market Concentration & Innovation
This section analyzes the competitive landscape of the global EV charging equipment market, exploring market concentration, innovation drivers, regulatory influences, and the impact of mergers and acquisitions (M&A) activities. The market is characterized by a moderately concentrated structure, with a few dominant players and several smaller niche players. Market share analysis reveals that the top five players hold approximately xx% of the market share in 2025, while the remaining share is dispersed among numerous smaller players. Innovation is a key driver, with companies constantly developing new technologies to improve charging speeds, efficiency, and user experience. Government regulations play a crucial role in shaping market growth, with incentives and mandates promoting EV adoption and charging infrastructure development. M&A activities are also significant, with major players engaged in strategic acquisitions to expand their market reach and technological capabilities. The total value of M&A deals in the sector from 2019-2024 reached approximately xx Million USD. Several examples include:
- Strategic partnerships to expand charging networks.
- Acquisitions of smaller companies with specialized technologies.
- Joint ventures to develop new charging solutions.
The analysis also examines the impact of product substitutes (e.g., alternative energy sources for vehicles) and evolving end-user trends, influencing the adoption of different charging solutions.
Global Electric Vehicle Charging Equipment Market Industry Trends & Insights
The global EV charging equipment market is experiencing robust growth, driven by increasing electric vehicle sales and government support for EV infrastructure development. The Compound Annual Growth Rate (CAGR) from 2025 to 2033 is projected to be xx%, indicating significant market expansion. Technological advancements, particularly in fast and ultra-fast charging technologies, are transforming the market landscape. Consumer preferences are shifting towards convenient and reliable charging solutions, fueling demand for advanced features like smart charging and mobile payment options. The competitive dynamics are intense, with established players and new entrants vying for market share through product innovation, strategic partnerships, and expansion into new geographic markets. Market penetration of EV charging stations is expected to increase significantly, reaching xx% by 2033, with considerable variation across regions. Several factors are impacting this growth including:
- Increased consumer demand for electric vehicles.
- Expanding public and private charging networks.
- Technological advancements resulting in more efficient and reliable chargers.
- Favorable government policies and incentives.
Dominant Markets & Segments in Global Electric Vehicle Charging Equipment Market
The report identifies key geographical regions and market segments driving market growth. While specific regional dominance varies depending on the segment, several key trends emerge.
Leading Regions: The [Region Name, e.g., North America/Europe/Asia-Pacific] region is projected to dominate the market due to factors like high EV adoption rates, extensive government support, and well-established charging infrastructure.
Dominant Application: Public charging stations are experiencing the highest growth among different application segments because of their accessibility and demand. The workplace charging segment is also growing rapidly as businesses increasingly adopt strategies to support employee EV adoption.
Leading Charging Type: DC fast charging is experiencing significant growth due to reduced charging times, making it ideal for public and long-distance travel applications. However, AC charging remains essential for home and workplace charging scenarios.
Key Drivers for Dominance:
- North America: Strong government incentives, robust EV adoption rates, and significant investments in charging infrastructure.
- Europe: Stringent emission regulations, supportive government policies, and increasing consumer demand for EVs.
- Asia-Pacific: Rapid growth of the EV market in China, India, and other countries, coupled with significant government support for EV infrastructure development.
Global Electric Vehicle Charging Equipment Market Product Developments
The EV charging equipment market showcases continuous product innovations, focusing on enhanced charging speeds, improved reliability, and smart functionalities. These advancements cater to the diverse needs of consumers and businesses. Fast and ultra-fast DC charging technologies are gaining traction. Smart charging solutions with features like remote monitoring, load balancing, and integration with smart grids are emerging as key differentiators. Wireless charging technologies are also under development, but their widespread adoption still requires overcoming technological challenges and cost constraints. The market is witnessing a surge in the development of modular and scalable charging systems to enhance flexibility and reduce deployment costs.
Report Scope & Segmentation Analysis
This report segments the global EV charging equipment market based on application (home charging, workplace charging, public charging) and charging type (AC Charging – Level 1 and Level 2; DC Charging). Each segment’s market size, growth projections, and competitive dynamics are analyzed in detail.
- Home Charging: This segment is driven by rising EV adoption in residential areas and government incentives for home charging installations. Market growth is projected at xx% CAGR from 2025 to 2033.
- Workplace Charging: Increasing awareness of the environmental benefits of EVs and supportive company policies are driving workplace charging station adoption. Market growth is expected at xx% CAGR during the forecast period.
- Public Charging: The expansion of public charging infrastructure is crucial for promoting widespread EV adoption. Market growth in this segment is driven by government initiatives, investments from private players, and increasing demand for convenient public charging solutions. The CAGR is projected at xx% for the forecast period.
- AC Charging (Level 1 & 2): Suitable for home and workplace charging, this segment is characterized by lower initial investment costs and easier installation compared to DC fast charging. Market growth is expected at xx% CAGR from 2025 to 2033.
- DC Charging: Primarily utilized in public charging stations, DC fast charging offers significantly reduced charging times, making it attractive for long-distance travel. Market growth is projected to be considerably higher than AC charging at xx% CAGR during the forecast period.
Key Drivers of Global Electric Vehicle Charging Equipment Market Growth
The growth of the global EV charging equipment market is propelled by several key factors. Government regulations mandating EV adoption and supporting infrastructure development play a crucial role. Technological advancements, especially in high-power DC charging and smart charging technologies, are accelerating market expansion. Rising consumer demand for EVs, driven by environmental concerns and government incentives, further fuels market growth. Additionally, investments from both public and private sectors are boosting the development and deployment of charging stations globally.
Challenges in the Global Electric Vehicle Charging Equipment Market Sector
Despite the significant growth potential, the EV charging equipment market faces several challenges. High initial investment costs for charging infrastructure can be a barrier to widespread adoption, particularly in developing economies. Interoperability issues across different charging standards hinder seamless charging experiences for EV users. The availability of grid capacity and electricity costs in some regions pose limitations to charging infrastructure development. Furthermore, managing charging station maintenance and ensuring reliable operations present an ongoing operational challenge for charging network operators. These factors together can significantly impact the market's expansion rate.
Emerging Opportunities in Global Electric Vehicle Charging Equipment Market
Despite the challenges, the EV charging equipment market presents substantial emerging opportunities. The expansion into new geographic markets, particularly in developing economies, offers significant potential for growth. Innovation in battery technology and charging systems continuously creates opportunities for new and improved products and services. The integration of smart grids and renewable energy sources with charging stations contributes to more sustainable and efficient charging solutions. Furthermore, the development of innovative business models, such as charging-as-a-service, offers potential for increased market penetration and revenue streams.
Leading Players in the Global Electric Vehicle Charging Equipment Market Market
- ABB Ltd
- ClipperCreek Inc
- ChargePoint Inc
- Delta Electronics Inc
- Powercharge
- Siemens AG
- Tesla Inc
- Robert Bosch GmbH
- Exicom Tele-Systems Ltd
- Ather Energy
(List not exhaustive)
Key Developments in Global Electric Vehicle Charging Equipment Market Industry
- December 2023: Tata Power EV Charging Solutions and India Oil Corporation Ltd (IOCL) partnered to install over 500 fast and ultra-fast EV charging points across India. This significantly expands charging infrastructure in a key growth market.
- October 2023: The Ontario government invested USD 91 Million to expand EV charging stations in smaller communities, boosting EV adoption in underserved areas.
- May 2023: Stations-e, a French company, announced a USD 256 Million investment to deploy 10,000 charging stations in France, strengthening the charging network in a major European market.
Strategic Outlook for Global Electric Vehicle Charging Equipment Market Market
The future of the global EV charging equipment market looks promising, with continued growth driven by increasing EV sales, supportive government policies, and ongoing technological advancements. Key growth catalysts include the expansion of charging infrastructure in emerging markets, the adoption of smart charging technologies, and the integration of renewable energy sources. The market is expected to witness a further consolidation through mergers and acquisitions, with larger players aiming to strengthen their market positions and expand their geographic reach. The continuous development of innovative charging solutions will further enhance the user experience and drive market expansion. The long-term outlook is exceptionally positive given the global shift toward sustainable transportation.
Global Electric Vehicle Charging Equipment Market Segmentation
-
1. Application
- 1.1. Home charging
- 1.2. Workplace charging
- 1.3. Public charging
-
2. Charging Type
- 2.1. AC Charging (Level 1 and Level 2)
- 2.2. DC Charging
Global Electric Vehicle Charging Equipment Market Segmentation By Geography
-
1. North America
- 1.1. United States
- 1.2. Canada
- 1.3. Rest of North America
-
2. Europe
- 2.1. Germany
- 2.2. France
- 2.3. United Kingdom
- 2.4. Italy
- 2.5. Spain
- 2.6. NORDIC
- 2.7. Turkey
- 2.8. Russia
- 2.9. Rest of Europe
-
3. Asia Pacific
- 3.1. China
- 3.2. India
- 3.3. Australia
- 3.4. Japan
- 3.5. Malaysia
- 3.6. Thailand
- 3.7. Indonesia
- 3.8. Vietnam
- 3.9. Rest of Asia Pacific
-
4. Middle East and Africa
- 4.1. Saudi Arabia
- 4.2. United Arab Emirates
- 4.3. Qatar
- 4.4. Egypt
- 4.5. Nigeria
- 4.6. South Africa
- 4.7. Rest of Middle East and Africa
-
5. South America
- 5.1. Brazil
- 5.2. Argentina
- 5.3. Colombia
- 5.4. Rest of South America
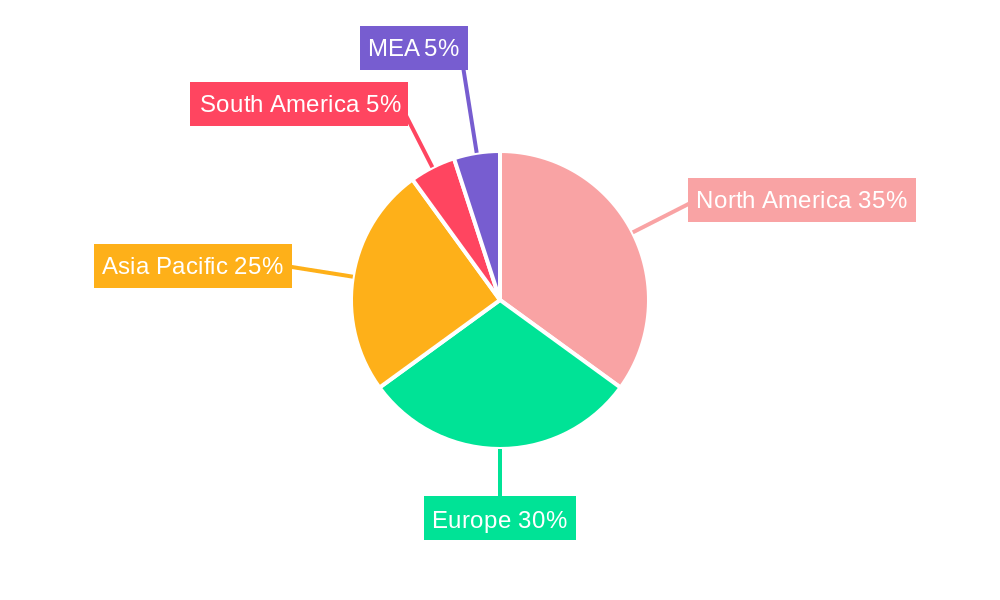
Global Electric Vehicle Charging Equipment Market Regional Market Share
Geographic Coverage of Global Electric Vehicle Charging Equipment Market
Global Electric Vehicle Charging Equipment Market REPORT HIGHLIGHTS
| Aspects | Details |
|---|---|
| Study Period | 2020-2034 |
| Base Year | 2025 |
| Estimated Year | 2026 |
| Forecast Period | 2026-2034 |
| Historical Period | 2020-2025 |
| Growth Rate | CAGR of 15.1% from 2020-2034 |
| Segmentation |
|
Table of Contents
- 1. Introduction
- 1.1. Research Scope
- 1.2. Market Segmentation
- 1.3. Research Objective
- 1.4. Definitions and Assumptions
- 2. Executive Summary
- 2.1. Market Snapshot
- 3. Market Dynamics
- 3.1. Market Drivers
- 3.2. Market Restrains
- 3.3. Market Trends
- 3.4. Market Opportunities
- 4. Market Factor Analysis
- 4.1. Porters Five Forces
- 4.1.1. Bargaining Power of Suppliers
- 4.1.2. Bargaining Power of Buyers
- 4.1.3. Threat of New Entrants
- 4.1.4. Threat of Substitutes
- 4.1.5. Competitive Rivalry
- 4.2. PESTEL analysis
- 4.3. BCG Analysis
- 4.3.1. Stars (High Growth, High Market Share)
- 4.3.2. Cash Cows (Low Growth, High Market Share)
- 4.3.3. Question Mark (High Growth, Low Market Share)
- 4.3.4. Dogs (Low Growth, Low Market Share)
- 4.4. Ansoff Matrix Analysis
- 4.5. Supply Chain Analysis
- 4.6. Regulatory Landscape
- 4.7. Current Market Potential and Opportunity Assessment (TAM–SAM–SOM Framework)
- 4.8. RAX Analyst Note
- 4.1. Porters Five Forces
- 5. Market Analysis, Insights and Forecast 2021-2033
- 5.1. Market Analysis, Insights and Forecast - by Application
- 5.1.1. Home charging
- 5.1.2. Workplace charging
- 5.1.3. Public charging
- 5.2. Market Analysis, Insights and Forecast - by Charging Type
- 5.2.1. AC Charging (Level 1 and Level 2)
- 5.2.2. DC Charging
- 5.3. Market Analysis, Insights and Forecast - by Region
- 5.3.1. North America
- 5.3.2. Europe
- 5.3.3. Asia Pacific
- 5.3.4. Middle East and Africa
- 5.3.5. South America
- 5.1. Market Analysis, Insights and Forecast - by Application
- 6. Global Electric Vehicle Charging Equipment Market Analysis, Insights and Forecast, 2021-2033
- 6.1. Market Analysis, Insights and Forecast - by Application
- 6.1.1. Home charging
- 6.1.2. Workplace charging
- 6.1.3. Public charging
- 6.2. Market Analysis, Insights and Forecast - by Charging Type
- 6.2.1. AC Charging (Level 1 and Level 2)
- 6.2.2. DC Charging
- 6.1. Market Analysis, Insights and Forecast - by Application
- 7. North America Global Electric Vehicle Charging Equipment Market Analysis, Insights and Forecast, 2020-2032
- 7.1. Market Analysis, Insights and Forecast - by Application
- 7.1.1. Home charging
- 7.1.2. Workplace charging
- 7.1.3. Public charging
- 7.2. Market Analysis, Insights and Forecast - by Charging Type
- 7.2.1. AC Charging (Level 1 and Level 2)
- 7.2.2. DC Charging
- 7.1. Market Analysis, Insights and Forecast - by Application
- 8. Europe Global Electric Vehicle Charging Equipment Market Analysis, Insights and Forecast, 2020-2032
- 8.1. Market Analysis, Insights and Forecast - by Application
- 8.1.1. Home charging
- 8.1.2. Workplace charging
- 8.1.3. Public charging
- 8.2. Market Analysis, Insights and Forecast - by Charging Type
- 8.2.1. AC Charging (Level 1 and Level 2)
- 8.2.2. DC Charging
- 8.1. Market Analysis, Insights and Forecast - by Application
- 9. Asia Pacific Global Electric Vehicle Charging Equipment Market Analysis, Insights and Forecast, 2020-2032
- 9.1. Market Analysis, Insights and Forecast - by Application
- 9.1.1. Home charging
- 9.1.2. Workplace charging
- 9.1.3. Public charging
- 9.2. Market Analysis, Insights and Forecast - by Charging Type
- 9.2.1. AC Charging (Level 1 and Level 2)
- 9.2.2. DC Charging
- 9.1. Market Analysis, Insights and Forecast - by Application
- 10. Middle East and Africa Global Electric Vehicle Charging Equipment Market Analysis, Insights and Forecast, 2020-2032
- 10.1. Market Analysis, Insights and Forecast - by Application
- 10.1.1. Home charging
- 10.1.2. Workplace charging
- 10.1.3. Public charging
- 10.2. Market Analysis, Insights and Forecast - by Charging Type
- 10.2.1. AC Charging (Level 1 and Level 2)
- 10.2.2. DC Charging
- 10.1. Market Analysis, Insights and Forecast - by Application
- 11. South America Global Electric Vehicle Charging Equipment Market Analysis, Insights and Forecast, 2020-2032
- 11.1. Market Analysis, Insights and Forecast - by Application
- 11.1.1. Home charging
- 11.1.2. Workplace charging
- 11.1.3. Public charging
- 11.2. Market Analysis, Insights and Forecast - by Charging Type
- 11.2.1. AC Charging (Level 1 and Level 2)
- 11.2.2. DC Charging
- 11.1. Market Analysis, Insights and Forecast - by Application
- 12. Competitive Analysis
- 12.1. Company Profiles
- 12.1.1 ABB Ltd
- 12.1.1.1. Company Overview
- 12.1.1.2. Products
- 12.1.1.3. Company Financials
- 12.1.1.4. SWOT Analysis
- 12.1.2 ClipperCreek Inc
- 12.1.2.1. Company Overview
- 12.1.2.2. Products
- 12.1.2.3. Company Financials
- 12.1.2.4. SWOT Analysis
- 12.1.3 ChargePoint Inc
- 12.1.3.1. Company Overview
- 12.1.3.2. Products
- 12.1.3.3. Company Financials
- 12.1.3.4. SWOT Analysis
- 12.1.4 Delta Electronics Inc
- 12.1.4.1. Company Overview
- 12.1.4.2. Products
- 12.1.4.3. Company Financials
- 12.1.4.4. SWOT Analysis
- 12.1.5 Powercharge
- 12.1.5.1. Company Overview
- 12.1.5.2. Products
- 12.1.5.3. Company Financials
- 12.1.5.4. SWOT Analysis
- 12.1.6 Siemens AG
- 12.1.6.1. Company Overview
- 12.1.6.2. Products
- 12.1.6.3. Company Financials
- 12.1.6.4. SWOT Analysis
- 12.1.7 Tesla Inc
- 12.1.7.1. Company Overview
- 12.1.7.2. Products
- 12.1.7.3. Company Financials
- 12.1.7.4. SWOT Analysis
- 12.1.8 Robert Bosch GmbH
- 12.1.8.1. Company Overview
- 12.1.8.2. Products
- 12.1.8.3. Company Financials
- 12.1.8.4. SWOT Analysis
- 12.1.9 Exicom Tele-Systems Ltd
- 12.1.9.1. Company Overview
- 12.1.9.2. Products
- 12.1.9.3. Company Financials
- 12.1.9.4. SWOT Analysis
- 12.1.10 Ather Energy*List Not Exhaustive 6 4 Market Ranking Analysi
- 12.1.10.1. Company Overview
- 12.1.10.2. Products
- 12.1.10.3. Company Financials
- 12.1.10.4. SWOT Analysis
- 12.1.1 ABB Ltd
- 12.2. Market Entropy
- 12.2.1 Company's Key Areas Served
- 12.2.2 Recent Developments
- 12.3. Company Market Share Analysis 2025
- 12.3.1 Top 5 Companies Market Share Analysis
- 12.3.2 Top 3 Companies Market Share Analysis
- 12.4. List of Potential Customers
- 13. Research Methodology
List of Figures
- Figure 1: Global Global Electric Vehicle Charging Equipment Market Revenue Breakdown (billion, %) by Region 2025 & 2033
- Figure 2: Global Global Electric Vehicle Charging Equipment Market Volume Breakdown (Million, %) by Region 2025 & 2033
- Figure 3: North America Global Electric Vehicle Charging Equipment Market Revenue (billion), by Application 2025 & 2033
- Figure 4: North America Global Electric Vehicle Charging Equipment Market Volume (Million), by Application 2025 & 2033
- Figure 5: North America Global Electric Vehicle Charging Equipment Market Revenue Share (%), by Application 2025 & 2033
- Figure 6: North America Global Electric Vehicle Charging Equipment Market Volume Share (%), by Application 2025 & 2033
- Figure 7: North America Global Electric Vehicle Charging Equipment Market Revenue (billion), by Charging Type 2025 & 2033
- Figure 8: North America Global Electric Vehicle Charging Equipment Market Volume (Million), by Charging Type 2025 & 2033
- Figure 9: North America Global Electric Vehicle Charging Equipment Market Revenue Share (%), by Charging Type 2025 & 2033
- Figure 10: North America Global Electric Vehicle Charging Equipment Market Volume Share (%), by Charging Type 2025 & 2033
- Figure 11: North America Global Electric Vehicle Charging Equipment Market Revenue (billion), by Country 2025 & 2033
- Figure 12: North America Global Electric Vehicle Charging Equipment Market Volume (Million), by Country 2025 & 2033
- Figure 13: North America Global Electric Vehicle Charging Equipment Market Revenue Share (%), by Country 2025 & 2033
- Figure 14: North America Global Electric Vehicle Charging Equipment Market Volume Share (%), by Country 2025 & 2033
- Figure 15: Europe Global Electric Vehicle Charging Equipment Market Revenue (billion), by Application 2025 & 2033
- Figure 16: Europe Global Electric Vehicle Charging Equipment Market Volume (Million), by Application 2025 & 2033
- Figure 17: Europe Global Electric Vehicle Charging Equipment Market Revenue Share (%), by Application 2025 & 2033
- Figure 18: Europe Global Electric Vehicle Charging Equipment Market Volume Share (%), by Application 2025 & 2033
- Figure 19: Europe Global Electric Vehicle Charging Equipment Market Revenue (billion), by Charging Type 2025 & 2033
- Figure 20: Europe Global Electric Vehicle Charging Equipment Market Volume (Million), by Charging Type 2025 & 2033
- Figure 21: Europe Global Electric Vehicle Charging Equipment Market Revenue Share (%), by Charging Type 2025 & 2033
- Figure 22: Europe Global Electric Vehicle Charging Equipment Market Volume Share (%), by Charging Type 2025 & 2033
- Figure 23: Europe Global Electric Vehicle Charging Equipment Market Revenue (billion), by Country 2025 & 2033
- Figure 24: Europe Global Electric Vehicle Charging Equipment Market Volume (Million), by Country 2025 & 2033
- Figure 25: Europe Global Electric Vehicle Charging Equipment Market Revenue Share (%), by Country 2025 & 2033
- Figure 26: Europe Global Electric Vehicle Charging Equipment Market Volume Share (%), by Country 2025 & 2033
- Figure 27: Asia Pacific Global Electric Vehicle Charging Equipment Market Revenue (billion), by Application 2025 & 2033
- Figure 28: Asia Pacific Global Electric Vehicle Charging Equipment Market Volume (Million), by Application 2025 & 2033
- Figure 29: Asia Pacific Global Electric Vehicle Charging Equipment Market Revenue Share (%), by Application 2025 & 2033
- Figure 30: Asia Pacific Global Electric Vehicle Charging Equipment Market Volume Share (%), by Application 2025 & 2033
- Figure 31: Asia Pacific Global Electric Vehicle Charging Equipment Market Revenue (billion), by Charging Type 2025 & 2033
- Figure 32: Asia Pacific Global Electric Vehicle Charging Equipment Market Volume (Million), by Charging Type 2025 & 2033
- Figure 33: Asia Pacific Global Electric Vehicle Charging Equipment Market Revenue Share (%), by Charging Type 2025 & 2033
- Figure 34: Asia Pacific Global Electric Vehicle Charging Equipment Market Volume Share (%), by Charging Type 2025 & 2033
- Figure 35: Asia Pacific Global Electric Vehicle Charging Equipment Market Revenue (billion), by Country 2025 & 2033
- Figure 36: Asia Pacific Global Electric Vehicle Charging Equipment Market Volume (Million), by Country 2025 & 2033
- Figure 37: Asia Pacific Global Electric Vehicle Charging Equipment Market Revenue Share (%), by Country 2025 & 2033
- Figure 38: Asia Pacific Global Electric Vehicle Charging Equipment Market Volume Share (%), by Country 2025 & 2033
- Figure 39: Middle East and Africa Global Electric Vehicle Charging Equipment Market Revenue (billion), by Application 2025 & 2033
- Figure 40: Middle East and Africa Global Electric Vehicle Charging Equipment Market Volume (Million), by Application 2025 & 2033
- Figure 41: Middle East and Africa Global Electric Vehicle Charging Equipment Market Revenue Share (%), by Application 2025 & 2033
- Figure 42: Middle East and Africa Global Electric Vehicle Charging Equipment Market Volume Share (%), by Application 2025 & 2033
- Figure 43: Middle East and Africa Global Electric Vehicle Charging Equipment Market Revenue (billion), by Charging Type 2025 & 2033
- Figure 44: Middle East and Africa Global Electric Vehicle Charging Equipment Market Volume (Million), by Charging Type 2025 & 2033
- Figure 45: Middle East and Africa Global Electric Vehicle Charging Equipment Market Revenue Share (%), by Charging Type 2025 & 2033
- Figure 46: Middle East and Africa Global Electric Vehicle Charging Equipment Market Volume Share (%), by Charging Type 2025 & 2033
- Figure 47: Middle East and Africa Global Electric Vehicle Charging Equipment Market Revenue (billion), by Country 2025 & 2033
- Figure 48: Middle East and Africa Global Electric Vehicle Charging Equipment Market Volume (Million), by Country 2025 & 2033
- Figure 49: Middle East and Africa Global Electric Vehicle Charging Equipment Market Revenue Share (%), by Country 2025 & 2033
- Figure 50: Middle East and Africa Global Electric Vehicle Charging Equipment Market Volume Share (%), by Country 2025 & 2033
- Figure 51: South America Global Electric Vehicle Charging Equipment Market Revenue (billion), by Application 2025 & 2033
- Figure 52: South America Global Electric Vehicle Charging Equipment Market Volume (Million), by Application 2025 & 2033
- Figure 53: South America Global Electric Vehicle Charging Equipment Market Revenue Share (%), by Application 2025 & 2033
- Figure 54: South America Global Electric Vehicle Charging Equipment Market Volume Share (%), by Application 2025 & 2033
- Figure 55: South America Global Electric Vehicle Charging Equipment Market Revenue (billion), by Charging Type 2025 & 2033
- Figure 56: South America Global Electric Vehicle Charging Equipment Market Volume (Million), by Charging Type 2025 & 2033
- Figure 57: South America Global Electric Vehicle Charging Equipment Market Revenue Share (%), by Charging Type 2025 & 2033
- Figure 58: South America Global Electric Vehicle Charging Equipment Market Volume Share (%), by Charging Type 2025 & 2033
- Figure 59: South America Global Electric Vehicle Charging Equipment Market Revenue (billion), by Country 2025 & 2033
- Figure 60: South America Global Electric Vehicle Charging Equipment Market Volume (Million), by Country 2025 & 2033
- Figure 61: South America Global Electric Vehicle Charging Equipment Market Revenue Share (%), by Country 2025 & 2033
- Figure 62: South America Global Electric Vehicle Charging Equipment Market Volume Share (%), by Country 2025 & 2033
List of Tables
- Table 1: Global Electric Vehicle Charging Equipment Market Revenue billion Forecast, by Application 2020 & 2033
- Table 2: Global Electric Vehicle Charging Equipment Market Volume Million Forecast, by Application 2020 & 2033
- Table 3: Global Electric Vehicle Charging Equipment Market Revenue billion Forecast, by Charging Type 2020 & 2033
- Table 4: Global Electric Vehicle Charging Equipment Market Volume Million Forecast, by Charging Type 2020 & 2033
- Table 5: Global Electric Vehicle Charging Equipment Market Revenue billion Forecast, by Region 2020 & 2033
- Table 6: Global Electric Vehicle Charging Equipment Market Volume Million Forecast, by Region 2020 & 2033
- Table 7: Global Electric Vehicle Charging Equipment Market Revenue billion Forecast, by Application 2020 & 2033
- Table 8: Global Electric Vehicle Charging Equipment Market Volume Million Forecast, by Application 2020 & 2033
- Table 9: Global Electric Vehicle Charging Equipment Market Revenue billion Forecast, by Charging Type 2020 & 2033
- Table 10: Global Electric Vehicle Charging Equipment Market Volume Million Forecast, by Charging Type 2020 & 2033
- Table 11: Global Electric Vehicle Charging Equipment Market Revenue billion Forecast, by Country 2020 & 2033
- Table 12: Global Electric Vehicle Charging Equipment Market Volume Million Forecast, by Country 2020 & 2033
- Table 13: United States Global Electric Vehicle Charging Equipment Market Revenue (billion) Forecast, by Application 2020 & 2033
- Table 14: United States Global Electric Vehicle Charging Equipment Market Volume (Million) Forecast, by Application 2020 & 2033
- Table 15: Canada Global Electric Vehicle Charging Equipment Market Revenue (billion) Forecast, by Application 2020 & 2033
- Table 16: Canada Global Electric Vehicle Charging Equipment Market Volume (Million) Forecast, by Application 2020 & 2033
- Table 17: Rest of North America Global Electric Vehicle Charging Equipment Market Revenue (billion) Forecast, by Application 2020 & 2033
- Table 18: Rest of North America Global Electric Vehicle Charging Equipment Market Volume (Million) Forecast, by Application 2020 & 2033
- Table 19: Global Electric Vehicle Charging Equipment Market Revenue billion Forecast, by Application 2020 & 2033
- Table 20: Global Electric Vehicle Charging Equipment Market Volume Million Forecast, by Application 2020 & 2033
- Table 21: Global Electric Vehicle Charging Equipment Market Revenue billion Forecast, by Charging Type 2020 & 2033
- Table 22: Global Electric Vehicle Charging Equipment Market Volume Million Forecast, by Charging Type 2020 & 2033
- Table 23: Global Electric Vehicle Charging Equipment Market Revenue billion Forecast, by Country 2020 & 2033
- Table 24: Global Electric Vehicle Charging Equipment Market Volume Million Forecast, by Country 2020 & 2033
- Table 25: Germany Global Electric Vehicle Charging Equipment Market Revenue (billion) Forecast, by Application 2020 & 2033
- Table 26: Germany Global Electric Vehicle Charging Equipment Market Volume (Million) Forecast, by Application 2020 & 2033
- Table 27: France Global Electric Vehicle Charging Equipment Market Revenue (billion) Forecast, by Application 2020 & 2033
- Table 28: France Global Electric Vehicle Charging Equipment Market Volume (Million) Forecast, by Application 2020 & 2033
- Table 29: United Kingdom Global Electric Vehicle Charging Equipment Market Revenue (billion) Forecast, by Application 2020 & 2033
- Table 30: United Kingdom Global Electric Vehicle Charging Equipment Market Volume (Million) Forecast, by Application 2020 & 2033
- Table 31: Italy Global Electric Vehicle Charging Equipment Market Revenue (billion) Forecast, by Application 2020 & 2033
- Table 32: Italy Global Electric Vehicle Charging Equipment Market Volume (Million) Forecast, by Application 2020 & 2033
- Table 33: Spain Global Electric Vehicle Charging Equipment Market Revenue (billion) Forecast, by Application 2020 & 2033
- Table 34: Spain Global Electric Vehicle Charging Equipment Market Volume (Million) Forecast, by Application 2020 & 2033
- Table 35: NORDIC Global Electric Vehicle Charging Equipment Market Revenue (billion) Forecast, by Application 2020 & 2033
- Table 36: NORDIC Global Electric Vehicle Charging Equipment Market Volume (Million) Forecast, by Application 2020 & 2033
- Table 37: Turkey Global Electric Vehicle Charging Equipment Market Revenue (billion) Forecast, by Application 2020 & 2033
- Table 38: Turkey Global Electric Vehicle Charging Equipment Market Volume (Million) Forecast, by Application 2020 & 2033
- Table 39: Russia Global Electric Vehicle Charging Equipment Market Revenue (billion) Forecast, by Application 2020 & 2033
- Table 40: Russia Global Electric Vehicle Charging Equipment Market Volume (Million) Forecast, by Application 2020 & 2033
- Table 41: Rest of Europe Global Electric Vehicle Charging Equipment Market Revenue (billion) Forecast, by Application 2020 & 2033
- Table 42: Rest of Europe Global Electric Vehicle Charging Equipment Market Volume (Million) Forecast, by Application 2020 & 2033
- Table 43: Global Electric Vehicle Charging Equipment Market Revenue billion Forecast, by Application 2020 & 2033
- Table 44: Global Electric Vehicle Charging Equipment Market Volume Million Forecast, by Application 2020 & 2033
- Table 45: Global Electric Vehicle Charging Equipment Market Revenue billion Forecast, by Charging Type 2020 & 2033
- Table 46: Global Electric Vehicle Charging Equipment Market Volume Million Forecast, by Charging Type 2020 & 2033
- Table 47: Global Electric Vehicle Charging Equipment Market Revenue billion Forecast, by Country 2020 & 2033
- Table 48: Global Electric Vehicle Charging Equipment Market Volume Million Forecast, by Country 2020 & 2033
- Table 49: China Global Electric Vehicle Charging Equipment Market Revenue (billion) Forecast, by Application 2020 & 2033
- Table 50: China Global Electric Vehicle Charging Equipment Market Volume (Million) Forecast, by Application 2020 & 2033
- Table 51: India Global Electric Vehicle Charging Equipment Market Revenue (billion) Forecast, by Application 2020 & 2033
- Table 52: India Global Electric Vehicle Charging Equipment Market Volume (Million) Forecast, by Application 2020 & 2033
- Table 53: Australia Global Electric Vehicle Charging Equipment Market Revenue (billion) Forecast, by Application 2020 & 2033
- Table 54: Australia Global Electric Vehicle Charging Equipment Market Volume (Million) Forecast, by Application 2020 & 2033
- Table 55: Japan Global Electric Vehicle Charging Equipment Market Revenue (billion) Forecast, by Application 2020 & 2033
- Table 56: Japan Global Electric Vehicle Charging Equipment Market Volume (Million) Forecast, by Application 2020 & 2033
- Table 57: Malaysia Global Electric Vehicle Charging Equipment Market Revenue (billion) Forecast, by Application 2020 & 2033
- Table 58: Malaysia Global Electric Vehicle Charging Equipment Market Volume (Million) Forecast, by Application 2020 & 2033
- Table 59: Thailand Global Electric Vehicle Charging Equipment Market Revenue (billion) Forecast, by Application 2020 & 2033
- Table 60: Thailand Global Electric Vehicle Charging Equipment Market Volume (Million) Forecast, by Application 2020 & 2033
- Table 61: Indonesia Global Electric Vehicle Charging Equipment Market Revenue (billion) Forecast, by Application 2020 & 2033
- Table 62: Indonesia Global Electric Vehicle Charging Equipment Market Volume (Million) Forecast, by Application 2020 & 2033
- Table 63: Vietnam Global Electric Vehicle Charging Equipment Market Revenue (billion) Forecast, by Application 2020 & 2033
- Table 64: Vietnam Global Electric Vehicle Charging Equipment Market Volume (Million) Forecast, by Application 2020 & 2033
- Table 65: Rest of Asia Pacific Global Electric Vehicle Charging Equipment Market Revenue (billion) Forecast, by Application 2020 & 2033
- Table 66: Rest of Asia Pacific Global Electric Vehicle Charging Equipment Market Volume (Million) Forecast, by Application 2020 & 2033
- Table 67: Global Electric Vehicle Charging Equipment Market Revenue billion Forecast, by Application 2020 & 2033
- Table 68: Global Electric Vehicle Charging Equipment Market Volume Million Forecast, by Application 2020 & 2033
- Table 69: Global Electric Vehicle Charging Equipment Market Revenue billion Forecast, by Charging Type 2020 & 2033
- Table 70: Global Electric Vehicle Charging Equipment Market Volume Million Forecast, by Charging Type 2020 & 2033
- Table 71: Global Electric Vehicle Charging Equipment Market Revenue billion Forecast, by Country 2020 & 2033
- Table 72: Global Electric Vehicle Charging Equipment Market Volume Million Forecast, by Country 2020 & 2033
- Table 73: Saudi Arabia Global Electric Vehicle Charging Equipment Market Revenue (billion) Forecast, by Application 2020 & 2033
- Table 74: Saudi Arabia Global Electric Vehicle Charging Equipment Market Volume (Million) Forecast, by Application 2020 & 2033
- Table 75: United Arab Emirates Global Electric Vehicle Charging Equipment Market Revenue (billion) Forecast, by Application 2020 & 2033
- Table 76: United Arab Emirates Global Electric Vehicle Charging Equipment Market Volume (Million) Forecast, by Application 2020 & 2033
- Table 77: Qatar Global Electric Vehicle Charging Equipment Market Revenue (billion) Forecast, by Application 2020 & 2033
- Table 78: Qatar Global Electric Vehicle Charging Equipment Market Volume (Million) Forecast, by Application 2020 & 2033
- Table 79: Egypt Global Electric Vehicle Charging Equipment Market Revenue (billion) Forecast, by Application 2020 & 2033
- Table 80: Egypt Global Electric Vehicle Charging Equipment Market Volume (Million) Forecast, by Application 2020 & 2033
- Table 81: Nigeria Global Electric Vehicle Charging Equipment Market Revenue (billion) Forecast, by Application 2020 & 2033
- Table 82: Nigeria Global Electric Vehicle Charging Equipment Market Volume (Million) Forecast, by Application 2020 & 2033
- Table 83: South Africa Global Electric Vehicle Charging Equipment Market Revenue (billion) Forecast, by Application 2020 & 2033
- Table 84: South Africa Global Electric Vehicle Charging Equipment Market Volume (Million) Forecast, by Application 2020 & 2033
- Table 85: Rest of Middle East and Africa Global Electric Vehicle Charging Equipment Market Revenue (billion) Forecast, by Application 2020 & 2033
- Table 86: Rest of Middle East and Africa Global Electric Vehicle Charging Equipment Market Volume (Million) Forecast, by Application 2020 & 2033
- Table 87: Global Electric Vehicle Charging Equipment Market Revenue billion Forecast, by Application 2020 & 2033
- Table 88: Global Electric Vehicle Charging Equipment Market Volume Million Forecast, by Application 2020 & 2033
- Table 89: Global Electric Vehicle Charging Equipment Market Revenue billion Forecast, by Charging Type 2020 & 2033
- Table 90: Global Electric Vehicle Charging Equipment Market Volume Million Forecast, by Charging Type 2020 & 2033
- Table 91: Global Electric Vehicle Charging Equipment Market Revenue billion Forecast, by Country 2020 & 2033
- Table 92: Global Electric Vehicle Charging Equipment Market Volume Million Forecast, by Country 2020 & 2033
- Table 93: Brazil Global Electric Vehicle Charging Equipment Market Revenue (billion) Forecast, by Application 2020 & 2033
- Table 94: Brazil Global Electric Vehicle Charging Equipment Market Volume (Million) Forecast, by Application 2020 & 2033
- Table 95: Argentina Global Electric Vehicle Charging Equipment Market Revenue (billion) Forecast, by Application 2020 & 2033
- Table 96: Argentina Global Electric Vehicle Charging Equipment Market Volume (Million) Forecast, by Application 2020 & 2033
- Table 97: Colombia Global Electric Vehicle Charging Equipment Market Revenue (billion) Forecast, by Application 2020 & 2033
- Table 98: Colombia Global Electric Vehicle Charging Equipment Market Volume (Million) Forecast, by Application 2020 & 2033
- Table 99: Rest of South America Global Electric Vehicle Charging Equipment Market Revenue (billion) Forecast, by Application 2020 & 2033
- Table 100: Rest of South America Global Electric Vehicle Charging Equipment Market Volume (Million) Forecast, by Application 2020 & 2033
Frequently Asked Questions
1. What is the projected Compound Annual Growth Rate (CAGR) of the Global Electric Vehicle Charging Equipment Market?
The projected CAGR is approximately 15.1%.
2. Which companies are prominent players in the Global Electric Vehicle Charging Equipment Market?
Key companies in the market include ABB Ltd, ClipperCreek Inc, ChargePoint Inc, Delta Electronics Inc, Powercharge, Siemens AG, Tesla Inc, Robert Bosch GmbH, Exicom Tele-Systems Ltd, Ather Energy*List Not Exhaustive 6 4 Market Ranking Analysi.
3. What are the main segments of the Global Electric Vehicle Charging Equipment Market?
The market segments include Application, Charging Type.
4. Can you provide details about the market size?
The market size is estimated to be USD 28.46 billion as of 2022.
5. What are some drivers contributing to market growth?
4.; Growth in Electric Vehicle Sales4.; Companies Investing in Commissioning New Charging Stations.
6. What are the notable trends driving market growth?
Increase in Electric Vehicle Sales is Expected to Drive the market.
7. Are there any restraints impacting market growth?
4.; The Negative Impact on the Environment.
8. Can you provide examples of recent developments in the market?
December 2023: Tata Power, a leading Indian power company, recently made headlines by announcing a strategic partnership between its subsidiary, Tata Power EV Charging Solutions, and the state-owned India Oil Corporation Ltd (IOCL). The agreement entails the installation of over 500 fast and ultra-fast electric vehicle (EV) charging points throughout India.
9. What pricing options are available for accessing the report?
Pricing options include single-user, multi-user, and enterprise licenses priced at USD 4750, USD 5250, and USD 8750 respectively.
10. Is the market size provided in terms of value or volume?
The market size is provided in terms of value, measured in billion and volume, measured in Million.
11. Are there any specific market keywords associated with the report?
Yes, the market keyword associated with the report is "Global Electric Vehicle Charging Equipment Market," which aids in identifying and referencing the specific market segment covered.
12. How do I determine which pricing option suits my needs best?
The pricing options vary based on user requirements and access needs. Individual users may opt for single-user licenses, while businesses requiring broader access may choose multi-user or enterprise licenses for cost-effective access to the report.
13. Are there any additional resources or data provided in the Global Electric Vehicle Charging Equipment Market report?
While the report offers comprehensive insights, it's advisable to review the specific contents or supplementary materials provided to ascertain if additional resources or data are available.
14. How can I stay updated on further developments or reports in the Global Electric Vehicle Charging Equipment Market?
To stay informed about further developments, trends, and reports in the Global Electric Vehicle Charging Equipment Market, consider subscribing to industry newsletters, following relevant companies and organizations, or regularly checking reputable industry news sources and publications.
Methodology
Step 1 - Identification of Relevant Samples Size from Population Database


Step 2 - Approaches for Defining Global Market Size (Value, Volume* & Price*)

Note*: In applicable scenarios
Step 3 - Data Sources
Primary Research
- Web Analytics
- Survey Reports
- Research Institute
- Latest Research Reports
- Opinion Leaders
Secondary Research
- Annual Reports
- White Paper
- Latest Press Release
- Industry Association
- Paid Database
- Investor Presentations

Step 4 - Data Triangulation
Involves using different sources of information in order to increase the validity of a study
These sources are likely to be stakeholders in a program - participants, other researchers, program staff, other community members, and so on.
Then we put all data in single framework & apply various statistical tools to find out the dynamic on the market.
During the analysis stage, feedback from the stakeholder groups would be compared to determine areas of agreement as well as areas of divergence

