

Key Insights
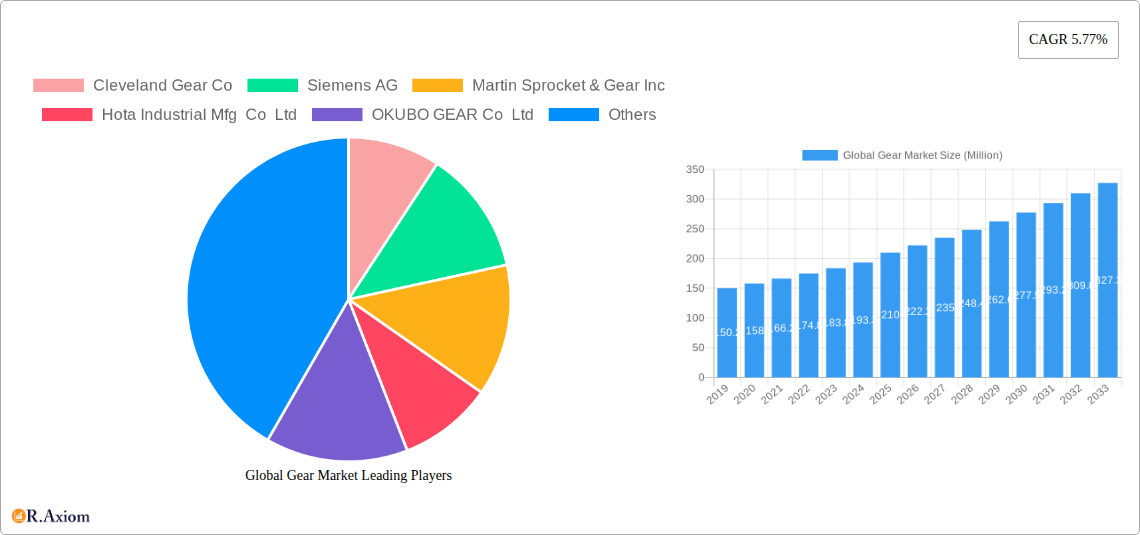
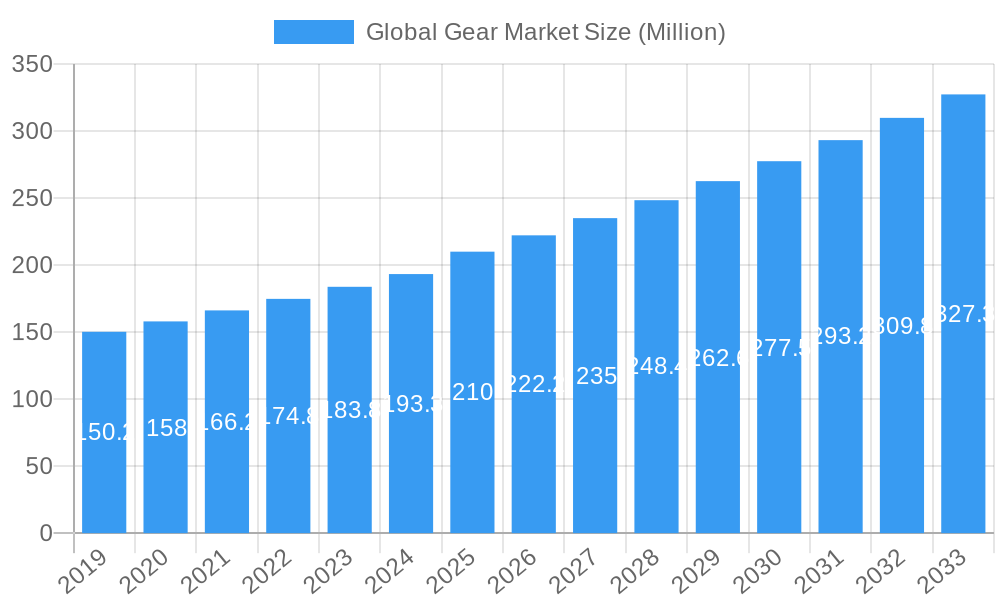
The global gear market is poised for significant expansion, projected to reach an estimated \$210 million by 2025 and sustain a robust Compound Annual Growth Rate (CAGR) of 5.77% through 2033. This growth is largely propelled by escalating demand from critical industrial sectors. The oilfield equipment and mining equipment segments are anticipated to be major contributors, driven by increased exploration and resource extraction activities worldwide. Furthermore, the expansion of industrial machinery, coupled with the ongoing development of power plants and construction projects, will continue to fuel the demand for a diverse range of gear types, including spur, helical, planetary, and bevel gears. Technological advancements in gear manufacturing, focusing on improved efficiency, durability, and precision, are also key drivers shaping the market's trajectory. Companies are investing in innovative materials and designs to meet the stringent requirements of these demanding applications.
Global Gear Market Market Size (In Million)
Despite the promising outlook, certain factors present challenges to the market's uninhibited growth. Intense price competition among manufacturers and the relatively high initial investment costs for advanced gear manufacturing facilities can act as restraints. Additionally, the reliance on raw material availability and price fluctuations can impact production costs. However, the overall trend indicates a strong and sustained upward movement, supported by ongoing industrialization, infrastructure development, and a growing emphasis on automation and efficiency across various industries. The market is also witnessing a consolidation trend, with key players actively seeking mergers and acquisitions to expand their product portfolios and geographical reach, thereby solidifying their competitive positions and capitalizing on emerging opportunities in both developed and developing economies.
Global Gear Market Company Market Share
Global Gear Market: Comprehensive Analysis and Strategic Outlook (2019–2033)
This in-depth report provides a detailed examination of the global gear market, a critical component across numerous industrial sectors. Spanning from 2019 to 2033, with a base year of 2025 and a forecast period from 2025 to 2033, this study offers critical insights for stakeholders navigating this dynamic landscape. The report delves into market size, segmentation, key drivers, challenges, emerging opportunities, and the competitive strategies of leading players. With an estimated market size of $XX Billion in 2025 and projected to reach $XX Billion by 2033, growing at a CAGR of XX%, this analysis equips you with the data and foresight needed for strategic decision-making in the mechanical power transmission sector.
Global Gear Market Market Concentration & Innovation
The global gear market exhibits a moderate to high concentration, with a blend of large multinational corporations and specialized regional players. Innovation serves as a primary differentiator, driven by the demand for enhanced efficiency, reduced energy consumption, and extended product lifecycles in industrial machinery, oilfield equipment, and mining equipment. Gear type innovations are prevalent, with advancements in planetary gears for high torque applications and precision-engineered helical gears for quieter operation. Regulatory frameworks, particularly concerning environmental impact and safety standards, play a significant role in shaping product development and market entry. Product substitutes, though limited in core applications, can emerge in the form of alternative power transmission methods in specific niches. End-user trends towards automation and Industry 4.0 are fueling the adoption of smart gears with integrated sensors for predictive maintenance. Mergers and acquisitions (M&A) are a common strategy for market consolidation and technological acquisition. For instance, the acquisition of smaller, innovative gear manufacturers by larger entities allows for expanded product portfolios and market reach. Key M&A deal values are estimated to range from $XX Million to $XX Million annually, reflecting strategic investments in cutting-edge technologies and expanded manufacturing capabilities.
- Market Concentration: Moderate to High, with key players holding significant market share.
- Innovation Drivers: Energy efficiency, noise reduction, increased torque density, automation integration, predictive maintenance.
- Regulatory Frameworks: Environmental protection regulations, safety standards (e.g., ISO certifications), and industry-specific compliance.
- Product Substitutes: Limited in core applications, but alternative power transmission systems may compete in niche areas.
- End-User Trends: Industry 4.0, automation, electrification, demand for customized solutions.
- M&A Activities: Strategic acquisitions to expand product lines, gain market access, and acquire technological expertise. Estimated annual M&A deal value: $XX Million to $XX Million.
Global Gear Market Industry Trends & Insights
The global gear market is experiencing robust growth, propelled by the relentless demand from a diverse range of end-user industries. The escalating need for efficient and reliable power transmission solutions in sectors such as industrial machinery, oilfield equipment, mining equipment, and power plants acts as a primary growth catalyst. Technological disruptions are continuously reshaping the industry, with advancements in material science leading to the development of lighter, stronger, and more durable gears. The integration of smart technologies, including sensors and IoT capabilities, is enabling predictive maintenance and optimizing operational efficiency, a trend that is increasingly influencing consumer preferences for smart and connected gearboxes. Competitive dynamics are intensifying, with manufacturers focusing on product innovation, cost optimization, and expanding their global distribution networks. The increasing adoption of electric vehicles and renewable energy infrastructure is also creating new avenues for growth. The market penetration of advanced gear technologies is steadily increasing as industries seek to improve their operational efficiency and reduce downtime. The Compound Annual Growth Rate (CAGR) for the global gear market is projected to be XX% over the forecast period, driven by these multifaceted trends. Furthermore, the market is witnessing a growing demand for customized gear solutions tailored to specific application requirements, pushing manufacturers to invest in flexible production capabilities and advanced design software.
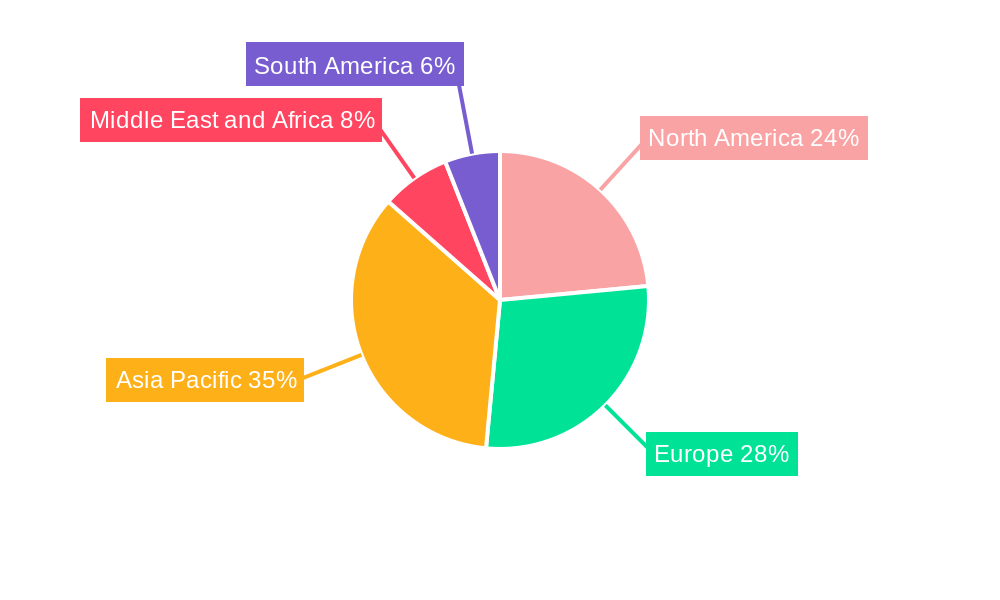
Dominant Markets & Segments in Global Gear Market
The global gear market is characterized by strong regional dominance and significant segment variations.
Dominant Regions & Countries:
- Asia Pacific: This region is a major powerhouse, driven by rapid industrialization, a burgeoning manufacturing base, and significant investments in infrastructure development in countries like China and India. The substantial demand from the industrial machinery and construction machinery sectors fuels this dominance. Economic policies supporting manufacturing growth and favorable labor costs contribute to its leading position.
- North America: A mature market with a strong presence in oilfield equipment and advanced industrial machinery. Technological innovation and a focus on high-performance gears are key drivers. Robust infrastructure projects and ongoing modernization efforts in manufacturing further bolster its market share.
- Europe: Home to established automotive and industrial equipment manufacturers, Europe maintains a significant share due to its emphasis on high-quality engineering, stringent environmental regulations, and a strong push towards electric mobility, which requires advanced gear type solutions.
Dominant Gear Types:
- Spur Gears: Widely used in a vast array of applications due to their simplicity, cost-effectiveness, and ease of manufacturing. They are prevalent in industrial machinery and general automation.
- Helical Gears: Preferred for applications requiring higher torque transmission and quieter operation compared to spur gears. Their adoption is growing in industrial machinery and automotive drivetrains.
- Planetary Gears: Characterized by high torque density and compact design, making them ideal for applications where space is limited but high power is required, such as in robotics, wind turbines, and construction machinery.
- Bevel Gears: Essential for transmitting power between intersecting shafts, they find significant application in automotive differentials and various industrial machinery configurations.
Dominant End-User Industries:
- Industrial Machinery: This is the largest and most diverse segment, encompassing a broad spectrum of manufacturing equipment where gears are fundamental for power transmission and motion control.
- Oilfield Equipment: Critical for drilling, exploration, and production operations, these gears must withstand harsh environments and extreme loads.
- Mining Equipment: Similar to oilfield equipment, gears in mining machinery are designed for robustness and reliability in demanding conditions.
- Construction Machinery: Essential components in excavators, loaders, cranes, and other heavy equipment, requiring high torque and durability.
Global Gear Market Product Developments
Product development in the global gear market is focused on enhancing efficiency, durability, and intelligence. Innovations in materials, such as advanced alloys and composite materials, are leading to lighter and stronger gears that can withstand higher loads and operating temperatures. The integration of sensors for real-time monitoring of parameters like vibration, temperature, and load is a significant trend, enabling predictive maintenance and reducing downtime. Furthermore, advancements in manufacturing techniques, including additive manufacturing (3D printing) for complex geometries and precision machining, are allowing for customized gear solutions and rapid prototyping. These developments cater to the growing demand for optimized performance and extended lifespan across all end-user industries.
Report Scope & Segmentation Analysis
This report provides a comprehensive analysis of the global gear market segmented by Gear Type and End-user Industry.
- Gear Type Segmentation: The market is dissected into Spur Gear, Helical Gear, Planetary Gear, Rack and Pinion Gear, Worm Gear, Bevel Gear, and Other Gear Types. Each segment's market size, growth projections, and competitive dynamics are meticulously analyzed, highlighting the specific applications and demand drivers for each gear configuration. For instance, the Planetary Gear segment is expected to witness robust growth due to its increasing adoption in robotics and renewable energy applications.
- End-user Industry Segmentation: Key end-user industries covered include Oilfield Equipment, Mining Equipment, Industrial Machinery, Power Plants, Construction Machinery, and Other End-user Industries. The report details the market share, growth forecasts, and the unique demands of each sector. The Industrial Machinery segment is projected to maintain its leading position, driven by global manufacturing expansion.
Key Drivers of Global Gear Market Growth
The global gear market growth is propelled by several interconnected factors:
- Industrialization and Manufacturing Expansion: The continuous growth of manufacturing sectors worldwide, particularly in emerging economies, directly translates to increased demand for industrial machinery and consequently, gears.
- Infrastructure Development: Global investments in infrastructure projects, including roads, bridges, and energy facilities, drive the demand for construction machinery and power generation equipment that rely heavily on gears.
- Technological Advancements: Innovations in materials science, precision engineering, and the integration of smart technologies are leading to the development of more efficient, durable, and intelligent gear solutions, spurring adoption.
- Electrification and Automation: The growing trend towards electrification in industries and the widespread adoption of automation and robotics necessitate advanced gear systems for precise motion control.
Challenges in the Global Gear Market Sector
Despite its growth trajectory, the global gear market faces several challenges:
- Supply Chain Disruptions: Global supply chain volatilities, including raw material shortages and logistical complexities, can impact production timelines and cost structures.
- Intense Competition and Price Pressure: The presence of numerous global and regional players leads to intense competition, often resulting in price pressures that can affect profit margins.
- Technological Obsolescence: Rapid advancements in technology require continuous investment in R&D and manufacturing upgrades, posing a risk of obsolescence for older technologies.
- Skilled Labor Shortage: A shortage of skilled labor for precision manufacturing and maintenance of complex gear systems can hinder production efficiency and innovation.
Emerging Opportunities in Global Gear Market
The global gear market is ripe with emerging opportunities:
- Smart Gears and IoT Integration: The increasing demand for smart gears with embedded sensors for predictive maintenance and real-time monitoring presents a significant growth avenue, aligning with Industry 4.0 initiatives.
- Renewable Energy Sector: The rapid expansion of wind power and other renewable energy sources requires specialized and highly efficient gears for turbines and associated equipment.
- Electric Vehicle (EV) Powertrains: The burgeoning electric vehicle market demands innovative and compact gear solutions for efficient power transmission in EV drivetrains.
- Customized and Niche Applications: Growing demand for highly customized gear solutions for specific industrial applications, from aerospace to medical devices, offers lucrative opportunities for specialized manufacturers.
Leading Players in the Global Gear Market Market
- Cleveland Gear Co
- Siemens AG
- Martin Sprocket & Gear Inc
- Hota Industrial Mfg Co Ltd
- OKUBO GEAR Co Ltd
- Bharat Gears Ltd
- Elecon Engineering Company Limited
- Precipart
- Kohara Gear Industry Co Ltd
- Aero Gear Inc
Key Developments in Global Gear Market Industry
- April 2024: RS Group PLC, a global provider of industrial solutions, introduced three new suppliers for mechanical power transmission solutions: Lenze, Bison Gear (AMETEK), and Dichtomatik. Bison Gear (AMETEK), a merger of AMETEK Dynamic Fluid Solutions and Bison Gear and Engineering Corporation, is a premier global provider of mechanical power transmission products, including fluid-moving and fractional to integral horsepower AC and DC gear motors, along with parallel gearboxes. This expansion diversifies product offerings and enhances supply chain reliability for mechanical power transmission solutions.
- November 2023: Engineers from the University of Waterloo’s Faculty of Engineering unveiled ShapePro, a cutting-edge software designed to revolutionize gear-cutting processes for large and medium-sized manufacturers. This innovative tool accurately predicts chip geometry and cutting mechanics for shaping, hobbing, and power skiving, providing insights into machining forces and tool deflections. ShapePro simplifies the optimization of machining parameters, leading to significant time and cost savings in gear manufacturing.
Strategic Outlook for Global Gear Market Market
The strategic outlook for the global gear market remains optimistic, driven by sustained industrial growth, technological innovation, and the burgeoning demand for efficient power transmission solutions. The increasing adoption of smart technologies and the expansion of the renewable energy and electric vehicle sectors present substantial future growth potential. Manufacturers that focus on developing high-performance, energy-efficient, and intelligent gear systems, coupled with robust supply chain management and a commitment to sustainability, will be well-positioned for success. Strategic collaborations and investments in research and development will be crucial for staying ahead in this competitive landscape. The market is expected to witness continued M&A activities as companies seek to consolidate their positions and expand their technological capabilities.
Global Gear Market Segmentation
-
1. Gear Type
- 1.1. Spur Gear
- 1.2. Helical Gear
- 1.3. Planetary Gear
- 1.4. Rack and Pinion Gear
- 1.5. Worm Gear
- 1.6. Bevel Gear
- 1.7. Other Gear Types
-
2. End-user Industry
- 2.1. Oilfield Equipment
- 2.2. Mining Equipment
- 2.3. Industrial Machinery
- 2.4. Power Plants
- 2.5. Construction Machinery
- 2.6. Other End-user Industries
Global Gear Market Segmentation By Geography
-
1. North America
- 1.1. United States
- 1.2. Canada
- 1.3. Rest of North America
-
2. Europe
- 2.1. Germany
- 2.2. France
- 2.3. United Kingdom
- 2.4. Italy
- 2.5. Spain
- 2.6. NORDIC
- 2.7. Russia
- 2.8. Turkey
- 2.9. Rest of Europe
-
3. Asia Pacific
- 3.1. China
- 3.2. India
- 3.3. Australia
- 3.4. Japan
- 3.5. South Korea
- 3.6. Malaysia
- 3.7. Thailand
- 3.8. Indonesia
- 3.9. Vietnam
- 3.10. Rest of Asia Pacific
-
4. Middle East and Africa
- 4.1. Saudi Arabia
- 4.2. United Arab Emirates
- 4.3. Nigeria
- 4.4. Egypt
- 4.5. Qatar
- 4.6. South Africa
- 4.7. Rest of Middle East and Africa
-
5. South America
- 5.1. Brazil
- 5.2. Argentina
- 5.3. Colombia
- 5.4. Rest of South America
Global Gear Market Regional Market Share
Geographic Coverage of Global Gear Market
Global Gear Market REPORT HIGHLIGHTS
| Aspects | Details |
|---|---|
| Study Period | 2020-2034 |
| Base Year | 2025 |
| Estimated Year | 2026 |
| Forecast Period | 2026-2034 |
| Historical Period | 2020-2025 |
| Growth Rate | CAGR of 5.77% from 2020-2034 |
| Segmentation |
|
Table of Contents
- 1. Introduction
- 1.1. Research Scope
- 1.2. Market Segmentation
- 1.3. Research Objective
- 1.4. Definitions and Assumptions
- 2. Executive Summary
- 2.1. Market Snapshot
- 3. Market Dynamics
- 3.1. Market Drivers
- 3.2. Market Restrains
- 3.3. Market Trends
- 3.4. Market Opportunities
- 4. Market Factor Analysis
- 4.1. Porters Five Forces
- 4.1.1. Bargaining Power of Suppliers
- 4.1.2. Bargaining Power of Buyers
- 4.1.3. Threat of New Entrants
- 4.1.4. Threat of Substitutes
- 4.1.5. Competitive Rivalry
- 4.2. PESTEL analysis
- 4.3. BCG Analysis
- 4.3.1. Stars (High Growth, High Market Share)
- 4.3.2. Cash Cows (Low Growth, High Market Share)
- 4.3.3. Question Mark (High Growth, Low Market Share)
- 4.3.4. Dogs (Low Growth, Low Market Share)
- 4.4. Ansoff Matrix Analysis
- 4.5. Supply Chain Analysis
- 4.6. Regulatory Landscape
- 4.7. Current Market Potential and Opportunity Assessment (TAM–SAM–SOM Framework)
- 4.8. RAX Analyst Note
- 4.1. Porters Five Forces
- 5. Market Analysis, Insights and Forecast 2021-2033
- 5.1. Market Analysis, Insights and Forecast - by Gear Type
- 5.1.1. Spur Gear
- 5.1.2. Helical Gear
- 5.1.3. Planetary Gear
- 5.1.4. Rack and Pinion Gear
- 5.1.5. Worm Gear
- 5.1.6. Bevel Gear
- 5.1.7. Other Gear Types
- 5.2. Market Analysis, Insights and Forecast - by End-user Industry
- 5.2.1. Oilfield Equipment
- 5.2.2. Mining Equipment
- 5.2.3. Industrial Machinery
- 5.2.4. Power Plants
- 5.2.5. Construction Machinery
- 5.2.6. Other End-user Industries
- 5.3. Market Analysis, Insights and Forecast - by Region
- 5.3.1. North America
- 5.3.2. Europe
- 5.3.3. Asia Pacific
- 5.3.4. Middle East and Africa
- 5.3.5. South America
- 5.1. Market Analysis, Insights and Forecast - by Gear Type
- 6. Global Gear Market Analysis, Insights and Forecast, 2021-2033
- 6.1. Market Analysis, Insights and Forecast - by Gear Type
- 6.1.1. Spur Gear
- 6.1.2. Helical Gear
- 6.1.3. Planetary Gear
- 6.1.4. Rack and Pinion Gear
- 6.1.5. Worm Gear
- 6.1.6. Bevel Gear
- 6.1.7. Other Gear Types
- 6.2. Market Analysis, Insights and Forecast - by End-user Industry
- 6.2.1. Oilfield Equipment
- 6.2.2. Mining Equipment
- 6.2.3. Industrial Machinery
- 6.2.4. Power Plants
- 6.2.5. Construction Machinery
- 6.2.6. Other End-user Industries
- 6.1. Market Analysis, Insights and Forecast - by Gear Type
- 7. North America Global Gear Market Analysis, Insights and Forecast, 2020-2032
- 7.1. Market Analysis, Insights and Forecast - by Gear Type
- 7.1.1. Spur Gear
- 7.1.2. Helical Gear
- 7.1.3. Planetary Gear
- 7.1.4. Rack and Pinion Gear
- 7.1.5. Worm Gear
- 7.1.6. Bevel Gear
- 7.1.7. Other Gear Types
- 7.2. Market Analysis, Insights and Forecast - by End-user Industry
- 7.2.1. Oilfield Equipment
- 7.2.2. Mining Equipment
- 7.2.3. Industrial Machinery
- 7.2.4. Power Plants
- 7.2.5. Construction Machinery
- 7.2.6. Other End-user Industries
- 7.1. Market Analysis, Insights and Forecast - by Gear Type
- 8. Europe Global Gear Market Analysis, Insights and Forecast, 2020-2032
- 8.1. Market Analysis, Insights and Forecast - by Gear Type
- 8.1.1. Spur Gear
- 8.1.2. Helical Gear
- 8.1.3. Planetary Gear
- 8.1.4. Rack and Pinion Gear
- 8.1.5. Worm Gear
- 8.1.6. Bevel Gear
- 8.1.7. Other Gear Types
- 8.2. Market Analysis, Insights and Forecast - by End-user Industry
- 8.2.1. Oilfield Equipment
- 8.2.2. Mining Equipment
- 8.2.3. Industrial Machinery
- 8.2.4. Power Plants
- 8.2.5. Construction Machinery
- 8.2.6. Other End-user Industries
- 8.1. Market Analysis, Insights and Forecast - by Gear Type
- 9. Asia Pacific Global Gear Market Analysis, Insights and Forecast, 2020-2032
- 9.1. Market Analysis, Insights and Forecast - by Gear Type
- 9.1.1. Spur Gear
- 9.1.2. Helical Gear
- 9.1.3. Planetary Gear
- 9.1.4. Rack and Pinion Gear
- 9.1.5. Worm Gear
- 9.1.6. Bevel Gear
- 9.1.7. Other Gear Types
- 9.2. Market Analysis, Insights and Forecast - by End-user Industry
- 9.2.1. Oilfield Equipment
- 9.2.2. Mining Equipment
- 9.2.3. Industrial Machinery
- 9.2.4. Power Plants
- 9.2.5. Construction Machinery
- 9.2.6. Other End-user Industries
- 9.1. Market Analysis, Insights and Forecast - by Gear Type
- 10. Middle East and Africa Global Gear Market Analysis, Insights and Forecast, 2020-2032
- 10.1. Market Analysis, Insights and Forecast - by Gear Type
- 10.1.1. Spur Gear
- 10.1.2. Helical Gear
- 10.1.3. Planetary Gear
- 10.1.4. Rack and Pinion Gear
- 10.1.5. Worm Gear
- 10.1.6. Bevel Gear
- 10.1.7. Other Gear Types
- 10.2. Market Analysis, Insights and Forecast - by End-user Industry
- 10.2.1. Oilfield Equipment
- 10.2.2. Mining Equipment
- 10.2.3. Industrial Machinery
- 10.2.4. Power Plants
- 10.2.5. Construction Machinery
- 10.2.6. Other End-user Industries
- 10.1. Market Analysis, Insights and Forecast - by Gear Type
- 11. South America Global Gear Market Analysis, Insights and Forecast, 2020-2032
- 11.1. Market Analysis, Insights and Forecast - by Gear Type
- 11.1.1. Spur Gear
- 11.1.2. Helical Gear
- 11.1.3. Planetary Gear
- 11.1.4. Rack and Pinion Gear
- 11.1.5. Worm Gear
- 11.1.6. Bevel Gear
- 11.1.7. Other Gear Types
- 11.2. Market Analysis, Insights and Forecast - by End-user Industry
- 11.2.1. Oilfield Equipment
- 11.2.2. Mining Equipment
- 11.2.3. Industrial Machinery
- 11.2.4. Power Plants
- 11.2.5. Construction Machinery
- 11.2.6. Other End-user Industries
- 11.1. Market Analysis, Insights and Forecast - by Gear Type
- 12. Competitive Analysis
- 12.1. Company Profiles
- 12.1.1 Cleveland Gear Co
- 12.1.1.1. Company Overview
- 12.1.1.2. Products
- 12.1.1.3. Company Financials
- 12.1.1.4. SWOT Analysis
- 12.1.2 Siemens AG
- 12.1.2.1. Company Overview
- 12.1.2.2. Products
- 12.1.2.3. Company Financials
- 12.1.2.4. SWOT Analysis
- 12.1.3 Martin Sprocket & Gear Inc
- 12.1.3.1. Company Overview
- 12.1.3.2. Products
- 12.1.3.3. Company Financials
- 12.1.3.4. SWOT Analysis
- 12.1.4 Hota Industrial Mfg Co Ltd
- 12.1.4.1. Company Overview
- 12.1.4.2. Products
- 12.1.4.3. Company Financials
- 12.1.4.4. SWOT Analysis
- 12.1.5 OKUBO GEAR Co Ltd
- 12.1.5.1. Company Overview
- 12.1.5.2. Products
- 12.1.5.3. Company Financials
- 12.1.5.4. SWOT Analysis
- 12.1.6 Bharat Gears Ltd
- 12.1.6.1. Company Overview
- 12.1.6.2. Products
- 12.1.6.3. Company Financials
- 12.1.6.4. SWOT Analysis
- 12.1.7 Elecon Engineering Company Limited
- 12.1.7.1. Company Overview
- 12.1.7.2. Products
- 12.1.7.3. Company Financials
- 12.1.7.4. SWOT Analysis
- 12.1.8 Precipart
- 12.1.8.1. Company Overview
- 12.1.8.2. Products
- 12.1.8.3. Company Financials
- 12.1.8.4. SWOT Analysis
- 12.1.9 Kohara Gear Industry Co Ltd
- 12.1.9.1. Company Overview
- 12.1.9.2. Products
- 12.1.9.3. Company Financials
- 12.1.9.4. SWOT Analysis
- 12.1.10 Aero Gear Inc *List Not Exhaustive 6 4 List of Other Prominent Companies6 5 Market Ranking/Share (%) Analysi
- 12.1.10.1. Company Overview
- 12.1.10.2. Products
- 12.1.10.3. Company Financials
- 12.1.10.4. SWOT Analysis
- 12.1.1 Cleveland Gear Co
- 12.2. Market Entropy
- 12.2.1 Company's Key Areas Served
- 12.2.2 Recent Developments
- 12.3. Company Market Share Analysis 2025
- 12.3.1 Top 5 Companies Market Share Analysis
- 12.3.2 Top 3 Companies Market Share Analysis
- 12.4. List of Potential Customers
- 13. Research Methodology
List of Figures
- Figure 1: Global Global Gear Market Revenue Breakdown (Million, %) by Region 2025 & 2033
- Figure 2: Global Global Gear Market Volume Breakdown (Billion, %) by Region 2025 & 2033
- Figure 3: North America Global Gear Market Revenue (Million), by Gear Type 2025 & 2033
- Figure 4: North America Global Gear Market Volume (Billion), by Gear Type 2025 & 2033
- Figure 5: North America Global Gear Market Revenue Share (%), by Gear Type 2025 & 2033
- Figure 6: North America Global Gear Market Volume Share (%), by Gear Type 2025 & 2033
- Figure 7: North America Global Gear Market Revenue (Million), by End-user Industry 2025 & 2033
- Figure 8: North America Global Gear Market Volume (Billion), by End-user Industry 2025 & 2033
- Figure 9: North America Global Gear Market Revenue Share (%), by End-user Industry 2025 & 2033
- Figure 10: North America Global Gear Market Volume Share (%), by End-user Industry 2025 & 2033
- Figure 11: North America Global Gear Market Revenue (Million), by Country 2025 & 2033
- Figure 12: North America Global Gear Market Volume (Billion), by Country 2025 & 2033
- Figure 13: North America Global Gear Market Revenue Share (%), by Country 2025 & 2033
- Figure 14: North America Global Gear Market Volume Share (%), by Country 2025 & 2033
- Figure 15: Europe Global Gear Market Revenue (Million), by Gear Type 2025 & 2033
- Figure 16: Europe Global Gear Market Volume (Billion), by Gear Type 2025 & 2033
- Figure 17: Europe Global Gear Market Revenue Share (%), by Gear Type 2025 & 2033
- Figure 18: Europe Global Gear Market Volume Share (%), by Gear Type 2025 & 2033
- Figure 19: Europe Global Gear Market Revenue (Million), by End-user Industry 2025 & 2033
- Figure 20: Europe Global Gear Market Volume (Billion), by End-user Industry 2025 & 2033
- Figure 21: Europe Global Gear Market Revenue Share (%), by End-user Industry 2025 & 2033
- Figure 22: Europe Global Gear Market Volume Share (%), by End-user Industry 2025 & 2033
- Figure 23: Europe Global Gear Market Revenue (Million), by Country 2025 & 2033
- Figure 24: Europe Global Gear Market Volume (Billion), by Country 2025 & 2033
- Figure 25: Europe Global Gear Market Revenue Share (%), by Country 2025 & 2033
- Figure 26: Europe Global Gear Market Volume Share (%), by Country 2025 & 2033
- Figure 27: Asia Pacific Global Gear Market Revenue (Million), by Gear Type 2025 & 2033
- Figure 28: Asia Pacific Global Gear Market Volume (Billion), by Gear Type 2025 & 2033
- Figure 29: Asia Pacific Global Gear Market Revenue Share (%), by Gear Type 2025 & 2033
- Figure 30: Asia Pacific Global Gear Market Volume Share (%), by Gear Type 2025 & 2033
- Figure 31: Asia Pacific Global Gear Market Revenue (Million), by End-user Industry 2025 & 2033
- Figure 32: Asia Pacific Global Gear Market Volume (Billion), by End-user Industry 2025 & 2033
- Figure 33: Asia Pacific Global Gear Market Revenue Share (%), by End-user Industry 2025 & 2033
- Figure 34: Asia Pacific Global Gear Market Volume Share (%), by End-user Industry 2025 & 2033
- Figure 35: Asia Pacific Global Gear Market Revenue (Million), by Country 2025 & 2033
- Figure 36: Asia Pacific Global Gear Market Volume (Billion), by Country 2025 & 2033
- Figure 37: Asia Pacific Global Gear Market Revenue Share (%), by Country 2025 & 2033
- Figure 38: Asia Pacific Global Gear Market Volume Share (%), by Country 2025 & 2033
- Figure 39: Middle East and Africa Global Gear Market Revenue (Million), by Gear Type 2025 & 2033
- Figure 40: Middle East and Africa Global Gear Market Volume (Billion), by Gear Type 2025 & 2033
- Figure 41: Middle East and Africa Global Gear Market Revenue Share (%), by Gear Type 2025 & 2033
- Figure 42: Middle East and Africa Global Gear Market Volume Share (%), by Gear Type 2025 & 2033
- Figure 43: Middle East and Africa Global Gear Market Revenue (Million), by End-user Industry 2025 & 2033
- Figure 44: Middle East and Africa Global Gear Market Volume (Billion), by End-user Industry 2025 & 2033
- Figure 45: Middle East and Africa Global Gear Market Revenue Share (%), by End-user Industry 2025 & 2033
- Figure 46: Middle East and Africa Global Gear Market Volume Share (%), by End-user Industry 2025 & 2033
- Figure 47: Middle East and Africa Global Gear Market Revenue (Million), by Country 2025 & 2033
- Figure 48: Middle East and Africa Global Gear Market Volume (Billion), by Country 2025 & 2033
- Figure 49: Middle East and Africa Global Gear Market Revenue Share (%), by Country 2025 & 2033
- Figure 50: Middle East and Africa Global Gear Market Volume Share (%), by Country 2025 & 2033
- Figure 51: South America Global Gear Market Revenue (Million), by Gear Type 2025 & 2033
- Figure 52: South America Global Gear Market Volume (Billion), by Gear Type 2025 & 2033
- Figure 53: South America Global Gear Market Revenue Share (%), by Gear Type 2025 & 2033
- Figure 54: South America Global Gear Market Volume Share (%), by Gear Type 2025 & 2033
- Figure 55: South America Global Gear Market Revenue (Million), by End-user Industry 2025 & 2033
- Figure 56: South America Global Gear Market Volume (Billion), by End-user Industry 2025 & 2033
- Figure 57: South America Global Gear Market Revenue Share (%), by End-user Industry 2025 & 2033
- Figure 58: South America Global Gear Market Volume Share (%), by End-user Industry 2025 & 2033
- Figure 59: South America Global Gear Market Revenue (Million), by Country 2025 & 2033
- Figure 60: South America Global Gear Market Volume (Billion), by Country 2025 & 2033
- Figure 61: South America Global Gear Market Revenue Share (%), by Country 2025 & 2033
- Figure 62: South America Global Gear Market Volume Share (%), by Country 2025 & 2033
List of Tables
- Table 1: Global Gear Market Revenue Million Forecast, by Gear Type 2020 & 2033
- Table 2: Global Gear Market Volume Billion Forecast, by Gear Type 2020 & 2033
- Table 3: Global Gear Market Revenue Million Forecast, by End-user Industry 2020 & 2033
- Table 4: Global Gear Market Volume Billion Forecast, by End-user Industry 2020 & 2033
- Table 5: Global Gear Market Revenue Million Forecast, by Region 2020 & 2033
- Table 6: Global Gear Market Volume Billion Forecast, by Region 2020 & 2033
- Table 7: Global Gear Market Revenue Million Forecast, by Gear Type 2020 & 2033
- Table 8: Global Gear Market Volume Billion Forecast, by Gear Type 2020 & 2033
- Table 9: Global Gear Market Revenue Million Forecast, by End-user Industry 2020 & 2033
- Table 10: Global Gear Market Volume Billion Forecast, by End-user Industry 2020 & 2033
- Table 11: Global Gear Market Revenue Million Forecast, by Country 2020 & 2033
- Table 12: Global Gear Market Volume Billion Forecast, by Country 2020 & 2033
- Table 13: United States Global Gear Market Revenue (Million) Forecast, by Application 2020 & 2033
- Table 14: United States Global Gear Market Volume (Billion) Forecast, by Application 2020 & 2033
- Table 15: Canada Global Gear Market Revenue (Million) Forecast, by Application 2020 & 2033
- Table 16: Canada Global Gear Market Volume (Billion) Forecast, by Application 2020 & 2033
- Table 17: Rest of North America Global Gear Market Revenue (Million) Forecast, by Application 2020 & 2033
- Table 18: Rest of North America Global Gear Market Volume (Billion) Forecast, by Application 2020 & 2033
- Table 19: Global Gear Market Revenue Million Forecast, by Gear Type 2020 & 2033
- Table 20: Global Gear Market Volume Billion Forecast, by Gear Type 2020 & 2033
- Table 21: Global Gear Market Revenue Million Forecast, by End-user Industry 2020 & 2033
- Table 22: Global Gear Market Volume Billion Forecast, by End-user Industry 2020 & 2033
- Table 23: Global Gear Market Revenue Million Forecast, by Country 2020 & 2033
- Table 24: Global Gear Market Volume Billion Forecast, by Country 2020 & 2033
- Table 25: Germany Global Gear Market Revenue (Million) Forecast, by Application 2020 & 2033
- Table 26: Germany Global Gear Market Volume (Billion) Forecast, by Application 2020 & 2033
- Table 27: France Global Gear Market Revenue (Million) Forecast, by Application 2020 & 2033
- Table 28: France Global Gear Market Volume (Billion) Forecast, by Application 2020 & 2033
- Table 29: United Kingdom Global Gear Market Revenue (Million) Forecast, by Application 2020 & 2033
- Table 30: United Kingdom Global Gear Market Volume (Billion) Forecast, by Application 2020 & 2033
- Table 31: Italy Global Gear Market Revenue (Million) Forecast, by Application 2020 & 2033
- Table 32: Italy Global Gear Market Volume (Billion) Forecast, by Application 2020 & 2033
- Table 33: Spain Global Gear Market Revenue (Million) Forecast, by Application 2020 & 2033
- Table 34: Spain Global Gear Market Volume (Billion) Forecast, by Application 2020 & 2033
- Table 35: NORDIC Global Gear Market Revenue (Million) Forecast, by Application 2020 & 2033
- Table 36: NORDIC Global Gear Market Volume (Billion) Forecast, by Application 2020 & 2033
- Table 37: Russia Global Gear Market Revenue (Million) Forecast, by Application 2020 & 2033
- Table 38: Russia Global Gear Market Volume (Billion) Forecast, by Application 2020 & 2033
- Table 39: Turkey Global Gear Market Revenue (Million) Forecast, by Application 2020 & 2033
- Table 40: Turkey Global Gear Market Volume (Billion) Forecast, by Application 2020 & 2033
- Table 41: Rest of Europe Global Gear Market Revenue (Million) Forecast, by Application 2020 & 2033
- Table 42: Rest of Europe Global Gear Market Volume (Billion) Forecast, by Application 2020 & 2033
- Table 43: Global Gear Market Revenue Million Forecast, by Gear Type 2020 & 2033
- Table 44: Global Gear Market Volume Billion Forecast, by Gear Type 2020 & 2033
- Table 45: Global Gear Market Revenue Million Forecast, by End-user Industry 2020 & 2033
- Table 46: Global Gear Market Volume Billion Forecast, by End-user Industry 2020 & 2033
- Table 47: Global Gear Market Revenue Million Forecast, by Country 2020 & 2033
- Table 48: Global Gear Market Volume Billion Forecast, by Country 2020 & 2033
- Table 49: China Global Gear Market Revenue (Million) Forecast, by Application 2020 & 2033
- Table 50: China Global Gear Market Volume (Billion) Forecast, by Application 2020 & 2033
- Table 51: India Global Gear Market Revenue (Million) Forecast, by Application 2020 & 2033
- Table 52: India Global Gear Market Volume (Billion) Forecast, by Application 2020 & 2033
- Table 53: Australia Global Gear Market Revenue (Million) Forecast, by Application 2020 & 2033
- Table 54: Australia Global Gear Market Volume (Billion) Forecast, by Application 2020 & 2033
- Table 55: Japan Global Gear Market Revenue (Million) Forecast, by Application 2020 & 2033
- Table 56: Japan Global Gear Market Volume (Billion) Forecast, by Application 2020 & 2033
- Table 57: South Korea Global Gear Market Revenue (Million) Forecast, by Application 2020 & 2033
- Table 58: South Korea Global Gear Market Volume (Billion) Forecast, by Application 2020 & 2033
- Table 59: Malaysia Global Gear Market Revenue (Million) Forecast, by Application 2020 & 2033
- Table 60: Malaysia Global Gear Market Volume (Billion) Forecast, by Application 2020 & 2033
- Table 61: Thailand Global Gear Market Revenue (Million) Forecast, by Application 2020 & 2033
- Table 62: Thailand Global Gear Market Volume (Billion) Forecast, by Application 2020 & 2033
- Table 63: Indonesia Global Gear Market Revenue (Million) Forecast, by Application 2020 & 2033
- Table 64: Indonesia Global Gear Market Volume (Billion) Forecast, by Application 2020 & 2033
- Table 65: Vietnam Global Gear Market Revenue (Million) Forecast, by Application 2020 & 2033
- Table 66: Vietnam Global Gear Market Volume (Billion) Forecast, by Application 2020 & 2033
- Table 67: Rest of Asia Pacific Global Gear Market Revenue (Million) Forecast, by Application 2020 & 2033
- Table 68: Rest of Asia Pacific Global Gear Market Volume (Billion) Forecast, by Application 2020 & 2033
- Table 69: Global Gear Market Revenue Million Forecast, by Gear Type 2020 & 2033
- Table 70: Global Gear Market Volume Billion Forecast, by Gear Type 2020 & 2033
- Table 71: Global Gear Market Revenue Million Forecast, by End-user Industry 2020 & 2033
- Table 72: Global Gear Market Volume Billion Forecast, by End-user Industry 2020 & 2033
- Table 73: Global Gear Market Revenue Million Forecast, by Country 2020 & 2033
- Table 74: Global Gear Market Volume Billion Forecast, by Country 2020 & 2033
- Table 75: Saudi Arabia Global Gear Market Revenue (Million) Forecast, by Application 2020 & 2033
- Table 76: Saudi Arabia Global Gear Market Volume (Billion) Forecast, by Application 2020 & 2033
- Table 77: United Arab Emirates Global Gear Market Revenue (Million) Forecast, by Application 2020 & 2033
- Table 78: United Arab Emirates Global Gear Market Volume (Billion) Forecast, by Application 2020 & 2033
- Table 79: Nigeria Global Gear Market Revenue (Million) Forecast, by Application 2020 & 2033
- Table 80: Nigeria Global Gear Market Volume (Billion) Forecast, by Application 2020 & 2033
- Table 81: Egypt Global Gear Market Revenue (Million) Forecast, by Application 2020 & 2033
- Table 82: Egypt Global Gear Market Volume (Billion) Forecast, by Application 2020 & 2033
- Table 83: Qatar Global Gear Market Revenue (Million) Forecast, by Application 2020 & 2033
- Table 84: Qatar Global Gear Market Volume (Billion) Forecast, by Application 2020 & 2033
- Table 85: South Africa Global Gear Market Revenue (Million) Forecast, by Application 2020 & 2033
- Table 86: South Africa Global Gear Market Volume (Billion) Forecast, by Application 2020 & 2033
- Table 87: Rest of Middle East and Africa Global Gear Market Revenue (Million) Forecast, by Application 2020 & 2033
- Table 88: Rest of Middle East and Africa Global Gear Market Volume (Billion) Forecast, by Application 2020 & 2033
- Table 89: Global Gear Market Revenue Million Forecast, by Gear Type 2020 & 2033
- Table 90: Global Gear Market Volume Billion Forecast, by Gear Type 2020 & 2033
- Table 91: Global Gear Market Revenue Million Forecast, by End-user Industry 2020 & 2033
- Table 92: Global Gear Market Volume Billion Forecast, by End-user Industry 2020 & 2033
- Table 93: Global Gear Market Revenue Million Forecast, by Country 2020 & 2033
- Table 94: Global Gear Market Volume Billion Forecast, by Country 2020 & 2033
- Table 95: Brazil Global Gear Market Revenue (Million) Forecast, by Application 2020 & 2033
- Table 96: Brazil Global Gear Market Volume (Billion) Forecast, by Application 2020 & 2033
- Table 97: Argentina Global Gear Market Revenue (Million) Forecast, by Application 2020 & 2033
- Table 98: Argentina Global Gear Market Volume (Billion) Forecast, by Application 2020 & 2033
- Table 99: Colombia Global Gear Market Revenue (Million) Forecast, by Application 2020 & 2033
- Table 100: Colombia Global Gear Market Volume (Billion) Forecast, by Application 2020 & 2033
- Table 101: Rest of South America Global Gear Market Revenue (Million) Forecast, by Application 2020 & 2033
- Table 102: Rest of South America Global Gear Market Volume (Billion) Forecast, by Application 2020 & 2033
Frequently Asked Questions
1. What is the projected Compound Annual Growth Rate (CAGR) of the Global Gear Market?
The projected CAGR is approximately 5.77%.
2. Which companies are prominent players in the Global Gear Market?
Key companies in the market include Cleveland Gear Co, Siemens AG, Martin Sprocket & Gear Inc, Hota Industrial Mfg Co Ltd, OKUBO GEAR Co Ltd, Bharat Gears Ltd, Elecon Engineering Company Limited, Precipart, Kohara Gear Industry Co Ltd, Aero Gear Inc *List Not Exhaustive 6 4 List of Other Prominent Companies6 5 Market Ranking/Share (%) Analysi.
3. What are the main segments of the Global Gear Market?
The market segments include Gear Type, End-user Industry.
4. Can you provide details about the market size?
The market size is estimated to be USD 210 Million as of 2022.
5. What are some drivers contributing to market growth?
4.; Rising Focus on Industrial Automation4.; Growing Wind Energy Installation.
6. What are the notable trends driving market growth?
The Oilfield Equipment Segment to Witness Growth.
7. Are there any restraints impacting market growth?
4.; Rising Focus on Industrial Automation4.; Growing Wind Energy Installation.
8. Can you provide examples of recent developments in the market?
April 2024: RS, a trading brand under the global provider of industrial solutions, RS Group PLC, introduced three new suppliers for mechanical power transmission solutions: Lenze, Bison Gear (AMETEK), and Dichtomatik. Bison Gear (AMETEK), a merger of AMETEK Dynamic Fluid Solutions and Bison Gear and Engineering Corporation, stands out as a premier global provider. They specialize in a range of mechanical power transmission products, from fluid-moving to fractional and integral horsepower AC and DC gear motors, along with parallel gearboxes.November 2023: Engineers from the University of Waterloo’s Faculty of Engineering unveiled ShapePro, a cutting-edge software designed to revolutionize gear-cutting processes. This innovative tool, developed to cater to the needs of large and medium-sized manufacturers, accurately predicts chip geometry and cutting mechanics for shaping, hobbing, and power skiving. ShapePro provides insights into machining forces and tool deflections and simplifies machining parameters' optimization, leading to time and cost savings.
9. What pricing options are available for accessing the report?
Pricing options include single-user, multi-user, and enterprise licenses priced at USD 4750, USD 5250, and USD 8750 respectively.
10. Is the market size provided in terms of value or volume?
The market size is provided in terms of value, measured in Million and volume, measured in Billion.
11. Are there any specific market keywords associated with the report?
Yes, the market keyword associated with the report is "Global Gear Market," which aids in identifying and referencing the specific market segment covered.
12. How do I determine which pricing option suits my needs best?
The pricing options vary based on user requirements and access needs. Individual users may opt for single-user licenses, while businesses requiring broader access may choose multi-user or enterprise licenses for cost-effective access to the report.
13. Are there any additional resources or data provided in the Global Gear Market report?
While the report offers comprehensive insights, it's advisable to review the specific contents or supplementary materials provided to ascertain if additional resources or data are available.
14. How can I stay updated on further developments or reports in the Global Gear Market?
To stay informed about further developments, trends, and reports in the Global Gear Market, consider subscribing to industry newsletters, following relevant companies and organizations, or regularly checking reputable industry news sources and publications.
Methodology
Step 1 - Identification of Relevant Samples Size from Population Database


Step 2 - Approaches for Defining Global Market Size (Value, Volume* & Price*)

Note*: In applicable scenarios
Step 3 - Data Sources
Primary Research
- Web Analytics
- Survey Reports
- Research Institute
- Latest Research Reports
- Opinion Leaders
Secondary Research
- Annual Reports
- White Paper
- Latest Press Release
- Industry Association
- Paid Database
- Investor Presentations

Step 4 - Data Triangulation
Involves using different sources of information in order to increase the validity of a study
These sources are likely to be stakeholders in a program - participants, other researchers, program staff, other community members, and so on.
Then we put all data in single framework & apply various statistical tools to find out the dynamic on the market.
During the analysis stage, feedback from the stakeholder groups would be compared to determine areas of agreement as well as areas of divergence