Strategizing Growth: Green Coffee Industry Market’s Decade Ahead 2025-2033

Green Coffee Industry by Production Analysis, by Consumption Analysis, by Import Market Analysis (Value & Volume), by Export Market Analysis (Value & Volume), by Price Trend Analysis, by North America (United States, Canada, Mexico), by Europe (Germany, United Kingdom, Spain, France, Italy, Belgium, Russia), by Asia Pacific (China, Vietnam, Indonesia, India, Japan), by South America (Brazil, Colombia), by Middle East and Africa (Uganda, Ethiopia) Forecast 2025-2033

Jun 29 2025
Base Year: 2024

234 Pages
Main Logo

Strategizing Growth: Green Coffee Industry Market’s Decade Ahead 2025-2033


Home
Industries
Agriculture
sponsor image

Tailored for you

  • In-depth Analysis Tailored to Specified Regions or Segments
  • Company Profiles Customized to User Preferences
  • Comprehensive Insights Focused on Specific Segments or Regions
  • Customized Evaluation of Competitive Landscape to Meet Your Needs
  • Tailored Customization to Address Other Specific Requirements
Ask for customization


Key Insights

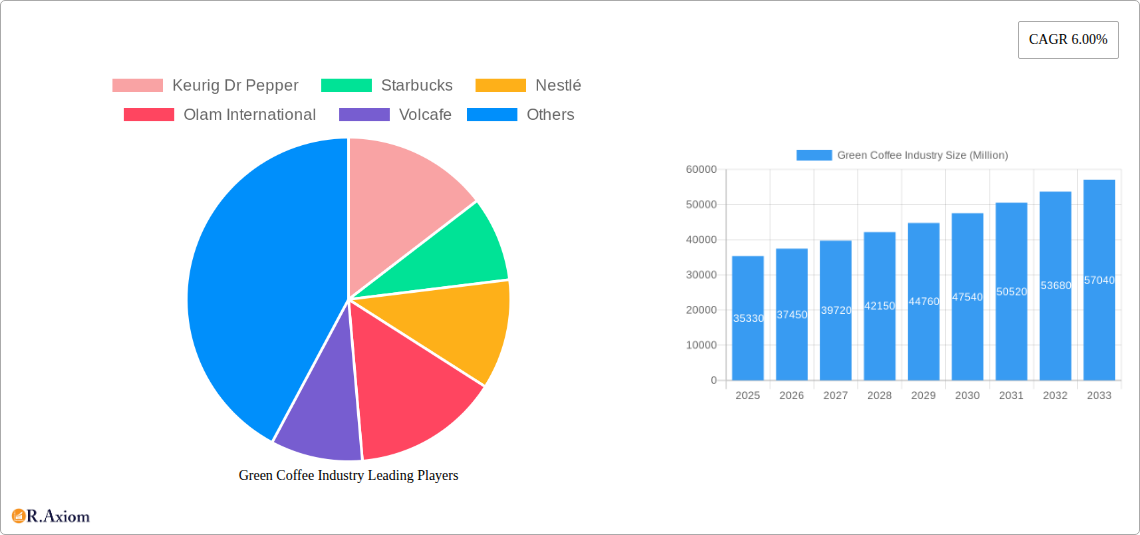
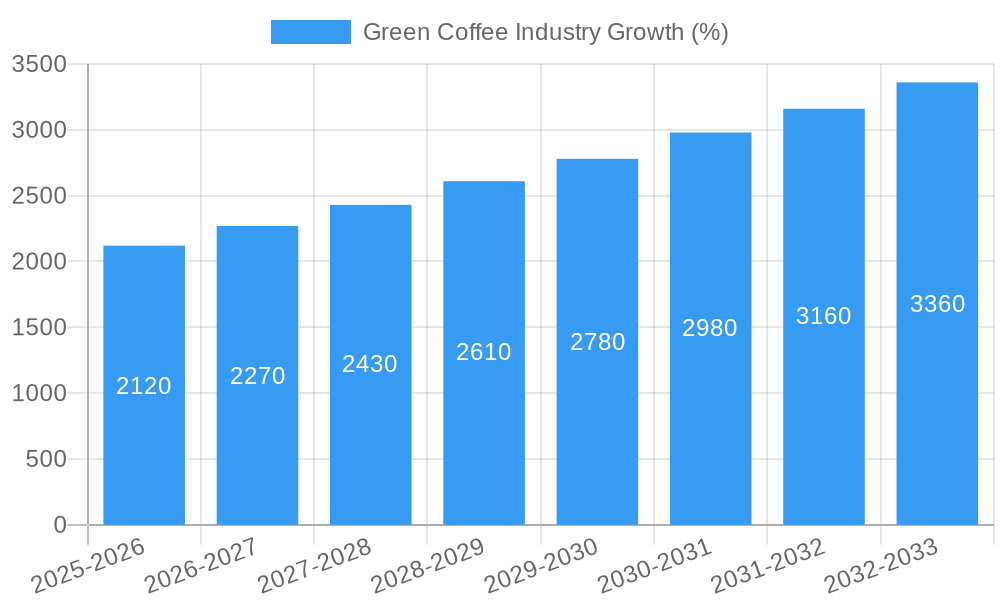
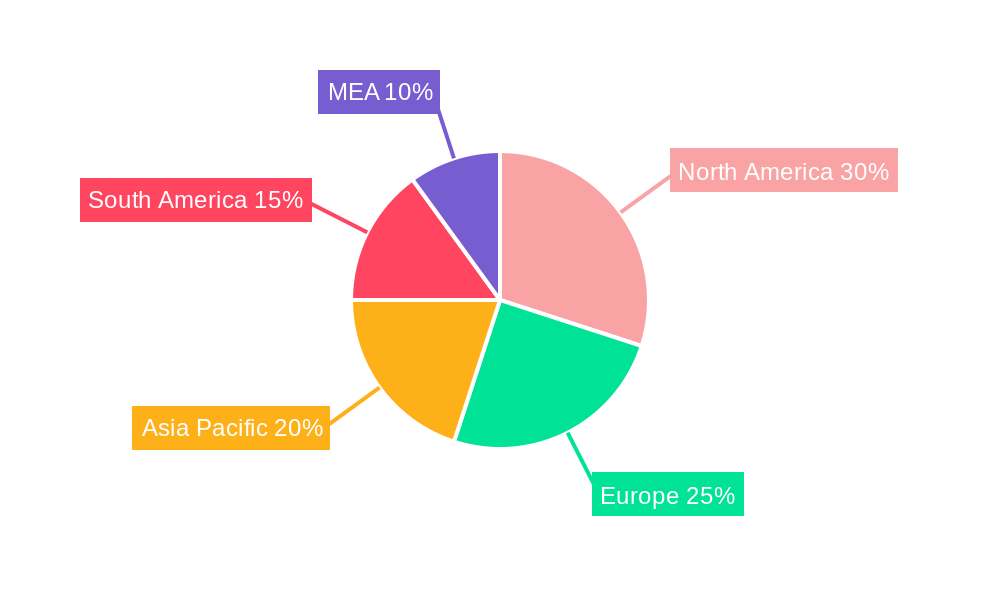
The global green coffee market, valued at $35.33 billion in 2025, is projected to experience robust growth, driven by increasing consumer demand for coffee and diverse coffee-based products. A compound annual growth rate (CAGR) of 6.00% from 2025 to 2033 indicates a significant expansion of the market, reaching an estimated value exceeding $60 billion by 2033. Key drivers include rising disposable incomes in developing economies fueling higher coffee consumption, growing popularity of specialty coffee and single-origin beans, and increasing health awareness leading to demand for sustainably sourced green coffee. The market is segmented by product type (Arabica dominating, followed by Robusta and others), application (Beverage being the largest, with food and other applications following), and end-user (Household and commercial sectors driving consumption). Leading players like Keurig Dr Pepper, Starbucks, Nestlé, and Olam International are leveraging their brand recognition and global distribution networks to capitalize on market opportunities. However, factors such as fluctuations in coffee bean prices due to climatic conditions and geopolitical uncertainties, along with potential supply chain disruptions, pose challenges to market stability. Furthermore, competition from substitute beverages and growing consumer preference for healthier alternatives are potential restraints. Regional analysis reveals that North America and Europe are currently the largest markets, while Asia-Pacific is anticipated to witness substantial growth in the forecast period due to rising middle-class populations and evolving consumption patterns.

The competitive landscape is characterized by a mix of large multinational corporations and smaller specialty coffee roasters. Established players maintain their dominance through extensive distribution networks and strong brand equity. However, the rise of direct trade and ethical sourcing initiatives provides opportunities for smaller players to establish niche markets catering to consumers increasingly conscious of sustainability and fair trade practices. Future growth will likely hinge on innovative product development, such as ready-to-drink coffee options and coffee pods, strategic partnerships within the supply chain, and effective marketing strategies addressing the evolving preferences of health-conscious coffee consumers. The market's success will also depend on mitigating the challenges associated with climate change, ensuring sustainable farming practices, and securing consistent bean supplies to meet the burgeoning global demand. Expansion into new markets and diversification of product offerings will be crucial for companies aiming to establish a lasting competitive edge in the years to come.

This comprehensive report provides an in-depth analysis of the global green coffee industry, offering invaluable insights for stakeholders, investors, and industry professionals. Covering the period 2019-2033, with a focus on 2025, this report projects a market exceeding xx Million by 2033, driven by robust growth across key segments. The report utilizes a robust methodology incorporating historical data (2019-2024), current estimates (2025), and future projections (2025-2033) to offer a complete picture of the market landscape.

Green Coffee Industry Research Report - Market Size, Growth & Forecast

Green Coffee Industry Market Concentration & Innovation

The green coffee industry is characterized by a blend of large multinational corporations and smaller, specialized players. Market concentration is relatively high, with a few dominant players controlling a significant share of the global market. Key players such as Nestlé, Starbucks, and JDE control a combined market share estimated at xx%. Mergers and acquisitions (M&A) activity has been significant, with deal values exceeding xx Million in recent years, primarily driven by strategic expansion and vertical integration. Innovation in the sector is focused on sustainability, traceability, and product diversification, including single-origin coffees, organic options, and functional coffee blends. Regulatory frameworks vary across regions, influencing production, labeling, and trade practices. Consumer trends towards ethically sourced and sustainably produced coffee are pushing innovation in supply chain transparency and farming practices. Substitute products, such as tea and other beverages, pose a moderate threat, though coffee's established position remains strong.

  • Market Leaders: Nestlé, Starbucks, JDE
  • Market Share (Estimated): Nestlé (xx%), Starbucks (xx%), JDE (xx%)
  • M&A Deal Value (2019-2024): xx Million
  • Key Innovation Areas: Sustainability, Traceability, Product Diversification

Green Coffee Industry Industry Trends & Insights

The green coffee market is experiencing significant growth, driven by factors like rising disposable incomes, changing consumer preferences towards premium coffee, and the expanding global coffee culture. The compound annual growth rate (CAGR) during the forecast period (2025-2033) is projected to be xx%, with market penetration increasing in emerging markets. Technological disruptions, including advancements in farming techniques, processing methods, and supply chain management, are improving efficiency and sustainability. Consumer preferences are shifting towards ethically sourced, sustainably produced coffee, with a growing demand for specialty and single-origin beans. The competitive landscape is dynamic, with companies focusing on branding, innovation, and strategic partnerships to gain a market edge.

  • CAGR (2025-2033): xx%
  • Market Penetration (2025): xx%
  • Key Growth Drivers: Rising Disposable Incomes, Growing Coffee Culture, Premiumization
Green Coffee Industry Growth

Dominant Markets & Segments in Green Coffee Industry

The global green coffee market is geographically diverse, with leading regions including Latin America, Africa, and Asia. Brazil remains the dominant producer of Arabica coffee, while Vietnam leads in Robusta production.

  • Product Type: Arabica accounts for the largest segment of the market due to its superior taste and aroma, holding an estimated xx% market share. Robusta, known for its higher caffeine content and lower cost, holds a significant share (xx%), while "Others" represents niche varieties with a smaller (xx%) market share.
  • Application: Beverage applications dominate the market, holding around xx% market share, followed by food applications at xx%, with the remaining portion (xx%) dedicated to other uses.
  • End-User: The household segment accounts for the majority (xx%) of the market, driven by home brewing and consumption, while the commercial segment (xx%) encompasses cafes, restaurants, and other food service businesses. The remaining (xx%) includes industrial and other applications.
  • Key Drivers:
    • Brazil (Arabica): Favorable climate, established infrastructure, and government support.
    • Vietnam (Robusta): High yields, low production costs, and export-oriented policies.

Green Coffee Industry Product Developments

Recent product innovations include single-origin coffees highlighting specific geographic regions and farming practices. The focus is on sustainability certifications and improved processing methods to enhance quality and reduce environmental impact. New brewing technologies and convenient formats cater to evolving consumer preferences, while functional coffees incorporated with health benefits are gaining traction. These developments cater to diverse consumer demands and contribute to increased market penetration.

Report Scope & Segmentation Analysis

This report provides a comprehensive segmentation of the green coffee market across various parameters:

  • Product Type: Arabica, Robusta, Others (includes Excelsa, Liberica) - Market size and growth projections for each type, including competitive dynamics.
  • Application: Beverage (Coffee, instant coffee, etc.), Food (flavoring, desserts), Others (cosmetics etc.) - Analysis of application-specific demand and market trends.
  • End-User: Household, Commercial (Cafes, Restaurants), Others (Industrial uses)- Growth projection and competitive dynamics for each end-user segment.

Each segment is analyzed for its growth potential, market size, and competitive dynamics.

Key Drivers of Green Coffee Industry Growth

The growth of the green coffee industry is primarily driven by increasing global coffee consumption, particularly in emerging markets. Rising disposable incomes and changing lifestyle trends, favoring convenient and premium coffee options are key factors. Technological advancements in farming and processing boost productivity and quality, while favorable government policies and support for the coffee sector enhance market development. Sustainability initiatives and consumer demand for ethically sourced coffee also significantly drive market expansion.

Challenges in the Green Coffee Industry Sector

Significant challenges exist, including climate change impacting coffee bean production, volatile commodity prices, and supply chain disruptions. Regulatory hurdles and trade barriers can impact global trade flows. Furthermore, increasing competition among coffee producers and the emergence of substitute beverages present ongoing challenges to market stability. These factors can influence profitability and overall industry growth. These challenges negatively impact market growth by approximately xx% annually (estimated).

Emerging Opportunities in Green Coffee Industry

The industry offers several emerging opportunities including the expansion into new markets with growing coffee consumption. Technological advancements, such as precision agriculture and advanced processing techniques are improving efficiency and sustainability. Focus on premiumization, with single-origin and specialty coffees catering to discerning consumers presents significant growth potential. Furthermore, functional coffees and innovative brewing methods will further expand market opportunity.

Leading Players in the Green Coffee Industry Market

  • Keurig Dr Pepper
  • Starbucks
  • Nestlé
  • Olam International
  • Volcafe
  • Jacobs Douwe Egberts
  • Lavazza illycaffè
  • J.M. Smucker
  • Kraft Heinz

Key Developments in Green Coffee Industry Industry

  • July 2021: The Rainforest Alliance launched a new sustainability certification program, impacting consumer preferences and ethical sourcing.
  • July 2022: The Ethiopian Coffee and Tea Authority (ECTA) launched a strategy to triple coffee production in 10 years, significantly influencing supply.
  • July 2022: India proposed a new Coffee Promotion and Development Bill, aiming to modernize the industry and boost exports, impacting domestic market dynamics.

Strategic Outlook for Green Coffee Industry Market

The green coffee market presents significant long-term growth potential, driven by increasing global demand, consumer preference shifts, and ongoing innovation. Strategic investments in sustainable farming practices, technological advancements, and brand building will be crucial for success. Companies focusing on ethical sourcing, transparency, and product diversification are best positioned to capitalize on future market opportunities. The market is expected to experience sustained growth, presenting significant opportunities for both established players and new entrants.

Green Coffee Industry Segmentation

  • 1. Production Analysis
  • 2. Consumption Analysis
  • 3. Import Market Analysis (Value & Volume)
  • 4. Export Market Analysis (Value & Volume)
  • 5. Price Trend Analysis

Green Coffee Industry Segmentation By Geography

  • 1. North America
    • 1.1. United States
    • 1.2. Canada
    • 1.3. Mexico
  • 2. Europe
    • 2.1. Germany
    • 2.2. United Kingdom
    • 2.3. Spain
    • 2.4. France
    • 2.5. Italy
    • 2.6. Belgium
    • 2.7. Russia
  • 3. Asia Pacific
    • 3.1. China
    • 3.2. Vietnam
    • 3.3. Indonesia
    • 3.4. India
    • 3.5. Japan
  • 4. South America
    • 4.1. Brazil
    • 4.2. Colombia
  • 5. Middle East and Africa
    • 5.1. Uganda
    • 5.2. Ethiopia
Green Coffee Industry Regional Share


Green Coffee Industry REPORT HIGHLIGHTS

AspectsDetails
Study Period 2019-2033
Base Year 2024
Estimated Year 2025
Forecast Period2025-2033
Historical Period2019-2024
Growth RateCAGR of 6.00% from 2019-2033
Segmentation
    • By Production Analysis
    • By Consumption Analysis
    • By Import Market Analysis (Value & Volume)
    • By Export Market Analysis (Value & Volume)
    • By Price Trend Analysis
  • By Geography
    • North America
      • United States
      • Canada
      • Mexico
    • Europe
      • Germany
      • United Kingdom
      • Spain
      • France
      • Italy
      • Belgium
      • Russia
    • Asia Pacific
      • China
      • Vietnam
      • Indonesia
      • India
      • Japan
    • South America
      • Brazil
      • Colombia
    • Middle East and Africa
      • Uganda
      • Ethiopia


Table of Contents

  1. 1. Introduction
    • 1.1. Research Scope
    • 1.2. Market Segmentation
    • 1.3. Research Methodology
    • 1.4. Definitions and Assumptions
  2. 2. Executive Summary
    • 2.1. Introduction
  3. 3. Market Dynamics
    • 3.1. Introduction
      • 3.2. Market Drivers
        • 3.2.1. Increasing Berry Consumption for Health Benefits; Increasing Adoption of High-Technology Farm Practices; Growing Usage of Berries in the Food and Beverage Industries
      • 3.3. Market Restrains
        • 3.3.1. High Production Cost Involved in Berry Production; Increasing Disease and Pest Infestations
      • 3.4. Market Trends
        • 3.4.1. Increasing Demand for Certified Coffee
  4. 4. Market Factor Analysis
    • 4.1. Porters Five Forces
    • 4.2. Supply/Value Chain
    • 4.3. PESTEL analysis
    • 4.4. Market Entropy
    • 4.5. Patent/Trademark Analysis
  5. 5. Global Green Coffee Industry Analysis, Insights and Forecast, 2019-2031
    • 5.1. Market Analysis, Insights and Forecast - by Production Analysis
      • 5.2. Market Analysis, Insights and Forecast - by Consumption Analysis
        • 5.3. Market Analysis, Insights and Forecast - by Import Market Analysis (Value & Volume)
          • 5.4. Market Analysis, Insights and Forecast - by Export Market Analysis (Value & Volume)
            • 5.5. Market Analysis, Insights and Forecast - by Price Trend Analysis
              • 5.6. Market Analysis, Insights and Forecast - by Region
                • 5.6.1. North America
                • 5.6.2. Europe
                • 5.6.3. Asia Pacific
                • 5.6.4. South America
                • 5.6.5. Middle East and Africa
            • 6. North America Green Coffee Industry Analysis, Insights and Forecast, 2019-2031
              • 6.1. Market Analysis, Insights and Forecast - by Production Analysis
                • 6.2. Market Analysis, Insights and Forecast - by Consumption Analysis
                  • 6.3. Market Analysis, Insights and Forecast - by Import Market Analysis (Value & Volume)
                    • 6.4. Market Analysis, Insights and Forecast - by Export Market Analysis (Value & Volume)
                      • 6.5. Market Analysis, Insights and Forecast - by Price Trend Analysis
                      • 7. Europe Green Coffee Industry Analysis, Insights and Forecast, 2019-2031
                        • 7.1. Market Analysis, Insights and Forecast - by Production Analysis
                          • 7.2. Market Analysis, Insights and Forecast - by Consumption Analysis
                            • 7.3. Market Analysis, Insights and Forecast - by Import Market Analysis (Value & Volume)
                              • 7.4. Market Analysis, Insights and Forecast - by Export Market Analysis (Value & Volume)
                                • 7.5. Market Analysis, Insights and Forecast - by Price Trend Analysis
                                • 8. Asia Pacific Green Coffee Industry Analysis, Insights and Forecast, 2019-2031
                                  • 8.1. Market Analysis, Insights and Forecast - by Production Analysis
                                    • 8.2. Market Analysis, Insights and Forecast - by Consumption Analysis
                                      • 8.3. Market Analysis, Insights and Forecast - by Import Market Analysis (Value & Volume)
                                        • 8.4. Market Analysis, Insights and Forecast - by Export Market Analysis (Value & Volume)
                                          • 8.5. Market Analysis, Insights and Forecast - by Price Trend Analysis
                                          • 9. South America Green Coffee Industry Analysis, Insights and Forecast, 2019-2031
                                            • 9.1. Market Analysis, Insights and Forecast - by Production Analysis
                                              • 9.2. Market Analysis, Insights and Forecast - by Consumption Analysis
                                                • 9.3. Market Analysis, Insights and Forecast - by Import Market Analysis (Value & Volume)
                                                  • 9.4. Market Analysis, Insights and Forecast - by Export Market Analysis (Value & Volume)
                                                    • 9.5. Market Analysis, Insights and Forecast - by Price Trend Analysis
                                                    • 10. Middle East and Africa Green Coffee Industry Analysis, Insights and Forecast, 2019-2031
                                                      • 10.1. Market Analysis, Insights and Forecast - by Production Analysis
                                                        • 10.2. Market Analysis, Insights and Forecast - by Consumption Analysis
                                                          • 10.3. Market Analysis, Insights and Forecast - by Import Market Analysis (Value & Volume)
                                                            • 10.4. Market Analysis, Insights and Forecast - by Export Market Analysis (Value & Volume)
                                                              • 10.5. Market Analysis, Insights and Forecast - by Price Trend Analysis
                                                              • 11. North America Green Coffee Industry Analysis, Insights and Forecast, 2019-2031
                                                                  • 11.1. Market Analysis, Insights and Forecast - By Country/Sub-region
                                                                    • 11.1.1 United States
                                                                    • 11.1.2 Canada
                                                                    • 11.1.3 Mexico
                                                              • 12. Europe Green Coffee Industry Analysis, Insights and Forecast, 2019-2031
                                                                  • 12.1. Market Analysis, Insights and Forecast - By Country/Sub-region
                                                                    • 12.1.1 Germany
                                                                    • 12.1.2 United Kingdom
                                                                    • 12.1.3 France
                                                                    • 12.1.4 Spain
                                                                    • 12.1.5 Italy
                                                                    • 12.1.6 Spain
                                                                    • 12.1.7 Belgium
                                                                    • 12.1.8 Netherland
                                                                    • 12.1.9 Nordics
                                                                    • 12.1.10 Rest of Europe
                                                              • 13. Asia Pacific Green Coffee Industry Analysis, Insights and Forecast, 2019-2031
                                                                  • 13.1. Market Analysis, Insights and Forecast - By Country/Sub-region
                                                                    • 13.1.1 China
                                                                    • 13.1.2 Japan
                                                                    • 13.1.3 India
                                                                    • 13.1.4 South Korea
                                                                    • 13.1.5 Southeast Asia
                                                                    • 13.1.6 Australia
                                                                    • 13.1.7 Indonesia
                                                                    • 13.1.8 Phillipes
                                                                    • 13.1.9 Singapore
                                                                    • 13.1.10 Thailandc
                                                                    • 13.1.11 Rest of Asia Pacific
                                                              • 14. South America Green Coffee Industry Analysis, Insights and Forecast, 2019-2031
                                                                  • 14.1. Market Analysis, Insights and Forecast - By Country/Sub-region
                                                                    • 14.1.1 Brazil
                                                                    • 14.1.2 Argentina
                                                                    • 14.1.3 Peru
                                                                    • 14.1.4 Chile
                                                                    • 14.1.5 Colombia
                                                                    • 14.1.6 Ecuador
                                                                    • 14.1.7 Venezuela
                                                                    • 14.1.8 Rest of South America
                                                              • 15. MEA Green Coffee Industry Analysis, Insights and Forecast, 2019-2031
                                                                  • 15.1. Market Analysis, Insights and Forecast - By Country/Sub-region
                                                                    • 15.1.1 United Arab Emirates
                                                                    • 15.1.2 Saudi Arabia
                                                                    • 15.1.3 South Africa
                                                                    • 15.1.4 Rest of Middle East and Africa
                                                              • 16. Competitive Analysis
                                                                • 16.1. Global Market Share Analysis 2024
                                                                  • 16.2. Company Profiles
                                                                    • 16.2.1 Keurig Dr Pepper
                                                                      • 16.2.1.1. Overview
                                                                      • 16.2.1.2. Products
                                                                      • 16.2.1.3. SWOT Analysis
                                                                      • 16.2.1.4. Recent Developments
                                                                      • 16.2.1.5. Financials (Based on Availability)
                                                                    • 16.2.2 Starbucks
                                                                      • 16.2.2.1. Overview
                                                                      • 16.2.2.2. Products
                                                                      • 16.2.2.3. SWOT Analysis
                                                                      • 16.2.2.4. Recent Developments
                                                                      • 16.2.2.5. Financials (Based on Availability)
                                                                    • 16.2.3 Nestlé
                                                                      • 16.2.3.1. Overview
                                                                      • 16.2.3.2. Products
                                                                      • 16.2.3.3. SWOT Analysis
                                                                      • 16.2.3.4. Recent Developments
                                                                      • 16.2.3.5. Financials (Based on Availability)
                                                                    • 16.2.4 Olam International
                                                                      • 16.2.4.1. Overview
                                                                      • 16.2.4.2. Products
                                                                      • 16.2.4.3. SWOT Analysis
                                                                      • 16.2.4.4. Recent Developments
                                                                      • 16.2.4.5. Financials (Based on Availability)
                                                                    • 16.2.5 Volcafe
                                                                      • 16.2.5.1. Overview
                                                                      • 16.2.5.2. Products
                                                                      • 16.2.5.3. SWOT Analysis
                                                                      • 16.2.5.4. Recent Developments
                                                                      • 16.2.5.5. Financials (Based on Availability)
                                                                    • 16.2.6 Jacobs Douwe Egberts
                                                                      • 16.2.6.1. Overview
                                                                      • 16.2.6.2. Products
                                                                      • 16.2.6.3. SWOT Analysis
                                                                      • 16.2.6.4. Recent Developments
                                                                      • 16.2.6.5. Financials (Based on Availability)
                                                                    • 16.2.7 Lavazza illycaffè
                                                                      • 16.2.7.1. Overview
                                                                      • 16.2.7.2. Products
                                                                      • 16.2.7.3. SWOT Analysis
                                                                      • 16.2.7.4. Recent Developments
                                                                      • 16.2.7.5. Financials (Based on Availability)
                                                                    • 16.2.8 J.M. Smucker
                                                                      • 16.2.8.1. Overview
                                                                      • 16.2.8.2. Products
                                                                      • 16.2.8.3. SWOT Analysis
                                                                      • 16.2.8.4. Recent Developments
                                                                      • 16.2.8.5. Financials (Based on Availability)
                                                                    • 16.2.9 Kraft Heinz
                                                                      • 16.2.9.1. Overview
                                                                      • 16.2.9.2. Products
                                                                      • 16.2.9.3. SWOT Analysis
                                                                      • 16.2.9.4. Recent Developments
                                                                      • 16.2.9.5. Financials (Based on Availability)

                                                              List of Figures

                                                              1. Figure 1: Global Green Coffee Industry Revenue Breakdown (Million, %) by Region 2024 & 2032
                                                              2. Figure 2: North America Green Coffee Industry Revenue (Million), by Country 2024 & 2032
                                                              3. Figure 3: North America Green Coffee Industry Revenue Share (%), by Country 2024 & 2032
                                                              4. Figure 4: Europe Green Coffee Industry Revenue (Million), by Country 2024 & 2032
                                                              5. Figure 5: Europe Green Coffee Industry Revenue Share (%), by Country 2024 & 2032
                                                              6. Figure 6: Asia Pacific Green Coffee Industry Revenue (Million), by Country 2024 & 2032
                                                              7. Figure 7: Asia Pacific Green Coffee Industry Revenue Share (%), by Country 2024 & 2032
                                                              8. Figure 8: South America Green Coffee Industry Revenue (Million), by Country 2024 & 2032
                                                              9. Figure 9: South America Green Coffee Industry Revenue Share (%), by Country 2024 & 2032
                                                              10. Figure 10: MEA Green Coffee Industry Revenue (Million), by Country 2024 & 2032
                                                              11. Figure 11: MEA Green Coffee Industry Revenue Share (%), by Country 2024 & 2032
                                                              12. Figure 12: North America Green Coffee Industry Revenue (Million), by Production Analysis 2024 & 2032
                                                              13. Figure 13: North America Green Coffee Industry Revenue Share (%), by Production Analysis 2024 & 2032
                                                              14. Figure 14: North America Green Coffee Industry Revenue (Million), by Consumption Analysis 2024 & 2032
                                                              15. Figure 15: North America Green Coffee Industry Revenue Share (%), by Consumption Analysis 2024 & 2032
                                                              16. Figure 16: North America Green Coffee Industry Revenue (Million), by Import Market Analysis (Value & Volume) 2024 & 2032
                                                              17. Figure 17: North America Green Coffee Industry Revenue Share (%), by Import Market Analysis (Value & Volume) 2024 & 2032
                                                              18. Figure 18: North America Green Coffee Industry Revenue (Million), by Export Market Analysis (Value & Volume) 2024 & 2032
                                                              19. Figure 19: North America Green Coffee Industry Revenue Share (%), by Export Market Analysis (Value & Volume) 2024 & 2032
                                                              20. Figure 20: North America Green Coffee Industry Revenue (Million), by Price Trend Analysis 2024 & 2032
                                                              21. Figure 21: North America Green Coffee Industry Revenue Share (%), by Price Trend Analysis 2024 & 2032
                                                              22. Figure 22: North America Green Coffee Industry Revenue (Million), by Country 2024 & 2032
                                                              23. Figure 23: North America Green Coffee Industry Revenue Share (%), by Country 2024 & 2032
                                                              24. Figure 24: Europe Green Coffee Industry Revenue (Million), by Production Analysis 2024 & 2032
                                                              25. Figure 25: Europe Green Coffee Industry Revenue Share (%), by Production Analysis 2024 & 2032
                                                              26. Figure 26: Europe Green Coffee Industry Revenue (Million), by Consumption Analysis 2024 & 2032
                                                              27. Figure 27: Europe Green Coffee Industry Revenue Share (%), by Consumption Analysis 2024 & 2032
                                                              28. Figure 28: Europe Green Coffee Industry Revenue (Million), by Import Market Analysis (Value & Volume) 2024 & 2032
                                                              29. Figure 29: Europe Green Coffee Industry Revenue Share (%), by Import Market Analysis (Value & Volume) 2024 & 2032
                                                              30. Figure 30: Europe Green Coffee Industry Revenue (Million), by Export Market Analysis (Value & Volume) 2024 & 2032
                                                              31. Figure 31: Europe Green Coffee Industry Revenue Share (%), by Export Market Analysis (Value & Volume) 2024 & 2032
                                                              32. Figure 32: Europe Green Coffee Industry Revenue (Million), by Price Trend Analysis 2024 & 2032
                                                              33. Figure 33: Europe Green Coffee Industry Revenue Share (%), by Price Trend Analysis 2024 & 2032
                                                              34. Figure 34: Europe Green Coffee Industry Revenue (Million), by Country 2024 & 2032
                                                              35. Figure 35: Europe Green Coffee Industry Revenue Share (%), by Country 2024 & 2032
                                                              36. Figure 36: Asia Pacific Green Coffee Industry Revenue (Million), by Production Analysis 2024 & 2032
                                                              37. Figure 37: Asia Pacific Green Coffee Industry Revenue Share (%), by Production Analysis 2024 & 2032
                                                              38. Figure 38: Asia Pacific Green Coffee Industry Revenue (Million), by Consumption Analysis 2024 & 2032
                                                              39. Figure 39: Asia Pacific Green Coffee Industry Revenue Share (%), by Consumption Analysis 2024 & 2032
                                                              40. Figure 40: Asia Pacific Green Coffee Industry Revenue (Million), by Import Market Analysis (Value & Volume) 2024 & 2032
                                                              41. Figure 41: Asia Pacific Green Coffee Industry Revenue Share (%), by Import Market Analysis (Value & Volume) 2024 & 2032
                                                              42. Figure 42: Asia Pacific Green Coffee Industry Revenue (Million), by Export Market Analysis (Value & Volume) 2024 & 2032
                                                              43. Figure 43: Asia Pacific Green Coffee Industry Revenue Share (%), by Export Market Analysis (Value & Volume) 2024 & 2032
                                                              44. Figure 44: Asia Pacific Green Coffee Industry Revenue (Million), by Price Trend Analysis 2024 & 2032
                                                              45. Figure 45: Asia Pacific Green Coffee Industry Revenue Share (%), by Price Trend Analysis 2024 & 2032
                                                              46. Figure 46: Asia Pacific Green Coffee Industry Revenue (Million), by Country 2024 & 2032
                                                              47. Figure 47: Asia Pacific Green Coffee Industry Revenue Share (%), by Country 2024 & 2032
                                                              48. Figure 48: South America Green Coffee Industry Revenue (Million), by Production Analysis 2024 & 2032
                                                              49. Figure 49: South America Green Coffee Industry Revenue Share (%), by Production Analysis 2024 & 2032
                                                              50. Figure 50: South America Green Coffee Industry Revenue (Million), by Consumption Analysis 2024 & 2032
                                                              51. Figure 51: South America Green Coffee Industry Revenue Share (%), by Consumption Analysis 2024 & 2032
                                                              52. Figure 52: South America Green Coffee Industry Revenue (Million), by Import Market Analysis (Value & Volume) 2024 & 2032
                                                              53. Figure 53: South America Green Coffee Industry Revenue Share (%), by Import Market Analysis (Value & Volume) 2024 & 2032
                                                              54. Figure 54: South America Green Coffee Industry Revenue (Million), by Export Market Analysis (Value & Volume) 2024 & 2032
                                                              55. Figure 55: South America Green Coffee Industry Revenue Share (%), by Export Market Analysis (Value & Volume) 2024 & 2032
                                                              56. Figure 56: South America Green Coffee Industry Revenue (Million), by Price Trend Analysis 2024 & 2032
                                                              57. Figure 57: South America Green Coffee Industry Revenue Share (%), by Price Trend Analysis 2024 & 2032
                                                              58. Figure 58: South America Green Coffee Industry Revenue (Million), by Country 2024 & 2032
                                                              59. Figure 59: South America Green Coffee Industry Revenue Share (%), by Country 2024 & 2032
                                                              60. Figure 60: Middle East and Africa Green Coffee Industry Revenue (Million), by Production Analysis 2024 & 2032
                                                              61. Figure 61: Middle East and Africa Green Coffee Industry Revenue Share (%), by Production Analysis 2024 & 2032
                                                              62. Figure 62: Middle East and Africa Green Coffee Industry Revenue (Million), by Consumption Analysis 2024 & 2032
                                                              63. Figure 63: Middle East and Africa Green Coffee Industry Revenue Share (%), by Consumption Analysis 2024 & 2032
                                                              64. Figure 64: Middle East and Africa Green Coffee Industry Revenue (Million), by Import Market Analysis (Value & Volume) 2024 & 2032
                                                              65. Figure 65: Middle East and Africa Green Coffee Industry Revenue Share (%), by Import Market Analysis (Value & Volume) 2024 & 2032
                                                              66. Figure 66: Middle East and Africa Green Coffee Industry Revenue (Million), by Export Market Analysis (Value & Volume) 2024 & 2032
                                                              67. Figure 67: Middle East and Africa Green Coffee Industry Revenue Share (%), by Export Market Analysis (Value & Volume) 2024 & 2032
                                                              68. Figure 68: Middle East and Africa Green Coffee Industry Revenue (Million), by Price Trend Analysis 2024 & 2032
                                                              69. Figure 69: Middle East and Africa Green Coffee Industry Revenue Share (%), by Price Trend Analysis 2024 & 2032
                                                              70. Figure 70: Middle East and Africa Green Coffee Industry Revenue (Million), by Country 2024 & 2032
                                                              71. Figure 71: Middle East and Africa Green Coffee Industry Revenue Share (%), by Country 2024 & 2032

                                                              List of Tables

                                                              1. Table 1: Global Green Coffee Industry Revenue Million Forecast, by Region 2019 & 2032
                                                              2. Table 2: Global Green Coffee Industry Revenue Million Forecast, by Production Analysis 2019 & 2032
                                                              3. Table 3: Global Green Coffee Industry Revenue Million Forecast, by Consumption Analysis 2019 & 2032
                                                              4. Table 4: Global Green Coffee Industry Revenue Million Forecast, by Import Market Analysis (Value & Volume) 2019 & 2032
                                                              5. Table 5: Global Green Coffee Industry Revenue Million Forecast, by Export Market Analysis (Value & Volume) 2019 & 2032
                                                              6. Table 6: Global Green Coffee Industry Revenue Million Forecast, by Price Trend Analysis 2019 & 2032
                                                              7. Table 7: Global Green Coffee Industry Revenue Million Forecast, by Region 2019 & 2032
                                                              8. Table 8: Global Green Coffee Industry Revenue Million Forecast, by Country 2019 & 2032
                                                              9. Table 9: United States Green Coffee Industry Revenue (Million) Forecast, by Application 2019 & 2032
                                                              10. Table 10: Canada Green Coffee Industry Revenue (Million) Forecast, by Application 2019 & 2032
                                                              11. Table 11: Mexico Green Coffee Industry Revenue (Million) Forecast, by Application 2019 & 2032
                                                              12. Table 12: Global Green Coffee Industry Revenue Million Forecast, by Country 2019 & 2032
                                                              13. Table 13: Germany Green Coffee Industry Revenue (Million) Forecast, by Application 2019 & 2032
                                                              14. Table 14: United Kingdom Green Coffee Industry Revenue (Million) Forecast, by Application 2019 & 2032
                                                              15. Table 15: France Green Coffee Industry Revenue (Million) Forecast, by Application 2019 & 2032
                                                              16. Table 16: Spain Green Coffee Industry Revenue (Million) Forecast, by Application 2019 & 2032
                                                              17. Table 17: Italy Green Coffee Industry Revenue (Million) Forecast, by Application 2019 & 2032
                                                              18. Table 18: Spain Green Coffee Industry Revenue (Million) Forecast, by Application 2019 & 2032
                                                              19. Table 19: Belgium Green Coffee Industry Revenue (Million) Forecast, by Application 2019 & 2032
                                                              20. Table 20: Netherland Green Coffee Industry Revenue (Million) Forecast, by Application 2019 & 2032
                                                              21. Table 21: Nordics Green Coffee Industry Revenue (Million) Forecast, by Application 2019 & 2032
                                                              22. Table 22: Rest of Europe Green Coffee Industry Revenue (Million) Forecast, by Application 2019 & 2032
                                                              23. Table 23: Global Green Coffee Industry Revenue Million Forecast, by Country 2019 & 2032
                                                              24. Table 24: China Green Coffee Industry Revenue (Million) Forecast, by Application 2019 & 2032
                                                              25. Table 25: Japan Green Coffee Industry Revenue (Million) Forecast, by Application 2019 & 2032
                                                              26. Table 26: India Green Coffee Industry Revenue (Million) Forecast, by Application 2019 & 2032
                                                              27. Table 27: South Korea Green Coffee Industry Revenue (Million) Forecast, by Application 2019 & 2032
                                                              28. Table 28: Southeast Asia Green Coffee Industry Revenue (Million) Forecast, by Application 2019 & 2032
                                                              29. Table 29: Australia Green Coffee Industry Revenue (Million) Forecast, by Application 2019 & 2032
                                                              30. Table 30: Indonesia Green Coffee Industry Revenue (Million) Forecast, by Application 2019 & 2032
                                                              31. Table 31: Phillipes Green Coffee Industry Revenue (Million) Forecast, by Application 2019 & 2032
                                                              32. Table 32: Singapore Green Coffee Industry Revenue (Million) Forecast, by Application 2019 & 2032
                                                              33. Table 33: Thailandc Green Coffee Industry Revenue (Million) Forecast, by Application 2019 & 2032
                                                              34. Table 34: Rest of Asia Pacific Green Coffee Industry Revenue (Million) Forecast, by Application 2019 & 2032
                                                              35. Table 35: Global Green Coffee Industry Revenue Million Forecast, by Country 2019 & 2032
                                                              36. Table 36: Brazil Green Coffee Industry Revenue (Million) Forecast, by Application 2019 & 2032
                                                              37. Table 37: Argentina Green Coffee Industry Revenue (Million) Forecast, by Application 2019 & 2032
                                                              38. Table 38: Peru Green Coffee Industry Revenue (Million) Forecast, by Application 2019 & 2032
                                                              39. Table 39: Chile Green Coffee Industry Revenue (Million) Forecast, by Application 2019 & 2032
                                                              40. Table 40: Colombia Green Coffee Industry Revenue (Million) Forecast, by Application 2019 & 2032
                                                              41. Table 41: Ecuador Green Coffee Industry Revenue (Million) Forecast, by Application 2019 & 2032
                                                              42. Table 42: Venezuela Green Coffee Industry Revenue (Million) Forecast, by Application 2019 & 2032
                                                              43. Table 43: Rest of South America Green Coffee Industry Revenue (Million) Forecast, by Application 2019 & 2032
                                                              44. Table 44: Global Green Coffee Industry Revenue Million Forecast, by Country 2019 & 2032
                                                              45. Table 45: United Arab Emirates Green Coffee Industry Revenue (Million) Forecast, by Application 2019 & 2032
                                                              46. Table 46: Saudi Arabia Green Coffee Industry Revenue (Million) Forecast, by Application 2019 & 2032
                                                              47. Table 47: South Africa Green Coffee Industry Revenue (Million) Forecast, by Application 2019 & 2032
                                                              48. Table 48: Rest of Middle East and Africa Green Coffee Industry Revenue (Million) Forecast, by Application 2019 & 2032
                                                              49. Table 49: Global Green Coffee Industry Revenue Million Forecast, by Production Analysis 2019 & 2032
                                                              50. Table 50: Global Green Coffee Industry Revenue Million Forecast, by Consumption Analysis 2019 & 2032
                                                              51. Table 51: Global Green Coffee Industry Revenue Million Forecast, by Import Market Analysis (Value & Volume) 2019 & 2032
                                                              52. Table 52: Global Green Coffee Industry Revenue Million Forecast, by Export Market Analysis (Value & Volume) 2019 & 2032
                                                              53. Table 53: Global Green Coffee Industry Revenue Million Forecast, by Price Trend Analysis 2019 & 2032
                                                              54. Table 54: Global Green Coffee Industry Revenue Million Forecast, by Country 2019 & 2032
                                                              55. Table 55: United States Green Coffee Industry Revenue (Million) Forecast, by Application 2019 & 2032
                                                              56. Table 56: Canada Green Coffee Industry Revenue (Million) Forecast, by Application 2019 & 2032
                                                              57. Table 57: Mexico Green Coffee Industry Revenue (Million) Forecast, by Application 2019 & 2032
                                                              58. Table 58: Global Green Coffee Industry Revenue Million Forecast, by Production Analysis 2019 & 2032
                                                              59. Table 59: Global Green Coffee Industry Revenue Million Forecast, by Consumption Analysis 2019 & 2032
                                                              60. Table 60: Global Green Coffee Industry Revenue Million Forecast, by Import Market Analysis (Value & Volume) 2019 & 2032
                                                              61. Table 61: Global Green Coffee Industry Revenue Million Forecast, by Export Market Analysis (Value & Volume) 2019 & 2032
                                                              62. Table 62: Global Green Coffee Industry Revenue Million Forecast, by Price Trend Analysis 2019 & 2032
                                                              63. Table 63: Global Green Coffee Industry Revenue Million Forecast, by Country 2019 & 2032
                                                              64. Table 64: Germany Green Coffee Industry Revenue (Million) Forecast, by Application 2019 & 2032
                                                              65. Table 65: United Kingdom Green Coffee Industry Revenue (Million) Forecast, by Application 2019 & 2032
                                                              66. Table 66: Spain Green Coffee Industry Revenue (Million) Forecast, by Application 2019 & 2032
                                                              67. Table 67: France Green Coffee Industry Revenue (Million) Forecast, by Application 2019 & 2032
                                                              68. Table 68: Italy Green Coffee Industry Revenue (Million) Forecast, by Application 2019 & 2032
                                                              69. Table 69: Belgium Green Coffee Industry Revenue (Million) Forecast, by Application 2019 & 2032
                                                              70. Table 70: Russia Green Coffee Industry Revenue (Million) Forecast, by Application 2019 & 2032
                                                              71. Table 71: Global Green Coffee Industry Revenue Million Forecast, by Production Analysis 2019 & 2032
                                                              72. Table 72: Global Green Coffee Industry Revenue Million Forecast, by Consumption Analysis 2019 & 2032
                                                              73. Table 73: Global Green Coffee Industry Revenue Million Forecast, by Import Market Analysis (Value & Volume) 2019 & 2032
                                                              74. Table 74: Global Green Coffee Industry Revenue Million Forecast, by Export Market Analysis (Value & Volume) 2019 & 2032
                                                              75. Table 75: Global Green Coffee Industry Revenue Million Forecast, by Price Trend Analysis 2019 & 2032
                                                              76. Table 76: Global Green Coffee Industry Revenue Million Forecast, by Country 2019 & 2032
                                                              77. Table 77: China Green Coffee Industry Revenue (Million) Forecast, by Application 2019 & 2032
                                                              78. Table 78: Vietnam Green Coffee Industry Revenue (Million) Forecast, by Application 2019 & 2032
                                                              79. Table 79: Indonesia Green Coffee Industry Revenue (Million) Forecast, by Application 2019 & 2032
                                                              80. Table 80: India Green Coffee Industry Revenue (Million) Forecast, by Application 2019 & 2032
                                                              81. Table 81: Japan Green Coffee Industry Revenue (Million) Forecast, by Application 2019 & 2032
                                                              82. Table 82: Global Green Coffee Industry Revenue Million Forecast, by Production Analysis 2019 & 2032
                                                              83. Table 83: Global Green Coffee Industry Revenue Million Forecast, by Consumption Analysis 2019 & 2032
                                                              84. Table 84: Global Green Coffee Industry Revenue Million Forecast, by Import Market Analysis (Value & Volume) 2019 & 2032
                                                              85. Table 85: Global Green Coffee Industry Revenue Million Forecast, by Export Market Analysis (Value & Volume) 2019 & 2032
                                                              86. Table 86: Global Green Coffee Industry Revenue Million Forecast, by Price Trend Analysis 2019 & 2032
                                                              87. Table 87: Global Green Coffee Industry Revenue Million Forecast, by Country 2019 & 2032
                                                              88. Table 88: Brazil Green Coffee Industry Revenue (Million) Forecast, by Application 2019 & 2032
                                                              89. Table 89: Colombia Green Coffee Industry Revenue (Million) Forecast, by Application 2019 & 2032
                                                              90. Table 90: Global Green Coffee Industry Revenue Million Forecast, by Production Analysis 2019 & 2032
                                                              91. Table 91: Global Green Coffee Industry Revenue Million Forecast, by Consumption Analysis 2019 & 2032
                                                              92. Table 92: Global Green Coffee Industry Revenue Million Forecast, by Import Market Analysis (Value & Volume) 2019 & 2032
                                                              93. Table 93: Global Green Coffee Industry Revenue Million Forecast, by Export Market Analysis (Value & Volume) 2019 & 2032
                                                              94. Table 94: Global Green Coffee Industry Revenue Million Forecast, by Price Trend Analysis 2019 & 2032
                                                              95. Table 95: Global Green Coffee Industry Revenue Million Forecast, by Country 2019 & 2032
                                                              96. Table 96: Uganda Green Coffee Industry Revenue (Million) Forecast, by Application 2019 & 2032
                                                              97. Table 97: Ethiopia Green Coffee Industry Revenue (Million) Forecast, by Application 2019 & 2032


                                                              Frequently Asked Questions

                                                              1. What is the projected Compound Annual Growth Rate (CAGR) of the Green Coffee Industry?

                                                              The projected CAGR is approximately 6.00%.

                                                              2. Which companies are prominent players in the Green Coffee Industry?

                                                              Key companies in the market include Keurig Dr Pepper , Starbucks , Nestlé , Olam International , Volcafe, Jacobs Douwe Egberts , Lavazza illycaffè , J.M. Smucker , Kraft Heinz .

                                                              3. What are the main segments of the Green Coffee Industry?

                                                              The market segments include Production Analysis, Consumption Analysis, Import Market Analysis (Value & Volume), Export Market Analysis (Value & Volume), Price Trend Analysis.

                                                              4. Can you provide details about the market size?

                                                              The market size is estimated to be USD 35.33 Million as of 2022.

                                                              5. What are some drivers contributing to market growth?

                                                              Increasing Berry Consumption for Health Benefits; Increasing Adoption of High-Technology Farm Practices; Growing Usage of Berries in the Food and Beverage Industries.

                                                              6. What are the notable trends driving market growth?

                                                              Increasing Demand for Certified Coffee.

                                                              7. Are there any restraints impacting market growth?

                                                              High Production Cost Involved in Berry Production; Increasing Disease and Pest Infestations.

                                                              8. Can you provide examples of recent developments in the market?

                                                              July 2022: The Ethiopian Coffee and Tea Authority (ECTA) released a new, comprehensive strategy for the country's coffee sector, which was developed in collaboration with the Ethiopian Institute of Agriculture Research (EIAR) and international nonprofit TechnoServe to increase coffee production by three times within next 10 years.

                                                              9. What pricing options are available for accessing the report?

                                                              Pricing options include single-user, multi-user, and enterprise licenses priced at USD 4750, USD 5250, and USD 8750 respectively.

                                                              10. Is the market size provided in terms of value or volume?

                                                              The market size is provided in terms of value, measured in Million.

                                                              11. Are there any specific market keywords associated with the report?

                                                              Yes, the market keyword associated with the report is "Green Coffee Industry," which aids in identifying and referencing the specific market segment covered.

                                                              12. How do I determine which pricing option suits my needs best?

                                                              The pricing options vary based on user requirements and access needs. Individual users may opt for single-user licenses, while businesses requiring broader access may choose multi-user or enterprise licenses for cost-effective access to the report.

                                                              13. Are there any additional resources or data provided in the Green Coffee Industry report?

                                                              While the report offers comprehensive insights, it's advisable to review the specific contents or supplementary materials provided to ascertain if additional resources or data are available.

                                                              14. How can I stay updated on further developments or reports in the Green Coffee Industry?

                                                              To stay informed about further developments, trends, and reports in the Green Coffee Industry, consider subscribing to industry newsletters, following relevant companies and organizations, or regularly checking reputable industry news sources and publications.


                                                              Methodology

                                                              Step 1 - Identification of Relevant Samples Size from Population Database

                                                              Step Chart
                                                              Bar Chart
                                                              Method Chart

                                                              Step 2 - Approaches for Defining Global Market Size (Value, Volume* & Price*)

                                                              Approach Chart
                                                              Top-down and bottom-up approaches are used to validate the global market size and estimate the market size for manufactures, regional segments, product, and application.

                                                              Note*: In applicable scenarios

                                                              Step 3 - Data Sources

                                                              Primary Research

                                                              • Web Analytics
                                                              • Survey Reports
                                                              • Research Institute
                                                              • Latest Research Reports
                                                              • Opinion Leaders

                                                              Secondary Research

                                                              • Annual Reports
                                                              • White Paper
                                                              • Latest Press Release
                                                              • Industry Association
                                                              • Paid Database
                                                              • Investor Presentations
                                                              Analyst Chart

                                                              Step 4 - Data Triangulation

                                                              Involves using different sources of information in order to increase the validity of a study

                                                              These sources are likely to be stakeholders in a program - participants, other researchers, program staff, other community members, and so on.

                                                              Then we put all data in single framework & apply various statistical tools to find out the dynamic on the market.

                                                              During the analysis stage, feedback from the stakeholder groups would be compared to determine areas of agreement as well as areas of divergence

                                                              Additionally, after gathering mixed and scattered data from a wide range of sources, data is triangulated and correlated to come up with estimated figures which are further validated through primary mediums or industry experts, opinion leaders.

                                                              About Research Axiom

                                                              Research Axiom delivers in-depth market research, industry analysis, and consulting for pharmaceuticals, automotive, IT, and consumer goods. Our reports provide the clarity you need to make informed decisions and drive innovation.

                                                              Our team combines primary research, advanced analytics, and sector expertise to deliver actionable intelligence. We offer syndicated reports, custom research, and consulting services tailored to your business needs.

                                                              At Research Axiom, we are committed to quality, transparency, and client satisfaction. Every report is rigorously validated to ensure accuracy and relevance. Our global perspective and local expertise help you understand both the big picture and the finer details of your market.

                                                              Stay informed with Research Axiom. Subscribe to our newsletter for the latest updates and research highlights, and follow us on social media for real-time insights. Research Axiom – Turning Data into Business Advantage.

                                                              artwork spiralartwork spiralRelated Reports
                                                              artwork underline

                                                              Strategic Planning for North America Agricultural Irrigation Machinery Market Industry Expansion

                                                              Discover the booming North American agricultural irrigation machinery market. This in-depth analysis reveals a 5.10% CAGR, driven by water scarcity, precision agriculture, and smart irrigation technology. Learn about key players, market trends, and future projections for 2025-2033.

                                                              July 2025
                                                              Base Year: 2024
                                                              No Of Pages: 234
                                                              Price: $4750

                                                              Qatar Aquaculture and Fisheries Market Analysis Uncovered: Market Drivers and Forecasts 2025-2033

                                                              Discover the booming Qatar aquaculture and fisheries market, projected to reach \$252.74 million by 2033 with a 5% CAGR. This in-depth analysis covers market size, key players (Al-Khaleej Seafoods, Al Rayan Shrimp Trading), segments (pelagic fish, shrimp, caviar), and future growth drivers.

                                                              July 2025
                                                              Base Year: 2024
                                                              No Of Pages: 150
                                                              Price: $3800

                                                              U.S. Maize Industry Market Trends and Strategic Roadmap

                                                              Discover the dynamic U.S. maize industry outlook with our comprehensive market analysis. Explore key trends, regional breakdowns, and leading companies shaping this multi-billion dollar sector. Projecting steady growth through 2033, understand the factors driving expansion and the challenges ahead for maize producers and stakeholders.

                                                              July 2025
                                                              Base Year: 2024
                                                              No Of Pages: 180
                                                              Price: $3800

                                                              Alfalfa Hay Market in Italy Future-proof Strategies: Trends, Competitor Dynamics, and Opportunities 2025-2033

                                                              Discover the latest insights into Italy's thriving alfalfa hay market. Explore market size, CAGR, key drivers, trends, and competitive landscape analysis for 2025-2033. Learn about segment growth in bales, pellets, and cubes across animal feed applications.

                                                              July 2025
                                                              Base Year: 2024
                                                              No Of Pages: 150
                                                              Price: $3800

                                                              India Biopesticides Industry Market Disruption: Competitor Insights and Trends 2025-2033

                                                              The India biopesticides market is booming, projected to reach ₹237.3 Billion (USD 2847.6 million) by 2033, driven by growing demand for sustainable agriculture and stricter regulations. Learn about key market trends, leading companies, and regional growth forecasts in this comprehensive analysis.

                                                              July 2025
                                                              Base Year: 2024
                                                              No Of Pages: 197
                                                              Price: $3800

                                                              Decoding Almond Market Consumer Preferences 2025-2033

                                                              Discover the booming almond market! Explore its $10.12B valuation (2025), 5.55% CAGR, key drivers, trends, and regional insights. Learn about leading companies and diverse product types including almond butter, flour, and oil. Uncover future growth projections for the almond industry until 2033.

                                                              July 2025
                                                              Base Year: 2024
                                                              No Of Pages: 234
                                                              Price: $4750

                                                              Bio Organic Fertilizer Market Insightful Market Analysis: Trends and Opportunities 2025-2033

                                                              The global bio organic fertilizer market is booming, projected to reach [estimated 2033 value] by 2033 with a CAGR of 5.90%. Discover key market trends, drivers, restraints, and leading companies shaping this sustainable agriculture sector. Learn more about organic fertilizer types, applications, and regional market analysis.

                                                              July 2025
                                                              Base Year: 2024
                                                              No Of Pages: 150
                                                              Price: $4750

                                                              Exploring Saudi Arabia Agriculture Market’s Market Size Dynamics 2025-2033

                                                              Discover the booming Saudi Arabia agriculture market! Projected to reach \$28.3 billion by 2033 with a 5.2% CAGR, this report analyzes market size, key players (Carrefour, Lulu Group), regional trends, and growth drivers. Learn about opportunities and challenges in this dynamic sector.

                                                              July 2025
                                                              Base Year: 2024
                                                              No Of Pages: 197
                                                              Price: $3800

                                                              Lentil Industry Charting Growth Trajectories 2025-2033: Strategic Insights and Forecasts

                                                              Discover the booming lentil market! Explore key trends, regional insights, and leading companies driving growth in this $X billion industry (2025 estimate) projected to reach $X billion by 2033. Learn about the rising demand for whole, split, and dehulled lentils in dry, canned, and frozen forms. Get the complete market analysis now!

                                                              July 2025
                                                              Base Year: 2024
                                                              No Of Pages: 234
                                                              Price: $4750

                                                              USA Agricultural Irrigation Machinery Market Soars to XXX Million, witnessing a CAGR of XX during the forecast period 2025-2033

                                                              Discover the booming US agricultural irrigation machinery market! This in-depth analysis reveals key trends, growth drivers, and leading companies from 2025-2033. Learn about the impact of precision agriculture, water scarcity, and government initiatives on the market's future. Explore segments like drip, sprinkler, and pivot irrigation systems.

                                                              July 2025
                                                              Base Year: 2024
                                                              No Of Pages: 150
                                                              Price: $3800

                                                              South America Biological Organic Fertilizers Industry 2025 to Grow at XX CAGR with XXX Million Market Size: Analysis and Forecasts 2033

                                                              Discover the booming South American biological organic fertilizer market! Projected to reach [estimated 2033 value based on CAGR] by 2033, this market is driven by sustainable agriculture trends and growing demand for eco-friendly farming. Learn about key players, market segments (cereals, legumes, fruits & vegetables), and growth opportunities in Brazil, Argentina, and beyond.

                                                              July 2025
                                                              Base Year: 2024
                                                              No Of Pages: 150
                                                              Price: $4750

                                                              Exploring Barriers in North American Olives Market Market: Trends and Analysis 2025-2033

                                                              Discover the booming North American olives market! This comprehensive analysis reveals a $6.9B market with a 5.74% CAGR (2025-2033), driven by health trends & Mediterranean diet popularity. Explore market segmentation, key players (Napa Valley Olive Oil, Musco Family Olive Co., etc.), and future growth projections for olive oil, table olives, and more.

                                                              July 2025
                                                              Base Year: 2024
                                                              No Of Pages: 180
                                                              Price: $4750

                                                              Analyzing Competitor Moves: Iran Agricultural Sector Analysis Growth Outlook 2025-2033

                                                              Discover the growth opportunities and challenges within Iran's agricultural sector. This comprehensive analysis covers market size, CAGR, key drivers, trends, and regional variations across food crops, cash crops, fruits, vegetables, dairy, and fishery from 2019-2033. Gain valuable insights into this dynamic market.

                                                              July 2025
                                                              Base Year: 2024
                                                              No Of Pages: 150
                                                              Price: $3800

                                                              South America Agricultual Films Market Market’s Drivers and Challenges: Strategic Overview 2025-2033

                                                              Discover the booming South American agricultural films market! This in-depth analysis reveals a CAGR of 6.10% to 2033, driven by growing demand for modern farming techniques and food security. Explore key trends, leading companies (Dow, Agroflex, etc.), and regional insights for Brazil, Argentina, and beyond. Learn how this expanding market presents lucrative opportunities.

                                                              July 2025
                                                              Base Year: 2024
                                                              No Of Pages: 150
                                                              Price: $4750

                                                              Analyzing Coffee Trade Analysis Industry: Opportunities and Growth Patterns 2025-2033

                                                              Discover the latest insights into the booming global coffee trade market. This comprehensive analysis reveals key trends, growth drivers, and market segmentation for Arabica, Robusta, and various coffee processing methods. Explore regional market shares and leading companies like Starbucks & Nestlé. Project your business strategy with our 2025-2033 forecast.

                                                              July 2025
                                                              Base Year: 2024
                                                              No Of Pages: 150
                                                              Price: $4750

                                                              Kiwi Fruit Market Insightful Market Analysis: Trends and Opportunities 2025-2033

                                                              Discover the booming kiwi fruit market! This comprehensive analysis reveals a $1.89B market in 2025, projected to reach significant heights by 2033 with a 5.02% CAGR. Explore key drivers, regional trends, and leading companies shaping this dynamic industry.

                                                              July 2025
                                                              Base Year: 2024
                                                              No Of Pages: 180
                                                              Price: $4750

                                                              Africa Chia Seeds Industry: Growth Opportunities and Competitive Landscape Overview 2025-2033

                                                              Discover the booming Africa chia seeds market! Explore its $13.87M valuation (2025), 2.10% CAGR, key segments (organic, food & beverage, supplements), and leading companies. Learn about growth drivers, trends, and regional insights (South Africa, UAE) in this comprehensive market analysis.

                                                              July 2025
                                                              Base Year: 2024
                                                              No Of Pages: 180
                                                              Price: $4750

                                                              China Pesticide Industry Market Report: Strategic Insights

                                                              Discover the booming China pesticide market, projected to reach $XX million by 2025 and grow at a CAGR of 6.60% until 2033. Analyze key trends, leading companies (Bayer, Syngenta, UPL), and market segmentation (fungicides, herbicides, insecticides, etc.) impacting this dynamic sector.

                                                              July 2025
                                                              Base Year: 2024
                                                              No Of Pages: 197
                                                              Price: $3800

                                                              Global Metal Chelates Market Future-proof Strategies: Trends, Competitor Dynamics, and Opportunities 2025-2033

                                                              Discover the booming global metal chelates market! This comprehensive analysis reveals a CAGR of 10.20%, driven by surging demand for efficient micronutrient delivery in agriculture. Explore market size, segmentation (crop type, product type, application), key players, and regional trends for 2025-2033.

                                                              July 2025
                                                              Base Year: 2024
                                                              No Of Pages: 197
                                                              Price: $3800

                                                              Fresh Cherries Industry CAGR Trends: Growth Outlook 2025-2033

                                                              Discover the booming fresh cherries market! This in-depth analysis reveals key trends, drivers, and restraints, along with regional market share data and projections to 2033. Learn about leading companies and explore growth opportunities in this lucrative sector.

                                                              July 2025
                                                              Base Year: 2024
                                                              No Of Pages: 180
                                                              Price: $4750
                                                              • Home
                                                              • About Us
                                                              • Industries
                                                                • Aerospace & Defense
                                                                • Agriculture
                                                                • Animal Nutrition & Wellness
                                                                • Automotive
                                                                • Chemicals & Materials
                                                                • Consumer Goods and Services
                                                                • Energy & Power
                                                                • Financial Services and Investment Intelligence
                                                                • Food & Beverage
                                                                • Home and Property Improvement
                                                                • Hospitality and Tourism
                                                                • Logistics
                                                                • Manufacturing Products and Services
                                                                • Packaging
                                                                • Professional and Commercial Services
                                                                • Real Estate and Construction
                                                                • Retail
                                                                • Technology, Media and Telecom
                                                                • Healthcare
                                                              • Services
                                                              • Contact
                                                              Main Logo
                                                              • Home
                                                              • About Us
                                                              • Industries
                                                                • Aerospace & Defense
                                                                • Agriculture
                                                                • Animal Nutrition & Wellness
                                                                • Automotive
                                                                • Chemicals & Materials
                                                                • Consumer Goods and Services
                                                                • Energy & Power
                                                                • Financial Services and Investment Intelligence
                                                                • Food & Beverage
                                                                • Home and Property Improvement
                                                                • Hospitality and Tourism
                                                                • Logistics
                                                                • Manufacturing Products and Services
                                                                • Packaging
                                                                • Professional and Commercial Services
                                                                • Real Estate and Construction
                                                                • Retail
                                                                • Technology, Media and Telecom
                                                                • Healthcare
                                                              • Services
                                                              • Contact
                                                              +17162654855
                                                              [email protected]

                                                              +17162654855

                                                              [email protected]

                                                              Business Address

                                                              Head Office

                                                              Office no. A 5010, fifth floor, Solitaire Business Hub, Near Phoenix mall, Pune, Maharashtra 411014

                                                              Contact Information

                                                              Craig Francis

                                                              Business Development Head

                                                              +17162654855

                                                              [email protected]

                                                              Connect With Us

                                                              Secure Payment Partners

                                                              payment image
                                                              RetailLogisticsPackagingAutomotiveHealthcareAgricultureEnergy & PowerFood & BeverageAerospace & DefenseChemicals & MaterialsHospitality and TourismAnimal Nutrition & WellnessConsumer Goods and ServicesReal Estate and ConstructionHome and Property ImprovementTechnology, Media and TelecomManufacturing Products and ServicesFinancial Services and Investment Intelligence

                                                              © 2025 All rights reserved


                                                              Privacy Policy
                                                              Terms and Conditions
                                                              FAQ