
Key Insights
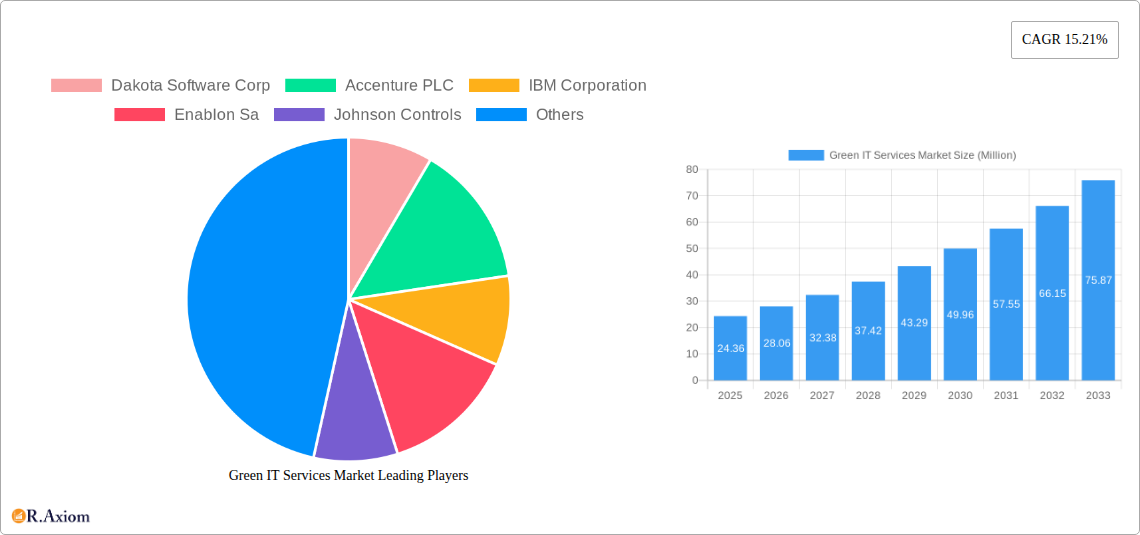
The Green IT services market is experiencing robust growth, projected to reach \$24.36 million in 2025 and exhibiting a Compound Annual Growth Rate (CAGR) of 15.21%. This expansion is driven by increasing regulatory pressure for environmental sustainability, rising corporate social responsibility (CSR) initiatives, and growing awareness of the environmental impact of IT infrastructure. Key drivers include the escalating demand for energy-efficient data centers, the adoption of cloud computing with its inherent scalability and reduced energy consumption, and the implementation of sustainable IT practices across diverse sectors. The market is segmented by type (Software and Services) and end-user vertical (Government, BFSI, IT & Telecom, Industrial, Healthcare, and Others). The software segment is expected to dominate due to increasing demand for innovative green IT solutions, while the services segment will witness significant growth owing to the need for professional expertise in implementing and managing these technologies. North America, particularly the United States, currently holds a significant market share, driven by early adoption of green technologies and stringent environmental regulations. However, the Asia-Pacific region, fueled by rapid economic growth and increasing environmental consciousness, is anticipated to witness substantial growth in the coming years. Companies like Accenture, IBM, and Schneider Electric are key players, leveraging their expertise in IT services and sustainability solutions to capitalize on market opportunities. The market faces some restraints, including high initial investment costs associated with adopting green IT solutions and a lack of awareness regarding the benefits of sustainable IT practices in certain regions. However, government initiatives promoting green technology adoption and rising consumer demand for eco-friendly products are mitigating these challenges, further propelling market expansion.
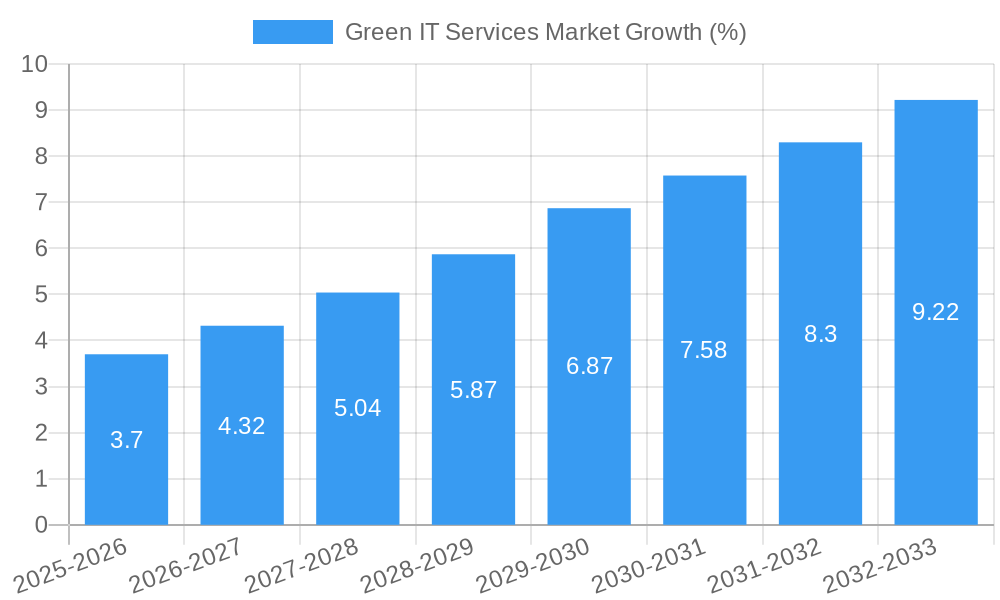
The forecast period (2025-2033) promises continued expansion of the Green IT services market. This growth will be fueled by technological advancements, such as the development of more energy-efficient hardware and software, and the increasing integration of Artificial Intelligence (AI) and Machine Learning (ML) for optimizing energy consumption. The continuous evolution of sustainable business practices and the growing adoption of circular economy principles within the IT sector will further drive market growth. Government regulations and incentives are expected to play a crucial role in accelerating the adoption of green IT solutions across various industries. Competitive landscape analysis indicates that established IT companies and specialized green technology firms will continue to dominate the market. Strategic partnerships, mergers, and acquisitions are anticipated to further shape the competitive dynamics, leading to market consolidation and the emergence of innovative solutions. The ongoing focus on sustainability and the expanding global footprint of eco-conscious businesses will ultimately ensure the long-term growth trajectory of the Green IT services market.
Green IT Services Market: A Comprehensive Report (2019-2033)
This comprehensive report provides an in-depth analysis of the Green IT Services market, offering valuable insights for stakeholders, investors, and industry professionals. Covering the period from 2019 to 2033, with a focus on 2025, this report meticulously examines market dynamics, competitive landscapes, and future growth trajectories. The study period encompasses historical data (2019-2024), the base year (2025), and a detailed forecast (2025-2033). The report is structured to provide actionable intelligence and drive strategic decision-making.
Green IT Services Market Concentration & Innovation
The Green IT Services market exhibits a moderately concentrated landscape, with key players like Accenture PLC, IBM Corporation, Schneider Electric SE, and SAP SE holding significant market share. Precise market share figures for 2025 are estimated at xx%, xx%, xx%, and xx% respectively. However, the market also features several smaller, niche players, fostering innovation and competition.
Innovation Drivers:
- Growing environmental concerns and stringent regulatory frameworks are driving innovation in energy-efficient hardware and software solutions.
- Advancements in cloud computing, AI, and IoT are creating opportunities for green IT solutions with improved resource optimization.
- Increased focus on sustainability initiatives by organizations is fueling demand for green IT services.
Regulatory Frameworks & Substitutes:
Government regulations promoting energy efficiency and carbon reduction are influencing market growth. While direct substitutes are limited, traditional IT solutions face increasing competitive pressure due to the cost-effectiveness and environmental benefits of green alternatives.
End-User Trends & M&A Activities:
End-users are increasingly prioritizing sustainability, creating a strong demand for green IT solutions. Mergers and acquisitions (M&A) activity in this sector remains moderate, with deal values estimated to total xx Million in 2024. Notable acquisitions included [Insert details of any significant M&A activity with deal values if available, otherwise state "Specific deal values are not publicly available."].
Green IT Services Market Industry Trends & Insights
The Green IT Services market is experiencing robust growth, driven by rising environmental awareness, technological advancements, and supportive government policies. The market is projected to achieve a Compound Annual Growth Rate (CAGR) of xx% during the forecast period (2025-2033). This growth is fueled by several factors:
- Technological Disruptions: Advancements in areas like virtualization, cloud computing, and AI are enhancing energy efficiency and reducing the environmental impact of IT infrastructure.
- Consumer Preferences: Consumers are increasingly conscious of their environmental footprint, leading to a growing preference for environmentally responsible products and services, including green IT solutions.
- Competitive Dynamics: Intense competition among established players and emerging startups is driving innovation and affordability, accelerating market penetration.
- Market Penetration: The market penetration of green IT services is steadily increasing across various sectors, with significant growth anticipated in the coming years. By 2033, the estimated penetration is projected to be at xx%.
Dominant Markets & Segments in Green IT Services Market
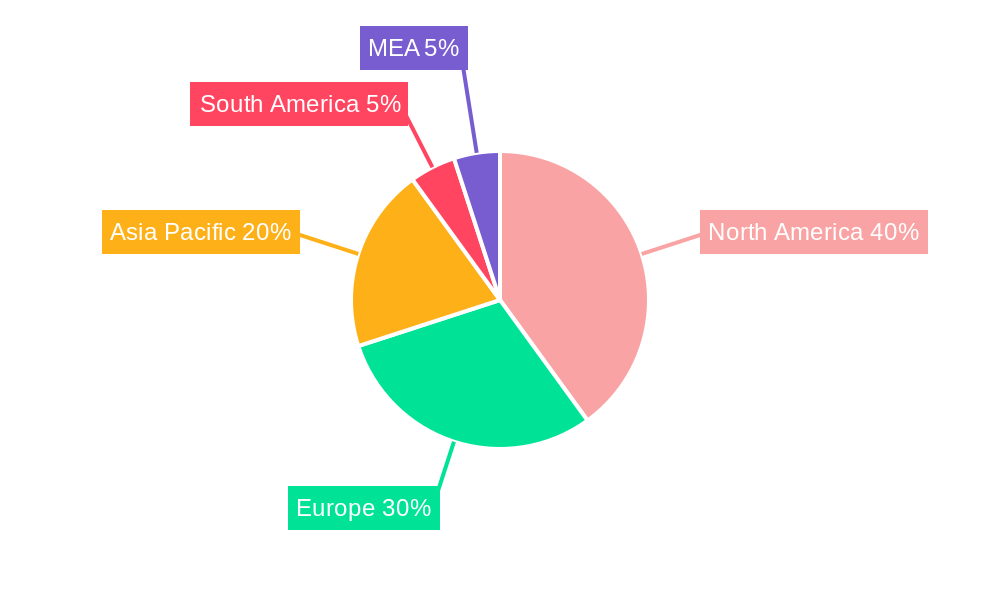
The North American region currently dominates the Green IT Services market, primarily due to strong government support for environmental initiatives, well-established IT infrastructure, and high awareness among consumers and businesses about sustainability. However, the Asia-Pacific region is poised for significant growth due to rapid economic expansion and increasing adoption of green technologies.
Dominant Segments:
By Type: The Software segment is expected to hold the largest market share in 2025, driven by the increasing demand for energy-efficient software solutions and cloud-based services.
By End-user Vertical: The Government segment currently leads in market share, driven by stringent environmental regulations and substantial investments in green infrastructure. However, the BFSI (Banking, Financial Services, and Insurance) sector is expected to witness substantial growth in the coming years due to the increasing adoption of green IT practices for improved efficiency and reduced operational costs. Other significant segments include IT and Telecom and the Industrial sector, both displaying strong growth potential.
Key Drivers:
- Government Policies: Supportive government regulations and incentives are accelerating the adoption of green IT solutions. Examples include tax breaks for energy-efficient equipment and subsidies for renewable energy sources.
- Infrastructure Development: Investments in advanced infrastructure, such as smart grids and high-speed internet, are facilitating the deployment of green IT solutions.
- Economic Factors: Cost savings associated with energy efficiency and reduced carbon footprint are driving economic viability and wide adoption.
Green IT Services Market Product Developments
Recent product innovations focus on improving energy efficiency, reducing carbon emissions, and enhancing the sustainability of IT operations. This includes the development of energy-efficient hardware, software solutions for optimizing resource utilization, and cloud-based services that minimize environmental impact. These advancements are tailored to meet the growing demand for eco-friendly and cost-effective IT solutions across diverse industries. The market fit for these innovations is strong, propelled by rising environmental concerns and the increasing emphasis on sustainable business practices.
Report Scope & Segmentation Analysis
This report provides a comprehensive analysis of the Green IT Services market, segmented by:
By Type:
Software: This segment encompasses software solutions designed to optimize energy consumption and reduce the environmental impact of IT systems. Market size in 2025 is estimated at xx Million, with a projected CAGR of xx% during the forecast period. Competition is high, with a multitude of players offering diverse solutions.
Services: This segment includes consulting, implementation, and maintenance services related to green IT solutions. Its 2025 market size is estimated at xx Million, with a projected CAGR of xx% driven by increasing demand for expertise in green IT implementation.
By End-user Vertical:
Government: This segment is characterized by significant investments in green IT initiatives. The 2025 market size is projected at xx Million, exhibiting a CAGR of xx% due to substantial government funding and stringent environmental regulations.
BFSI: This segment is witnessing rapid growth due to the focus on cost optimization and enhanced operational efficiency. The 2025 market size is estimated at xx Million, with a projected CAGR of xx%.
IT and Telecom: High energy consumption within these sectors drives strong demand for green IT solutions. 2025 market size is estimated at xx Million and a projected CAGR of xx%.
Industrial: This segment faces pressure to improve environmental performance. 2025 market size is estimated at xx Million with a projected CAGR of xx%.
Healthcare: This sector prioritizes operational efficiency and patient care. The 2025 market size is estimated at xx Million with a projected CAGR of xx%.
Other End-user Verticals: This segment encompasses various industries adopting green IT practices. The 2025 market size is estimated at xx Million with a projected CAGR of xx%.
Key Drivers of Green IT Services Market Growth
Several factors contribute to the growth of the Green IT Services market:
Stringent Environmental Regulations: Governments worldwide are implementing stricter regulations to reduce carbon emissions, creating a strong impetus for the adoption of green IT solutions.
Technological Advancements: Continuous innovations in energy-efficient hardware and software are enhancing the capabilities and cost-effectiveness of green IT solutions.
Corporate Social Responsibility: Businesses are increasingly incorporating sustainability into their strategies, boosting demand for green IT services to enhance their environmental performance.
Challenges in the Green IT Services Market Sector
The Green IT Services market faces challenges including:
High Initial Investment Costs: The upfront costs of implementing green IT solutions can be significant, hindering adoption by smaller businesses.
Lack of Awareness: Limited awareness about the benefits of green IT among some businesses and consumers remains a barrier to market expansion.
Interoperability Issues: Ensuring seamless integration of green IT solutions with existing IT infrastructure can be complex and challenging.
Emerging Opportunities in Green IT Services Market
Opportunities exist in:
Expansion into Emerging Markets: Developing economies present significant growth potential due to increasing industrialization and rising awareness of environmental issues.
Development of Innovative Solutions: Focus on developing cutting-edge solutions for specific sectors can capture significant market share.
Partnerships and Collaborations: Strategic alliances between IT providers and sustainability experts can expand market reach and offer comprehensive solutions.
Leading Players in the Green IT Services Market Market
- Dakota Software Corp
- Accenture PLC
- IBM Corporation
- Enablon Sa
- Johnson Controls
- Schneider Electric SE
- Accuvio Sustainability Software
- Enviance Inc
- SAP SE
Key Developments in Green IT Services Market Industry
April 2022: Huawei introduced the "Green and Low Carbon" concept for its Huawei CloudFabric 3.0, focusing on energy efficiency.
February 2022: Super Micro Computer, Inc. unveiled a new short-depth multi-node system optimized for 5G, IoT, and Edge applications, showcasing advancements in green computing technology for high-density environments.
Strategic Outlook for Green IT Services Market Market
The Green IT Services market is poised for significant growth, fueled by escalating environmental concerns, technological advancements, and supportive government policies. The increasing adoption of cloud computing, AI, and IoT presents substantial opportunities for innovation and expansion. The market's future potential lies in developing tailored solutions for diverse sectors, leveraging partnerships to enhance market penetration, and capitalizing on the growing global emphasis on sustainable business practices.
Green IT Services Market Segmentation
-
1. Type
- 1.1. Software
- 1.2. Services
-
2. End-user Vertical
- 2.1. Government
- 2.2. BFSI
- 2.3. IT and Telecom
- 2.4. Industrial
- 2.5. Healthcare
- 2.6. Other End-user Verticals
Green IT Services Market Segmentation By Geography
- 1. North America
- 2. Europe
- 3. Asia Pacific
- 4. Latin America
- 5. Middle East
Green IT Services Market REPORT HIGHLIGHTS
| Aspects | Details |
|---|---|
| Study Period | 2019-2033 |
| Base Year | 2024 |
| Estimated Year | 2025 |
| Forecast Period | 2025-2033 |
| Historical Period | 2019-2024 |
| Growth Rate | CAGR of 15.21% from 2019-2033 |
| Segmentation |
|
Table of Contents
- 1. Introduction
- 1.1. Research Scope
- 1.2. Market Segmentation
- 1.3. Research Methodology
- 1.4. Definitions and Assumptions
- 2. Executive Summary
- 2.1. Introduction
- 3. Market Dynamics
- 3.1. Introduction
- 3.2. Market Drivers
- 3.2.1. Increasing Environmental Concerns and Growing Focus on Reducing Carbon Footprints; Strengthening Government Regulations
- 3.3. Market Restrains
- 3.3.1. Managing Variable Energy and Resource Demands
- 3.4. Market Trends
- 3.4.1. Application in IT and Telecom to Drive the Green IT Service Market
- 4. Market Factor Analysis
- 4.1. Porters Five Forces
- 4.2. Supply/Value Chain
- 4.3. PESTEL analysis
- 4.4. Market Entropy
- 4.5. Patent/Trademark Analysis
- 5. Global Green IT Services Market Analysis, Insights and Forecast, 2019-2031
- 5.1. Market Analysis, Insights and Forecast - by Type
- 5.1.1. Software
- 5.1.2. Services
- 5.2. Market Analysis, Insights and Forecast - by End-user Vertical
- 5.2.1. Government
- 5.2.2. BFSI
- 5.2.3. IT and Telecom
- 5.2.4. Industrial
- 5.2.5. Healthcare
- 5.2.6. Other End-user Verticals
- 5.3. Market Analysis, Insights and Forecast - by Region
- 5.3.1. North America
- 5.3.2. Europe
- 5.3.3. Asia Pacific
- 5.3.4. Latin America
- 5.3.5. Middle East
- 5.1. Market Analysis, Insights and Forecast - by Type
- 6. North America Green IT Services Market Analysis, Insights and Forecast, 2019-2031
- 6.1. Market Analysis, Insights and Forecast - by Type
- 6.1.1. Software
- 6.1.2. Services
- 6.2. Market Analysis, Insights and Forecast - by End-user Vertical
- 6.2.1. Government
- 6.2.2. BFSI
- 6.2.3. IT and Telecom
- 6.2.4. Industrial
- 6.2.5. Healthcare
- 6.2.6. Other End-user Verticals
- 6.1. Market Analysis, Insights and Forecast - by Type
- 7. Europe Green IT Services Market Analysis, Insights and Forecast, 2019-2031
- 7.1. Market Analysis, Insights and Forecast - by Type
- 7.1.1. Software
- 7.1.2. Services
- 7.2. Market Analysis, Insights and Forecast - by End-user Vertical
- 7.2.1. Government
- 7.2.2. BFSI
- 7.2.3. IT and Telecom
- 7.2.4. Industrial
- 7.2.5. Healthcare
- 7.2.6. Other End-user Verticals
- 7.1. Market Analysis, Insights and Forecast - by Type
- 8. Asia Pacific Green IT Services Market Analysis, Insights and Forecast, 2019-2031
- 8.1. Market Analysis, Insights and Forecast - by Type
- 8.1.1. Software
- 8.1.2. Services
- 8.2. Market Analysis, Insights and Forecast - by End-user Vertical
- 8.2.1. Government
- 8.2.2. BFSI
- 8.2.3. IT and Telecom
- 8.2.4. Industrial
- 8.2.5. Healthcare
- 8.2.6. Other End-user Verticals
- 8.1. Market Analysis, Insights and Forecast - by Type
- 9. Latin America Green IT Services Market Analysis, Insights and Forecast, 2019-2031
- 9.1. Market Analysis, Insights and Forecast - by Type
- 9.1.1. Software
- 9.1.2. Services
- 9.2. Market Analysis, Insights and Forecast - by End-user Vertical
- 9.2.1. Government
- 9.2.2. BFSI
- 9.2.3. IT and Telecom
- 9.2.4. Industrial
- 9.2.5. Healthcare
- 9.2.6. Other End-user Verticals
- 9.1. Market Analysis, Insights and Forecast - by Type
- 10. Middle East Green IT Services Market Analysis, Insights and Forecast, 2019-2031
- 10.1. Market Analysis, Insights and Forecast - by Type
- 10.1.1. Software
- 10.1.2. Services
- 10.2. Market Analysis, Insights and Forecast - by End-user Vertical
- 10.2.1. Government
- 10.2.2. BFSI
- 10.2.3. IT and Telecom
- 10.2.4. Industrial
- 10.2.5. Healthcare
- 10.2.6. Other End-user Verticals
- 10.1. Market Analysis, Insights and Forecast - by Type
- 11. North America Green IT Services Market Analysis, Insights and Forecast, 2019-2031
- 11.1. Market Analysis, Insights and Forecast - By Country/Sub-region
- 11.1.1 United States
- 11.1.2 Canada
- 11.1.3 Mexico
- 12. Europe Green IT Services Market Analysis, Insights and Forecast, 2019-2031
- 12.1. Market Analysis, Insights and Forecast - By Country/Sub-region
- 12.1.1 Germany
- 12.1.2 United Kingdom
- 12.1.3 France
- 12.1.4 Spain
- 12.1.5 Italy
- 12.1.6 Spain
- 12.1.7 Belgium
- 12.1.8 Netherland
- 12.1.9 Nordics
- 12.1.10 Rest of Europe
- 13. Asia Pacific Green IT Services Market Analysis, Insights and Forecast, 2019-2031
- 13.1. Market Analysis, Insights and Forecast - By Country/Sub-region
- 13.1.1 China
- 13.1.2 Japan
- 13.1.3 India
- 13.1.4 South Korea
- 13.1.5 Southeast Asia
- 13.1.6 Australia
- 13.1.7 Indonesia
- 13.1.8 Phillipes
- 13.1.9 Singapore
- 13.1.10 Thailandc
- 13.1.11 Rest of Asia Pacific
- 14. South America Green IT Services Market Analysis, Insights and Forecast, 2019-2031
- 14.1. Market Analysis, Insights and Forecast - By Country/Sub-region
- 14.1.1 Brazil
- 14.1.2 Argentina
- 14.1.3 Peru
- 14.1.4 Chile
- 14.1.5 Colombia
- 14.1.6 Ecuador
- 14.1.7 Venezuela
- 14.1.8 Rest of South America
- 15. North America Green IT Services Market Analysis, Insights and Forecast, 2019-2031
- 15.1. Market Analysis, Insights and Forecast - By Country/Sub-region
- 15.1.1 United States
- 15.1.2 Canada
- 15.1.3 Mexico
- 16. MEA Green IT Services Market Analysis, Insights and Forecast, 2019-2031
- 16.1. Market Analysis, Insights and Forecast - By Country/Sub-region
- 16.1.1 United Arab Emirates
- 16.1.2 Saudi Arabia
- 16.1.3 South Africa
- 16.1.4 Rest of Middle East and Africa
- 17. Competitive Analysis
- 17.1. Global Market Share Analysis 2024
- 17.2. Company Profiles
- 17.2.1 Dakota Software Corp
- 17.2.1.1. Overview
- 17.2.1.2. Products
- 17.2.1.3. SWOT Analysis
- 17.2.1.4. Recent Developments
- 17.2.1.5. Financials (Based on Availability)
- 17.2.2 Accenture PLC
- 17.2.2.1. Overview
- 17.2.2.2. Products
- 17.2.2.3. SWOT Analysis
- 17.2.2.4. Recent Developments
- 17.2.2.5. Financials (Based on Availability)
- 17.2.3 IBM Corporation
- 17.2.3.1. Overview
- 17.2.3.2. Products
- 17.2.3.3. SWOT Analysis
- 17.2.3.4. Recent Developments
- 17.2.3.5. Financials (Based on Availability)
- 17.2.4 Enablon Sa
- 17.2.4.1. Overview
- 17.2.4.2. Products
- 17.2.4.3. SWOT Analysis
- 17.2.4.4. Recent Developments
- 17.2.4.5. Financials (Based on Availability)
- 17.2.5 Johnson Controls
- 17.2.5.1. Overview
- 17.2.5.2. Products
- 17.2.5.3. SWOT Analysis
- 17.2.5.4. Recent Developments
- 17.2.5.5. Financials (Based on Availability)
- 17.2.6 Schneider Electric SE
- 17.2.6.1. Overview
- 17.2.6.2. Products
- 17.2.6.3. SWOT Analysis
- 17.2.6.4. Recent Developments
- 17.2.6.5. Financials (Based on Availability)
- 17.2.7 Accuvio Sustainability Software
- 17.2.7.1. Overview
- 17.2.7.2. Products
- 17.2.7.3. SWOT Analysis
- 17.2.7.4. Recent Developments
- 17.2.7.5. Financials (Based on Availability)
- 17.2.8 Enviance Inc *List Not Exhaustive
- 17.2.8.1. Overview
- 17.2.8.2. Products
- 17.2.8.3. SWOT Analysis
- 17.2.8.4. Recent Developments
- 17.2.8.5. Financials (Based on Availability)
- 17.2.9 SAP SE
- 17.2.9.1. Overview
- 17.2.9.2. Products
- 17.2.9.3. SWOT Analysis
- 17.2.9.4. Recent Developments
- 17.2.9.5. Financials (Based on Availability)
- 17.2.1 Dakota Software Corp
List of Figures
- Figure 1: Global Green IT Services Market Revenue Breakdown (Million, %) by Region 2024 & 2032
- Figure 2: North America Green IT Services Market Revenue (Million), by Country 2024 & 2032
- Figure 3: North America Green IT Services Market Revenue Share (%), by Country 2024 & 2032
- Figure 4: Europe Green IT Services Market Revenue (Million), by Country 2024 & 2032
- Figure 5: Europe Green IT Services Market Revenue Share (%), by Country 2024 & 2032
- Figure 6: Asia Pacific Green IT Services Market Revenue (Million), by Country 2024 & 2032
- Figure 7: Asia Pacific Green IT Services Market Revenue Share (%), by Country 2024 & 2032
- Figure 8: South America Green IT Services Market Revenue (Million), by Country 2024 & 2032
- Figure 9: South America Green IT Services Market Revenue Share (%), by Country 2024 & 2032
- Figure 10: North America Green IT Services Market Revenue (Million), by Country 2024 & 2032
- Figure 11: North America Green IT Services Market Revenue Share (%), by Country 2024 & 2032
- Figure 12: MEA Green IT Services Market Revenue (Million), by Country 2024 & 2032
- Figure 13: MEA Green IT Services Market Revenue Share (%), by Country 2024 & 2032
- Figure 14: North America Green IT Services Market Revenue (Million), by Type 2024 & 2032
- Figure 15: North America Green IT Services Market Revenue Share (%), by Type 2024 & 2032
- Figure 16: North America Green IT Services Market Revenue (Million), by End-user Vertical 2024 & 2032
- Figure 17: North America Green IT Services Market Revenue Share (%), by End-user Vertical 2024 & 2032
- Figure 18: North America Green IT Services Market Revenue (Million), by Country 2024 & 2032
- Figure 19: North America Green IT Services Market Revenue Share (%), by Country 2024 & 2032
- Figure 20: Europe Green IT Services Market Revenue (Million), by Type 2024 & 2032
- Figure 21: Europe Green IT Services Market Revenue Share (%), by Type 2024 & 2032
- Figure 22: Europe Green IT Services Market Revenue (Million), by End-user Vertical 2024 & 2032
- Figure 23: Europe Green IT Services Market Revenue Share (%), by End-user Vertical 2024 & 2032
- Figure 24: Europe Green IT Services Market Revenue (Million), by Country 2024 & 2032
- Figure 25: Europe Green IT Services Market Revenue Share (%), by Country 2024 & 2032
- Figure 26: Asia Pacific Green IT Services Market Revenue (Million), by Type 2024 & 2032
- Figure 27: Asia Pacific Green IT Services Market Revenue Share (%), by Type 2024 & 2032
- Figure 28: Asia Pacific Green IT Services Market Revenue (Million), by End-user Vertical 2024 & 2032
- Figure 29: Asia Pacific Green IT Services Market Revenue Share (%), by End-user Vertical 2024 & 2032
- Figure 30: Asia Pacific Green IT Services Market Revenue (Million), by Country 2024 & 2032
- Figure 31: Asia Pacific Green IT Services Market Revenue Share (%), by Country 2024 & 2032
- Figure 32: Latin America Green IT Services Market Revenue (Million), by Type 2024 & 2032
- Figure 33: Latin America Green IT Services Market Revenue Share (%), by Type 2024 & 2032
- Figure 34: Latin America Green IT Services Market Revenue (Million), by End-user Vertical 2024 & 2032
- Figure 35: Latin America Green IT Services Market Revenue Share (%), by End-user Vertical 2024 & 2032
- Figure 36: Latin America Green IT Services Market Revenue (Million), by Country 2024 & 2032
- Figure 37: Latin America Green IT Services Market Revenue Share (%), by Country 2024 & 2032
- Figure 38: Middle East Green IT Services Market Revenue (Million), by Type 2024 & 2032
- Figure 39: Middle East Green IT Services Market Revenue Share (%), by Type 2024 & 2032
- Figure 40: Middle East Green IT Services Market Revenue (Million), by End-user Vertical 2024 & 2032
- Figure 41: Middle East Green IT Services Market Revenue Share (%), by End-user Vertical 2024 & 2032
- Figure 42: Middle East Green IT Services Market Revenue (Million), by Country 2024 & 2032
- Figure 43: Middle East Green IT Services Market Revenue Share (%), by Country 2024 & 2032
List of Tables
- Table 1: Global Green IT Services Market Revenue Million Forecast, by Region 2019 & 2032
- Table 2: Global Green IT Services Market Revenue Million Forecast, by Type 2019 & 2032
- Table 3: Global Green IT Services Market Revenue Million Forecast, by End-user Vertical 2019 & 2032
- Table 4: Global Green IT Services Market Revenue Million Forecast, by Region 2019 & 2032
- Table 5: Global Green IT Services Market Revenue Million Forecast, by Country 2019 & 2032
- Table 6: United States Green IT Services Market Revenue (Million) Forecast, by Application 2019 & 2032
- Table 7: Canada Green IT Services Market Revenue (Million) Forecast, by Application 2019 & 2032
- Table 8: Mexico Green IT Services Market Revenue (Million) Forecast, by Application 2019 & 2032
- Table 9: Global Green IT Services Market Revenue Million Forecast, by Country 2019 & 2032
- Table 10: Germany Green IT Services Market Revenue (Million) Forecast, by Application 2019 & 2032
- Table 11: United Kingdom Green IT Services Market Revenue (Million) Forecast, by Application 2019 & 2032
- Table 12: France Green IT Services Market Revenue (Million) Forecast, by Application 2019 & 2032
- Table 13: Spain Green IT Services Market Revenue (Million) Forecast, by Application 2019 & 2032
- Table 14: Italy Green IT Services Market Revenue (Million) Forecast, by Application 2019 & 2032
- Table 15: Spain Green IT Services Market Revenue (Million) Forecast, by Application 2019 & 2032
- Table 16: Belgium Green IT Services Market Revenue (Million) Forecast, by Application 2019 & 2032
- Table 17: Netherland Green IT Services Market Revenue (Million) Forecast, by Application 2019 & 2032
- Table 18: Nordics Green IT Services Market Revenue (Million) Forecast, by Application 2019 & 2032
- Table 19: Rest of Europe Green IT Services Market Revenue (Million) Forecast, by Application 2019 & 2032
- Table 20: Global Green IT Services Market Revenue Million Forecast, by Country 2019 & 2032
- Table 21: China Green IT Services Market Revenue (Million) Forecast, by Application 2019 & 2032
- Table 22: Japan Green IT Services Market Revenue (Million) Forecast, by Application 2019 & 2032
- Table 23: India Green IT Services Market Revenue (Million) Forecast, by Application 2019 & 2032
- Table 24: South Korea Green IT Services Market Revenue (Million) Forecast, by Application 2019 & 2032
- Table 25: Southeast Asia Green IT Services Market Revenue (Million) Forecast, by Application 2019 & 2032
- Table 26: Australia Green IT Services Market Revenue (Million) Forecast, by Application 2019 & 2032
- Table 27: Indonesia Green IT Services Market Revenue (Million) Forecast, by Application 2019 & 2032
- Table 28: Phillipes Green IT Services Market Revenue (Million) Forecast, by Application 2019 & 2032
- Table 29: Singapore Green IT Services Market Revenue (Million) Forecast, by Application 2019 & 2032
- Table 30: Thailandc Green IT Services Market Revenue (Million) Forecast, by Application 2019 & 2032
- Table 31: Rest of Asia Pacific Green IT Services Market Revenue (Million) Forecast, by Application 2019 & 2032
- Table 32: Global Green IT Services Market Revenue Million Forecast, by Country 2019 & 2032
- Table 33: Brazil Green IT Services Market Revenue (Million) Forecast, by Application 2019 & 2032
- Table 34: Argentina Green IT Services Market Revenue (Million) Forecast, by Application 2019 & 2032
- Table 35: Peru Green IT Services Market Revenue (Million) Forecast, by Application 2019 & 2032
- Table 36: Chile Green IT Services Market Revenue (Million) Forecast, by Application 2019 & 2032
- Table 37: Colombia Green IT Services Market Revenue (Million) Forecast, by Application 2019 & 2032
- Table 38: Ecuador Green IT Services Market Revenue (Million) Forecast, by Application 2019 & 2032
- Table 39: Venezuela Green IT Services Market Revenue (Million) Forecast, by Application 2019 & 2032
- Table 40: Rest of South America Green IT Services Market Revenue (Million) Forecast, by Application 2019 & 2032
- Table 41: Global Green IT Services Market Revenue Million Forecast, by Country 2019 & 2032
- Table 42: United States Green IT Services Market Revenue (Million) Forecast, by Application 2019 & 2032
- Table 43: Canada Green IT Services Market Revenue (Million) Forecast, by Application 2019 & 2032
- Table 44: Mexico Green IT Services Market Revenue (Million) Forecast, by Application 2019 & 2032
- Table 45: Global Green IT Services Market Revenue Million Forecast, by Country 2019 & 2032
- Table 46: United Arab Emirates Green IT Services Market Revenue (Million) Forecast, by Application 2019 & 2032
- Table 47: Saudi Arabia Green IT Services Market Revenue (Million) Forecast, by Application 2019 & 2032
- Table 48: South Africa Green IT Services Market Revenue (Million) Forecast, by Application 2019 & 2032
- Table 49: Rest of Middle East and Africa Green IT Services Market Revenue (Million) Forecast, by Application 2019 & 2032
- Table 50: Global Green IT Services Market Revenue Million Forecast, by Type 2019 & 2032
- Table 51: Global Green IT Services Market Revenue Million Forecast, by End-user Vertical 2019 & 2032
- Table 52: Global Green IT Services Market Revenue Million Forecast, by Country 2019 & 2032
- Table 53: Global Green IT Services Market Revenue Million Forecast, by Type 2019 & 2032
- Table 54: Global Green IT Services Market Revenue Million Forecast, by End-user Vertical 2019 & 2032
- Table 55: Global Green IT Services Market Revenue Million Forecast, by Country 2019 & 2032
- Table 56: Global Green IT Services Market Revenue Million Forecast, by Type 2019 & 2032
- Table 57: Global Green IT Services Market Revenue Million Forecast, by End-user Vertical 2019 & 2032
- Table 58: Global Green IT Services Market Revenue Million Forecast, by Country 2019 & 2032
- Table 59: Global Green IT Services Market Revenue Million Forecast, by Type 2019 & 2032
- Table 60: Global Green IT Services Market Revenue Million Forecast, by End-user Vertical 2019 & 2032
- Table 61: Global Green IT Services Market Revenue Million Forecast, by Country 2019 & 2032
- Table 62: Global Green IT Services Market Revenue Million Forecast, by Type 2019 & 2032
- Table 63: Global Green IT Services Market Revenue Million Forecast, by End-user Vertical 2019 & 2032
- Table 64: Global Green IT Services Market Revenue Million Forecast, by Country 2019 & 2032
Frequently Asked Questions
1. What is the projected Compound Annual Growth Rate (CAGR) of the Green IT Services Market?
The projected CAGR is approximately 15.21%.
2. Which companies are prominent players in the Green IT Services Market?
Key companies in the market include Dakota Software Corp, Accenture PLC, IBM Corporation, Enablon Sa, Johnson Controls, Schneider Electric SE, Accuvio Sustainability Software, Enviance Inc *List Not Exhaustive, SAP SE.
3. What are the main segments of the Green IT Services Market?
The market segments include Type, End-user Vertical.
4. Can you provide details about the market size?
The market size is estimated to be USD 24.36 Million as of 2022.
5. What are some drivers contributing to market growth?
Increasing Environmental Concerns and Growing Focus on Reducing Carbon Footprints; Strengthening Government Regulations.
6. What are the notable trends driving market growth?
Application in IT and Telecom to Drive the Green IT Service Market.
7. Are there any restraints impacting market growth?
Managing Variable Energy and Resource Demands.
8. Can you provide examples of recent developments in the market?
April 2022 - Huawei proposed the "Green and Low Carbon" concept at the Huawei Global Analyst Summit (HAS) 2022 for its Huawei CloudFabric 3.0 Hyper-Converged Data Center Network (DCN) Solution in order to use lossless networks to improve computing efficiency and reduce computing footprint and embrace green computing.
9. What pricing options are available for accessing the report?
Pricing options include single-user, multi-user, and enterprise licenses priced at USD 4750, USD 5250, and USD 8750 respectively.
10. Is the market size provided in terms of value or volume?
The market size is provided in terms of value, measured in Million.
11. Are there any specific market keywords associated with the report?
Yes, the market keyword associated with the report is "Green IT Services Market," which aids in identifying and referencing the specific market segment covered.
12. How do I determine which pricing option suits my needs best?
The pricing options vary based on user requirements and access needs. Individual users may opt for single-user licenses, while businesses requiring broader access may choose multi-user or enterprise licenses for cost-effective access to the report.
13. Are there any additional resources or data provided in the Green IT Services Market report?
While the report offers comprehensive insights, it's advisable to review the specific contents or supplementary materials provided to ascertain if additional resources or data are available.
14. How can I stay updated on further developments or reports in the Green IT Services Market?
To stay informed about further developments, trends, and reports in the Green IT Services Market, consider subscribing to industry newsletters, following relevant companies and organizations, or regularly checking reputable industry news sources and publications.
Methodology
Step 1 - Identification of Relevant Samples Size from Population Database


Step 2 - Approaches for Defining Global Market Size (Value, Volume* & Price*)

Note*: In applicable scenarios
Step 3 - Data Sources
Primary Research
- Web Analytics
- Survey Reports
- Research Institute
- Latest Research Reports
- Opinion Leaders
Secondary Research
- Annual Reports
- White Paper
- Latest Press Release
- Industry Association
- Paid Database
- Investor Presentations

Step 4 - Data Triangulation
Involves using different sources of information in order to increase the validity of a study
These sources are likely to be stakeholders in a program - participants, other researchers, program staff, other community members, and so on.
Then we put all data in single framework & apply various statistical tools to find out the dynamic on the market.
During the analysis stage, feedback from the stakeholder groups would be compared to determine areas of agreement as well as areas of divergence


