

Key Insights
The Gulf of Mexico Oil & Gas Decommissioning market is poised for significant expansion, driven by aging offshore infrastructure and stringent environmental remediation mandates. Projections indicate robust growth throughout the forecast period, underscored by the essential need to safely and responsibly dismantle obsolete oil and gas assets. The estimated market size for 2025 is $11.1 billion, with a projected Compound Annual Growth Rate (CAGR) of 6.5% from 2025 to 2033. This growth is attributed to an increasing number of platforms nearing end-of-life, rising decommissioning costs influenced by technological innovation and stricter environmental regulations, and the escalating demand for specialized decommissioning services.
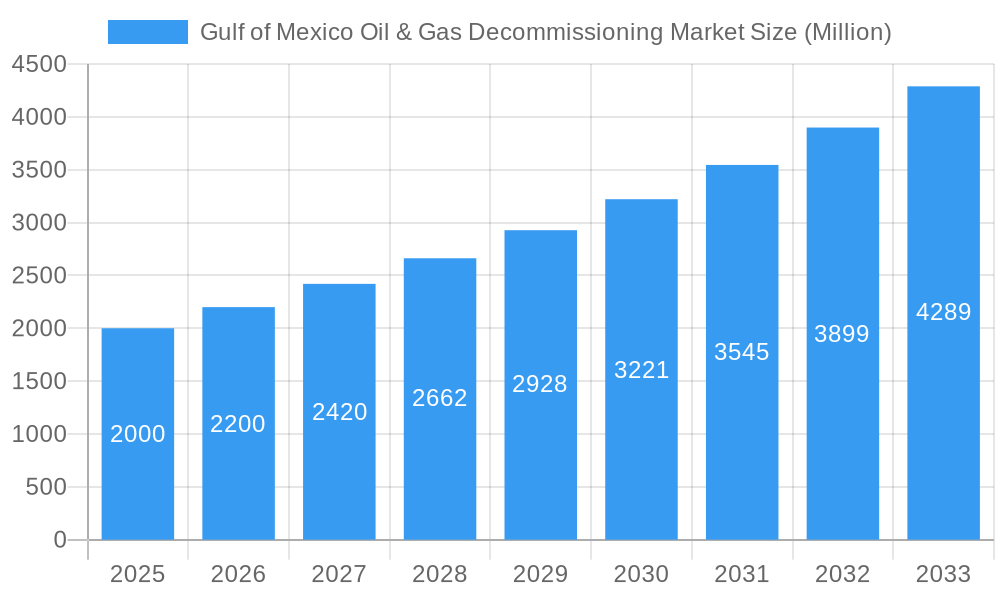
Gulf of Mexico Oil & Gas Decommissioning Market Market Size (In Billion)
Decommissioning projects necessitate substantial investment, presenting both challenges and opportunities. Key challenges include securing skilled labor, obtaining adequate financing, and navigating intricate regulatory landscapes. Conversely, these challenges create significant opportunities for specialized service providers, technology developers, and investors. The market is witnessing rapid advancements in technologies such as robotics and remotely operated vehicles (ROVs), which are enhancing efficiency, minimizing environmental impact, and ultimately reducing long-term project costs. A strong emphasis on sustainable decommissioning practices, supported by governmental incentives and increasingly rigorous environmental regulations, will continue to shape market dynamics. The Gulf of Mexico's distinct geographical and operational conditions will consistently introduce unique challenges and opportunities, fostering a dynamic and evolving market landscape.
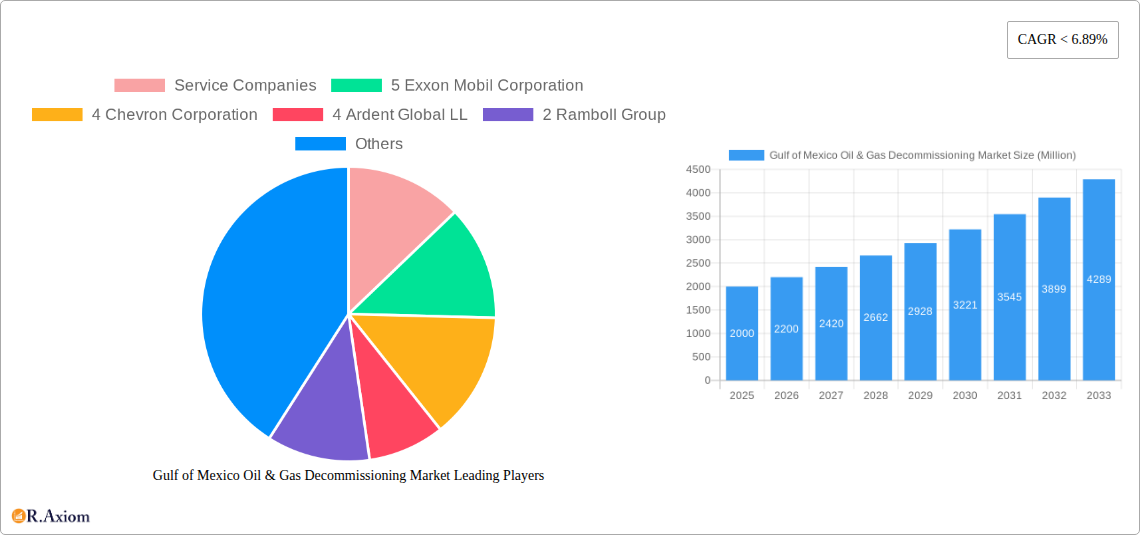
Gulf of Mexico Oil & Gas Decommissioning Market Company Market Share
Gulf of Mexico Oil & Gas Decommissioning Market: A Comprehensive Report (2019-2033)
This detailed report provides a comprehensive analysis of the Gulf of Mexico Oil & Gas Decommissioning market, offering invaluable insights for industry stakeholders, investors, and strategic decision-makers. The study covers the period from 2019 to 2033, with a focus on the 2025-2033 forecast period. The base year for the analysis is 2025. This report leverages rigorous research methodologies and incorporates both historical data and future projections to present a clear and actionable understanding of this dynamic market.
Gulf of Mexico Oil & Gas Decommissioning Market Market Concentration & Innovation
This section analyzes the competitive landscape of the Gulf of Mexico oil & gas decommissioning market, examining market concentration, innovation drivers, regulatory frameworks, and M&A activities. The market is characterized by a moderate level of concentration, with a few major players holding significant market share. Exxon Mobil Corporation and Chevron Corporation, for example, collectively account for a significant portion (approximately xx%) of the overall market. Smaller, specialized service companies also play a crucial role, often focusing on niche decommissioning services.
- Market Share: Exxon Mobil Corporation (xx%), Chevron Corporation (xx%), Ardent Global LL (xx%), Ramboll Group (xx%), others (xx%).
- M&A Activity: The past five years have witnessed xx major M&A deals in the Gulf of Mexico decommissioning sector, with a total transaction value exceeding $xx Million. These transactions reflect a trend toward consolidation and the acquisition of specialized expertise.
- Innovation Drivers: Stringent environmental regulations, advancements in decommissioning technologies (e.g., robotics, remotely operated vehicles), and the need for cost-effective solutions are key drivers of innovation. The increasing focus on sustainable decommissioning practices is also driving the adoption of environmentally friendly technologies.
- Regulatory Framework: The Bureau of Safety and Environmental Enforcement (BSEE) plays a critical role in setting regulations and standards for decommissioning activities in the Gulf of Mexico. These regulations are constantly evolving, reflecting the growing focus on environmental protection.
Gulf of Mexico Oil & Gas Decommissioning Market Industry Trends & Insights
The Gulf of Mexico oil & gas decommissioning market is experiencing substantial growth, driven by several factors. The aging infrastructure of existing oil and gas platforms, coupled with increased regulatory scrutiny and environmental concerns, is necessitating a large-scale decommissioning effort. The market is projected to witness a Compound Annual Growth Rate (CAGR) of xx% from 2025 to 2033, reaching a market size of $xx Million by 2033. This growth is fueled by a combination of factors, including technological advancements that are making decommissioning more efficient and cost-effective. The increasing emphasis on responsible environmental stewardship is also pushing operators towards more sustainable decommissioning practices. Market penetration for innovative decommissioning technologies is expected to increase significantly in the coming years, especially those focusing on minimizing environmental impact. Competitive dynamics are characterized by both established players and new entrants vying for market share.
Dominant Markets & Segments in Gulf of Mexico Oil & Gas Decommissioning Market
The Deepwater segment dominates the Gulf of Mexico oil & gas decommissioning market, driven by the higher concentration of aging deepwater platforms requiring decommissioning. The shallow water segment also presents significant opportunities, though the scale of operations is relatively smaller compared to deepwater.
- Deepwater Dominance:
- Key Drivers: Large number of aging deepwater platforms, complex decommissioning operations requiring specialized expertise and equipment, higher decommissioning costs associated with deepwater operations.
- Shallow Water Segment:
- Key Drivers: Simpler decommissioning operations, lower costs compared to deepwater, growing focus on decommissioning smaller platforms and infrastructure.
Gulf of Mexico Oil & Gas Decommissioning Market Product Developments
Recent product innovations focus on enhancing efficiency, safety, and environmental sustainability. This includes advancements in subsea decommissioning technologies, remotely operated vehicles (ROVs), and improved waste management solutions. These innovations are aimed at reducing decommissioning timeframes, minimizing environmental impact, and lowering overall costs. The market is witnessing increasing adoption of automation and digital technologies to improve operational efficiency and data management.
Report Scope & Segmentation Analysis
This report segments the Gulf of Mexico oil & gas decommissioning market by water depth:
Shallow Water: This segment encompasses decommissioning activities in relatively shallower waters, characterized by simpler operational procedures and lower costs. The market is projected to grow at a CAGR of xx% during the forecast period. Competitive dynamics in this segment are characterized by a mix of both larger established companies and smaller, specialized service providers.
Deepwater: This segment dominates the market due to the high concentration of aging deepwater platforms requiring decommissioning. Decommissioning in deepwater presents more complex technical and logistical challenges, driving higher costs and requiring specialized expertise. The market is projected to grow at a CAGR of xx% during the forecast period.
Key Drivers of Gulf of Mexico Oil & Gas Decommissioning Market Growth
Several factors drive growth in this market: stringent environmental regulations necessitating responsible decommissioning, aging oil & gas infrastructure requiring significant investment for decommissioning, technological advancements leading to more efficient and cost-effective decommissioning practices, and increasing government support for sustainable practices.
Challenges in the Gulf of Mexico Oil & Gas Decommissioning Market Sector
Key challenges include the high costs associated with deepwater decommissioning, regulatory complexities and approvals, technological limitations in handling complex subsea infrastructure, and the potential for environmental incidents. These challenges can significantly impact project timelines and overall costs.
Emerging Opportunities in Gulf of Mexico Oil & Gas Decommissioning Market
Emerging opportunities exist in the development and deployment of innovative decommissioning technologies, particularly those focusing on automation, robotics, and sustainable waste management. Furthermore, the growth of decommissioning in shallow water provides opportunities for smaller players to enter the market. Finally, the exploration of alternative decommissioning strategies, such as platform repurposing or partial removal, offers potential for cost savings and reduced environmental impact.
Leading Players in the Gulf of Mexico Oil & Gas Decommissioning Market Market
- Exxon Mobil Corporation
- Chevron Corporation
- Ardent Global LL
- Ramboll Group
- Apache Corporation
- Proserv Group Inc
- TETRA Technologies Inc
- Anadarko Petroleum Corporation
- BP P L C
Key Developments in Gulf of Mexico Oil & Gas Decommissioning Market Industry
- 2022-Q4: Introduction of a new remotely operated vehicle (ROV) by a major service provider significantly enhancing subsea decommissioning capabilities.
- 2023-Q1: Successful completion of a large-scale deepwater platform decommissioning project, showcasing improved efficiency and safety protocols.
- 2024-Q2: Major oil and gas operator announces a significant investment in sustainable decommissioning technologies.
Strategic Outlook for Gulf of Mexico Oil & Gas Decommissioning Market Market
The Gulf of Mexico oil & gas decommissioning market presents substantial growth opportunities in the coming years. Continued investment in technological innovation, coupled with stringent environmental regulations and the need for responsible decommissioning practices, will fuel market expansion. Companies with expertise in sustainable decommissioning technologies and a strong understanding of regulatory requirements are well-positioned to capitalize on the growing demand.
Gulf of Mexico Oil & Gas Decommissioning Market Segmentation
-
1. Water Depth
- 1.1. Shallow Water
- 1.2. Deepwater
Gulf of Mexico Oil & Gas Decommissioning Market Segmentation By Geography
-
1. North America
- 1.1. United States
- 1.2. Canada
- 1.3. Mexico
-
2. South America
- 2.1. Brazil
- 2.2. Argentina
- 2.3. Rest of South America
-
3. Europe
- 3.1. United Kingdom
- 3.2. Germany
- 3.3. France
- 3.4. Italy
- 3.5. Spain
- 3.6. Russia
- 3.7. Benelux
- 3.8. Nordics
- 3.9. Rest of Europe
-
4. Middle East & Africa
- 4.1. Turkey
- 4.2. Israel
- 4.3. GCC
- 4.4. North Africa
- 4.5. South Africa
- 4.6. Rest of Middle East & Africa
-
5. Asia Pacific
- 5.1. China
- 5.2. India
- 5.3. Japan
- 5.4. South Korea
- 5.5. ASEAN
- 5.6. Oceania
- 5.7. Rest of Asia Pacific
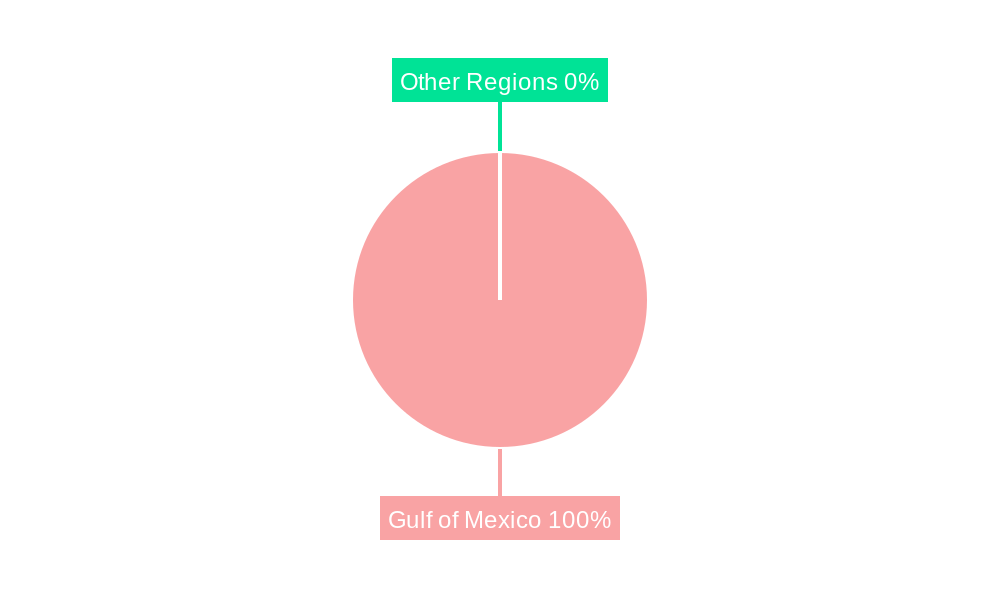
Gulf of Mexico Oil & Gas Decommissioning Market Regional Market Share
Geographic Coverage of Gulf of Mexico Oil & Gas Decommissioning Market
Gulf of Mexico Oil & Gas Decommissioning Market REPORT HIGHLIGHTS
| Aspects | Details |
|---|---|
| Study Period | 2020-2034 |
| Base Year | 2025 |
| Estimated Year | 2026 |
| Forecast Period | 2026-2034 |
| Historical Period | 2020-2025 |
| Growth Rate | CAGR of 6.5% from 2020-2034 |
| Segmentation |
|
Table of Contents
- 1. Introduction
- 1.1. Research Scope
- 1.2. Market Segmentation
- 1.3. Research Objective
- 1.4. Definitions and Assumptions
- 2. Executive Summary
- 2.1. Market Snapshot
- 3. Market Dynamics
- 3.1. Market Drivers
- 3.2. Market Restrains
- 3.3. Market Trends
- 3.4. Market Opportunities
- 4. Market Factor Analysis
- 4.1. Porters Five Forces
- 4.1.1. Bargaining Power of Suppliers
- 4.1.2. Bargaining Power of Buyers
- 4.1.3. Threat of New Entrants
- 4.1.4. Threat of Substitutes
- 4.1.5. Competitive Rivalry
- 4.2. PESTEL analysis
- 4.3. BCG Analysis
- 4.3.1. Stars (High Growth, High Market Share)
- 4.3.2. Cash Cows (Low Growth, High Market Share)
- 4.3.3. Question Mark (High Growth, Low Market Share)
- 4.3.4. Dogs (Low Growth, Low Market Share)
- 4.4. Ansoff Matrix Analysis
- 4.5. Supply Chain Analysis
- 4.6. Regulatory Landscape
- 4.7. Current Market Potential and Opportunity Assessment (TAM–SAM–SOM Framework)
- 4.8. RAX Analyst Note
- 4.1. Porters Five Forces
- 5. Market Analysis, Insights and Forecast 2021-2033
- 5.1. Market Analysis, Insights and Forecast - by Water Depth
- 5.1.1. Shallow Water
- 5.1.2. Deepwater
- 5.2. Market Analysis, Insights and Forecast - by Region
- 5.2.1. North America
- 5.2.2. South America
- 5.2.3. Europe
- 5.2.4. Middle East & Africa
- 5.2.5. Asia Pacific
- 5.1. Market Analysis, Insights and Forecast - by Water Depth
- 6. Global Gulf of Mexico Oil & Gas Decommissioning Market Analysis, Insights and Forecast, 2021-2033
- 6.1. Market Analysis, Insights and Forecast - by Water Depth
- 6.1.1. Shallow Water
- 6.1.2. Deepwater
- 6.1. Market Analysis, Insights and Forecast - by Water Depth
- 7. North America Gulf of Mexico Oil & Gas Decommissioning Market Analysis, Insights and Forecast, 2020-2032
- 7.1. Market Analysis, Insights and Forecast - by Water Depth
- 7.1.1. Shallow Water
- 7.1.2. Deepwater
- 7.1. Market Analysis, Insights and Forecast - by Water Depth
- 8. South America Gulf of Mexico Oil & Gas Decommissioning Market Analysis, Insights and Forecast, 2020-2032
- 8.1. Market Analysis, Insights and Forecast - by Water Depth
- 8.1.1. Shallow Water
- 8.1.2. Deepwater
- 8.1. Market Analysis, Insights and Forecast - by Water Depth
- 9. Europe Gulf of Mexico Oil & Gas Decommissioning Market Analysis, Insights and Forecast, 2020-2032
- 9.1. Market Analysis, Insights and Forecast - by Water Depth
- 9.1.1. Shallow Water
- 9.1.2. Deepwater
- 9.1. Market Analysis, Insights and Forecast - by Water Depth
- 10. Middle East & Africa Gulf of Mexico Oil & Gas Decommissioning Market Analysis, Insights and Forecast, 2020-2032
- 10.1. Market Analysis, Insights and Forecast - by Water Depth
- 10.1.1. Shallow Water
- 10.1.2. Deepwater
- 10.1. Market Analysis, Insights and Forecast - by Water Depth
- 11. Asia Pacific Gulf of Mexico Oil & Gas Decommissioning Market Analysis, Insights and Forecast, 2020-2032
- 11.1. Market Analysis, Insights and Forecast - by Water Depth
- 11.1.1. Shallow Water
- 11.1.2. Deepwater
- 11.1. Market Analysis, Insights and Forecast - by Water Depth
- 12. Competitive Analysis
- 12.1. Company Profiles
- 12.1.1 Service Companies
- 12.1.1.1. Company Overview
- 12.1.1.2. Products
- 12.1.1.3. Company Financials
- 12.1.1.4. SWOT Analysis
- 12.1.2 5 Exxon Mobil Corporation
- 12.1.2.1. Company Overview
- 12.1.2.2. Products
- 12.1.2.3. Company Financials
- 12.1.2.4. SWOT Analysis
- 12.1.3 4 Chevron Corporation
- 12.1.3.1. Company Overview
- 12.1.3.2. Products
- 12.1.3.3. Company Financials
- 12.1.3.4. SWOT Analysis
- 12.1.4 4 Ardent Global LL
- 12.1.4.1. Company Overview
- 12.1.4.2. Products
- 12.1.4.3. Company Financials
- 12.1.4.4. SWOT Analysis
- 12.1.5 2 Ramboll Group
- 12.1.5.1. Company Overview
- 12.1.5.2. Products
- 12.1.5.3. Company Financials
- 12.1.5.4. SWOT Analysis
- 12.1.6 2 Apache Corporation
- 12.1.6.1. Company Overview
- 12.1.6.2. Products
- 12.1.6.3. Company Financials
- 12.1.6.4. SWOT Analysis
- 12.1.7 1 Proserv Group Inc
- 12.1.7.1. Company Overview
- 12.1.7.2. Products
- 12.1.7.3. Company Financials
- 12.1.7.4. SWOT Analysis
- 12.1.8 Operators
- 12.1.8.1. Company Overview
- 12.1.8.2. Products
- 12.1.8.3. Company Financials
- 12.1.8.4. SWOT Analysis
- 12.1.9 3 TETRA Technologies Inc
- 12.1.9.1. Company Overview
- 12.1.9.2. Products
- 12.1.9.3. Company Financials
- 12.1.9.4. SWOT Analysis
- 12.1.10 1 Anadarko Petroleum Corporation
- 12.1.10.1. Company Overview
- 12.1.10.2. Products
- 12.1.10.3. Company Financials
- 12.1.10.4. SWOT Analysis
- 12.1.11 3 BP P L C
- 12.1.11.1. Company Overview
- 12.1.11.2. Products
- 12.1.11.3. Company Financials
- 12.1.11.4. SWOT Analysis
- 12.1.1 Service Companies
- 12.2. Market Entropy
- 12.2.1 Company's Key Areas Served
- 12.2.2 Recent Developments
- 12.3. Company Market Share Analysis 2025
- 12.3.1 Top 5 Companies Market Share Analysis
- 12.3.2 Top 3 Companies Market Share Analysis
- 12.4. List of Potential Customers
- 13. Research Methodology
List of Figures
- Figure 1: Global Gulf of Mexico Oil & Gas Decommissioning Market Revenue Breakdown (billion, %) by Region 2025 & 2033
- Figure 2: North America Gulf of Mexico Oil & Gas Decommissioning Market Revenue (billion), by Water Depth 2025 & 2033
- Figure 3: North America Gulf of Mexico Oil & Gas Decommissioning Market Revenue Share (%), by Water Depth 2025 & 2033
- Figure 4: North America Gulf of Mexico Oil & Gas Decommissioning Market Revenue (billion), by Country 2025 & 2033
- Figure 5: North America Gulf of Mexico Oil & Gas Decommissioning Market Revenue Share (%), by Country 2025 & 2033
- Figure 6: South America Gulf of Mexico Oil & Gas Decommissioning Market Revenue (billion), by Water Depth 2025 & 2033
- Figure 7: South America Gulf of Mexico Oil & Gas Decommissioning Market Revenue Share (%), by Water Depth 2025 & 2033
- Figure 8: South America Gulf of Mexico Oil & Gas Decommissioning Market Revenue (billion), by Country 2025 & 2033
- Figure 9: South America Gulf of Mexico Oil & Gas Decommissioning Market Revenue Share (%), by Country 2025 & 2033
- Figure 10: Europe Gulf of Mexico Oil & Gas Decommissioning Market Revenue (billion), by Water Depth 2025 & 2033
- Figure 11: Europe Gulf of Mexico Oil & Gas Decommissioning Market Revenue Share (%), by Water Depth 2025 & 2033
- Figure 12: Europe Gulf of Mexico Oil & Gas Decommissioning Market Revenue (billion), by Country 2025 & 2033
- Figure 13: Europe Gulf of Mexico Oil & Gas Decommissioning Market Revenue Share (%), by Country 2025 & 2033
- Figure 14: Middle East & Africa Gulf of Mexico Oil & Gas Decommissioning Market Revenue (billion), by Water Depth 2025 & 2033
- Figure 15: Middle East & Africa Gulf of Mexico Oil & Gas Decommissioning Market Revenue Share (%), by Water Depth 2025 & 2033
- Figure 16: Middle East & Africa Gulf of Mexico Oil & Gas Decommissioning Market Revenue (billion), by Country 2025 & 2033
- Figure 17: Middle East & Africa Gulf of Mexico Oil & Gas Decommissioning Market Revenue Share (%), by Country 2025 & 2033
- Figure 18: Asia Pacific Gulf of Mexico Oil & Gas Decommissioning Market Revenue (billion), by Water Depth 2025 & 2033
- Figure 19: Asia Pacific Gulf of Mexico Oil & Gas Decommissioning Market Revenue Share (%), by Water Depth 2025 & 2033
- Figure 20: Asia Pacific Gulf of Mexico Oil & Gas Decommissioning Market Revenue (billion), by Country 2025 & 2033
- Figure 21: Asia Pacific Gulf of Mexico Oil & Gas Decommissioning Market Revenue Share (%), by Country 2025 & 2033
List of Tables
- Table 1: Global Gulf of Mexico Oil & Gas Decommissioning Market Revenue billion Forecast, by Water Depth 2020 & 2033
- Table 2: Global Gulf of Mexico Oil & Gas Decommissioning Market Revenue billion Forecast, by Region 2020 & 2033
- Table 3: Global Gulf of Mexico Oil & Gas Decommissioning Market Revenue billion Forecast, by Water Depth 2020 & 2033
- Table 4: Global Gulf of Mexico Oil & Gas Decommissioning Market Revenue billion Forecast, by Country 2020 & 2033
- Table 5: United States Gulf of Mexico Oil & Gas Decommissioning Market Revenue (billion) Forecast, by Application 2020 & 2033
- Table 6: Canada Gulf of Mexico Oil & Gas Decommissioning Market Revenue (billion) Forecast, by Application 2020 & 2033
- Table 7: Mexico Gulf of Mexico Oil & Gas Decommissioning Market Revenue (billion) Forecast, by Application 2020 & 2033
- Table 8: Global Gulf of Mexico Oil & Gas Decommissioning Market Revenue billion Forecast, by Water Depth 2020 & 2033
- Table 9: Global Gulf of Mexico Oil & Gas Decommissioning Market Revenue billion Forecast, by Country 2020 & 2033
- Table 10: Brazil Gulf of Mexico Oil & Gas Decommissioning Market Revenue (billion) Forecast, by Application 2020 & 2033
- Table 11: Argentina Gulf of Mexico Oil & Gas Decommissioning Market Revenue (billion) Forecast, by Application 2020 & 2033
- Table 12: Rest of South America Gulf of Mexico Oil & Gas Decommissioning Market Revenue (billion) Forecast, by Application 2020 & 2033
- Table 13: Global Gulf of Mexico Oil & Gas Decommissioning Market Revenue billion Forecast, by Water Depth 2020 & 2033
- Table 14: Global Gulf of Mexico Oil & Gas Decommissioning Market Revenue billion Forecast, by Country 2020 & 2033
- Table 15: United Kingdom Gulf of Mexico Oil & Gas Decommissioning Market Revenue (billion) Forecast, by Application 2020 & 2033
- Table 16: Germany Gulf of Mexico Oil & Gas Decommissioning Market Revenue (billion) Forecast, by Application 2020 & 2033
- Table 17: France Gulf of Mexico Oil & Gas Decommissioning Market Revenue (billion) Forecast, by Application 2020 & 2033
- Table 18: Italy Gulf of Mexico Oil & Gas Decommissioning Market Revenue (billion) Forecast, by Application 2020 & 2033
- Table 19: Spain Gulf of Mexico Oil & Gas Decommissioning Market Revenue (billion) Forecast, by Application 2020 & 2033
- Table 20: Russia Gulf of Mexico Oil & Gas Decommissioning Market Revenue (billion) Forecast, by Application 2020 & 2033
- Table 21: Benelux Gulf of Mexico Oil & Gas Decommissioning Market Revenue (billion) Forecast, by Application 2020 & 2033
- Table 22: Nordics Gulf of Mexico Oil & Gas Decommissioning Market Revenue (billion) Forecast, by Application 2020 & 2033
- Table 23: Rest of Europe Gulf of Mexico Oil & Gas Decommissioning Market Revenue (billion) Forecast, by Application 2020 & 2033
- Table 24: Global Gulf of Mexico Oil & Gas Decommissioning Market Revenue billion Forecast, by Water Depth 2020 & 2033
- Table 25: Global Gulf of Mexico Oil & Gas Decommissioning Market Revenue billion Forecast, by Country 2020 & 2033
- Table 26: Turkey Gulf of Mexico Oil & Gas Decommissioning Market Revenue (billion) Forecast, by Application 2020 & 2033
- Table 27: Israel Gulf of Mexico Oil & Gas Decommissioning Market Revenue (billion) Forecast, by Application 2020 & 2033
- Table 28: GCC Gulf of Mexico Oil & Gas Decommissioning Market Revenue (billion) Forecast, by Application 2020 & 2033
- Table 29: North Africa Gulf of Mexico Oil & Gas Decommissioning Market Revenue (billion) Forecast, by Application 2020 & 2033
- Table 30: South Africa Gulf of Mexico Oil & Gas Decommissioning Market Revenue (billion) Forecast, by Application 2020 & 2033
- Table 31: Rest of Middle East & Africa Gulf of Mexico Oil & Gas Decommissioning Market Revenue (billion) Forecast, by Application 2020 & 2033
- Table 32: Global Gulf of Mexico Oil & Gas Decommissioning Market Revenue billion Forecast, by Water Depth 2020 & 2033
- Table 33: Global Gulf of Mexico Oil & Gas Decommissioning Market Revenue billion Forecast, by Country 2020 & 2033
- Table 34: China Gulf of Mexico Oil & Gas Decommissioning Market Revenue (billion) Forecast, by Application 2020 & 2033
- Table 35: India Gulf of Mexico Oil & Gas Decommissioning Market Revenue (billion) Forecast, by Application 2020 & 2033
- Table 36: Japan Gulf of Mexico Oil & Gas Decommissioning Market Revenue (billion) Forecast, by Application 2020 & 2033
- Table 37: South Korea Gulf of Mexico Oil & Gas Decommissioning Market Revenue (billion) Forecast, by Application 2020 & 2033
- Table 38: ASEAN Gulf of Mexico Oil & Gas Decommissioning Market Revenue (billion) Forecast, by Application 2020 & 2033
- Table 39: Oceania Gulf of Mexico Oil & Gas Decommissioning Market Revenue (billion) Forecast, by Application 2020 & 2033
- Table 40: Rest of Asia Pacific Gulf of Mexico Oil & Gas Decommissioning Market Revenue (billion) Forecast, by Application 2020 & 2033
Frequently Asked Questions
1. What is the projected Compound Annual Growth Rate (CAGR) of the Gulf of Mexico Oil & Gas Decommissioning Market?
The projected CAGR is approximately 6.5%.
2. Which companies are prominent players in the Gulf of Mexico Oil & Gas Decommissioning Market?
Key companies in the market include Service Companies, 5 Exxon Mobil Corporation, 4 Chevron Corporation, 4 Ardent Global LL, 2 Ramboll Group, 2 Apache Corporation, 1 Proserv Group Inc, Operators, 3 TETRA Technologies Inc, 1 Anadarko Petroleum Corporation, 3 BP P L C.
3. What are the main segments of the Gulf of Mexico Oil & Gas Decommissioning Market?
The market segments include Water Depth.
4. Can you provide details about the market size?
The market size is estimated to be USD 11.1 billion as of 2022.
5. What are some drivers contributing to market growth?
N/A
6. What are the notable trends driving market growth?
Deepwater to Register Highest Growth Rate.
7. Are there any restraints impacting market growth?
N/A
8. Can you provide examples of recent developments in the market?
N/A
9. What pricing options are available for accessing the report?
Pricing options include single-user, multi-user, and enterprise licenses priced at USD 3800, USD 4500, and USD 5800 respectively.
10. Is the market size provided in terms of value or volume?
The market size is provided in terms of value, measured in billion.
11. Are there any specific market keywords associated with the report?
Yes, the market keyword associated with the report is "Gulf of Mexico Oil & Gas Decommissioning Market," which aids in identifying and referencing the specific market segment covered.
12. How do I determine which pricing option suits my needs best?
The pricing options vary based on user requirements and access needs. Individual users may opt for single-user licenses, while businesses requiring broader access may choose multi-user or enterprise licenses for cost-effective access to the report.
13. Are there any additional resources or data provided in the Gulf of Mexico Oil & Gas Decommissioning Market report?
While the report offers comprehensive insights, it's advisable to review the specific contents or supplementary materials provided to ascertain if additional resources or data are available.
14. How can I stay updated on further developments or reports in the Gulf of Mexico Oil & Gas Decommissioning Market?
To stay informed about further developments, trends, and reports in the Gulf of Mexico Oil & Gas Decommissioning Market, consider subscribing to industry newsletters, following relevant companies and organizations, or regularly checking reputable industry news sources and publications.
Methodology
Step 1 - Identification of Relevant Samples Size from Population Database


Step 2 - Approaches for Defining Global Market Size (Value, Volume* & Price*)

Note*: In applicable scenarios
Step 3 - Data Sources
Primary Research
- Web Analytics
- Survey Reports
- Research Institute
- Latest Research Reports
- Opinion Leaders
Secondary Research
- Annual Reports
- White Paper
- Latest Press Release
- Industry Association
- Paid Database
- Investor Presentations

Step 4 - Data Triangulation
Involves using different sources of information in order to increase the validity of a study
These sources are likely to be stakeholders in a program - participants, other researchers, program staff, other community members, and so on.
Then we put all data in single framework & apply various statistical tools to find out the dynamic on the market.
During the analysis stage, feedback from the stakeholder groups would be compared to determine areas of agreement as well as areas of divergence