


Key Insights
The global heat-resistant glass water cup market is projected for substantial growth, driven by escalating consumer preference for durable, safe, and aesthetically appealing drinkware. Increased adoption of healthy lifestyles and elevated water consumption are primary growth catalysts. Consumers are increasingly opting for sustainable, reusable alternatives over single-use plastics, significantly contributing to market expansion. Innovations in glass manufacturing have yielded enhanced durability and heat resistance, boosting product desirability. The market is segmented by capacity, design, and distribution channels, with online sales channels demonstrating increasing influence. Leading brands like Libbey, LOCK&LOCK, Glasslock, and Thermos are instrumental in market development through product innovation and strategic marketing. Despite potential challenges from fluctuating raw material costs and competition from materials such as stainless steel and plastic, the market outlook remains robust, supported by enduring consumer demand for eco-friendly and health-conscious products. We forecast a compound annual growth rate (CAGR) of 5.9% over the next decade, anticipating continuous expansion and diversification across market segments. The market size is estimated at $8.2 billion in the base year 2024.
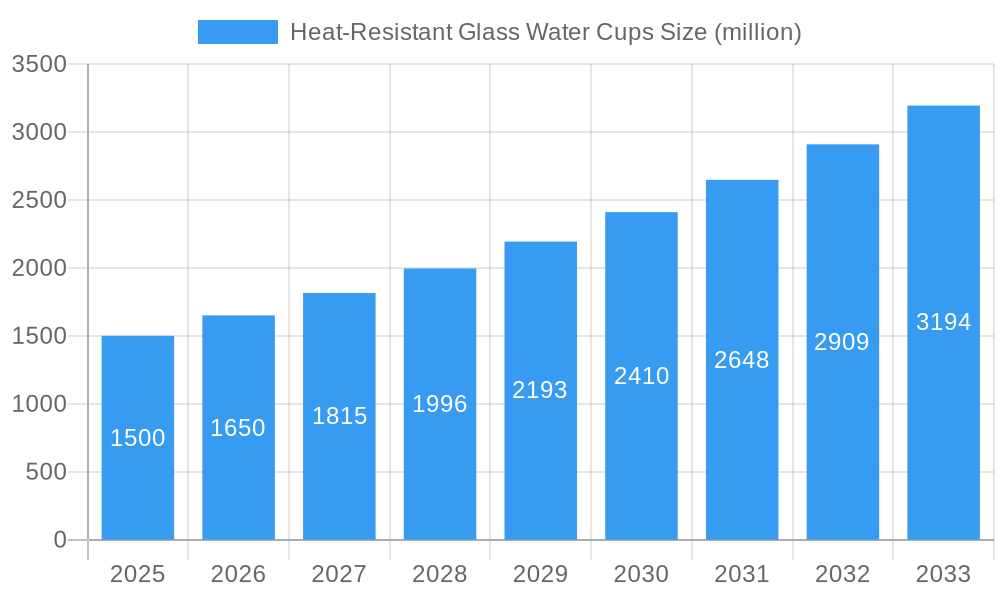
Heat-Resistant Glass Water Cups Market Size (In Billion)

The competitive arena features a mix of established global entities and regional manufacturers. Prominent brands capitalize on strong brand equity and extensive distribution networks, while regional players offer cost-effective solutions. Key market participants prioritize innovation to meet evolving consumer needs, including novel designs, varied sizes, and enhanced functionalities. Future expansion will be shaped by consumer demand for sustainable products, advancements in manufacturing technologies, and shifts in the retail environment. Strategic collaborations, mergers, acquisitions, and product portfolio diversification are expected to significantly influence market dynamics. Regional consumption patterns vary, with developed economies exhibiting higher per capita usage than developing economies. However, developing economies represent significant growth potential due to rising disposable incomes and evolving consumer preferences.
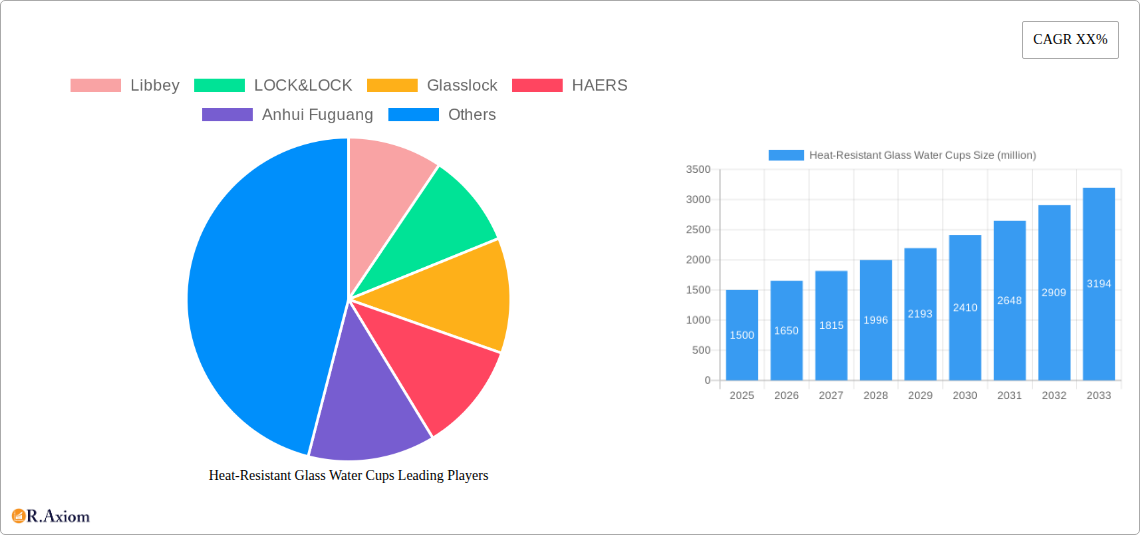
Heat-Resistant Glass Water Cups Company Market Share
Heat-Resistant Glass Water Cups Market Report: 2019-2033
This comprehensive report provides an in-depth analysis of the global heat-resistant glass water cups market, offering invaluable insights for industry stakeholders, investors, and businesses seeking to navigate this dynamic sector. The report covers the period 2019-2033, with a focus on the forecast period 2025-2033 and a base year of 2025. The study analyzes market size, growth drivers, competitive landscape, technological advancements, and emerging trends, providing actionable recommendations for strategic decision-making. The market value is projected to reach several million USD by 2033.
Heat-Resistant Glass Water Cups Market Concentration & Innovation
The heat-resistant glass water cups market exhibits a moderately concentrated landscape, with key players like Libbey, LOCK&LOCK, and Glasslock holding significant market share. However, the presence of several regional and smaller players fosters competition. Innovation is driven by consumer demand for durable, aesthetically pleasing, and functional products. This includes the development of borosilicate glass cups with enhanced thermal shock resistance, improved designs for ergonomic handling, and eco-friendly manufacturing processes. Regulatory frameworks related to food safety and material standards influence product development. The market witnesses increasing adoption of reusable, sustainable alternatives to disposable cups, further fueling innovation. M&A activities have been relatively modest in recent years, with deal values totaling approximately $XX million (estimated) during the historical period.
- Market Share (Estimated 2025): Libbey (15%), LOCK&LOCK (12%), Glasslock (10%), Others (63%)
- M&A Activity (2019-2024): Approximately $XX million in total deal value.
Heat-Resistant Glass Water Cups Industry Trends & Insights
The global heat-resistant glass water cups market is experiencing robust growth, driven by rising consumer preference for healthy and sustainable lifestyle choices. The increasing demand for reusable alternatives to disposable plastic cups is a key catalyst. Technological advancements in glass manufacturing have led to the production of lighter, stronger, and more aesthetically pleasing cups. The Compound Annual Growth Rate (CAGR) is projected to be xx% during the forecast period (2025-2033). Market penetration is high in developed economies but shows significant growth potential in emerging markets. Competitive dynamics are characterized by price competition, product differentiation through design and functionality, and brand building. Consumer preferences are shifting towards eco-friendly products made from sustainable materials and featuring innovative designs.
Dominant Markets & Segments in Heat-Resistant Glass Water Cups
The North American region currently holds the largest market share for heat-resistant glass water cups, driven by high consumer disposable income, preference for convenient and stylish products, and a strong environmental consciousness. Within North America, the United States represents the leading national market.
- Key Drivers in North America:
- High disposable income
- Strong focus on healthy lifestyle trends
- Growing awareness of environmental sustainability
- Well-established retail infrastructure
The dominance of North America is attributed to several factors, including a well-established retail infrastructure, strong consumer purchasing power, and high awareness of environmental concerns. The increasing popularity of health and wellness lifestyles is also a significant contributor to market growth in this region. However, other regions, particularly in Asia and Europe, are expected to exhibit substantial growth during the forecast period due to rising disposable incomes and changing consumer preferences.
Heat-Resistant Glass Water Cups Product Developments
Recent product innovations focus on enhanced durability, improved thermal shock resistance, and aesthetically pleasing designs. Many manufacturers are incorporating features like ergonomic handles, leak-proof lids, and various sizes to cater to diverse consumer needs. The use of borosilicate glass, known for its superior heat resistance, is becoming increasingly prevalent. These developments are enhancing the market appeal of heat-resistant glass water cups, leading to improved market fit and competitive advantage.
Report Scope & Segmentation Analysis
This report segments the heat-resistant glass water cups market by material type (borosilicate glass, tempered glass), capacity (under 250ml, 250-500ml, above 500ml), distribution channel (online, offline), and region (North America, Europe, Asia-Pacific, Rest of World). Each segment displays unique growth projections, market sizes, and competitive dynamics. For instance, the borosilicate glass segment is experiencing faster growth due to its superior heat resistance.
Key Drivers of Heat-Resistant Glass Water Cups Growth
Several factors fuel the growth of the heat-resistant glass water cups market: rising consumer preference for healthier lifestyles, increasing demand for reusable and sustainable alternatives to single-use plastic cups, technological advancements in glass manufacturing leading to enhanced product features, and favorable government regulations promoting sustainable practices. Moreover, the growing emphasis on eco-friendly products and the increasing awareness of environmental protection are bolstering market growth.
Challenges in the Heat-Resistant Glass Water Cups Sector
The market faces challenges including fluctuating raw material prices, intense competition from alternative materials like plastic and stainless steel, and concerns about potential breakage. Supply chain disruptions can also affect production and distribution. Furthermore, regulations surrounding food safety and material standards present compliance hurdles for manufacturers. These factors can impact profit margins and overall market growth.
Emerging Opportunities in Heat-Resistant Glass Water Cups
Emerging opportunities lie in developing innovative designs, incorporating smart features, exploring new materials for enhanced durability and aesthetics, and expanding into untapped markets. Growth prospects exist in regions with rising disposable incomes and growing awareness of environmental issues. Opportunities also exist in developing customized products for niche markets such as sports enthusiasts, travelers, or office workers.
Key Developments in Heat-Resistant Glass Water Cups Industry
- 2022 Q3: Libbey launched a new line of eco-friendly heat-resistant glass water cups.
- 2023 Q1: LOCK&LOCK introduced a smart water cup with temperature monitoring capabilities.
- 2024 Q2: A strategic partnership between Glasslock and a sustainable packaging company was announced. (Further developments to be added upon data availability)
Strategic Outlook for Heat-Resistant Glass Water Cups Market
The future of the heat-resistant glass water cups market looks promising, driven by continued growth in consumer demand for sustainable and aesthetically pleasing products. Innovation in design, materials, and functionality will further drive market expansion. Focusing on emerging markets and developing products tailored to specific consumer segments will create new growth opportunities for market players. The market is poised for sustained growth, fueled by increasing consumer awareness and a shift towards eco-conscious choices.
Heat-Resistant Glass Water Cups Segmentation
-
1. Application
- 1.1. Household
- 1.2. Commercial
-
2. Types
- 2.1. Double Layers Glass Cup
- 2.2. Single Layer Glass Cup
Heat-Resistant Glass Water Cups Segmentation By Geography
-
1. North America
- 1.1. United States
- 1.2. Canada
- 1.3. Mexico
-
2. South America
- 2.1. Brazil
- 2.2. Argentina
- 2.3. Rest of South America
-
3. Europe
- 3.1. United Kingdom
- 3.2. Germany
- 3.3. France
- 3.4. Italy
- 3.5. Spain
- 3.6. Russia
- 3.7. Benelux
- 3.8. Nordics
- 3.9. Rest of Europe
-
4. Middle East & Africa
- 4.1. Turkey
- 4.2. Israel
- 4.3. GCC
- 4.4. North Africa
- 4.5. South Africa
- 4.6. Rest of Middle East & Africa
-
5. Asia Pacific
- 5.1. China
- 5.2. India
- 5.3. Japan
- 5.4. South Korea
- 5.5. ASEAN
- 5.6. Oceania
- 5.7. Rest of Asia Pacific
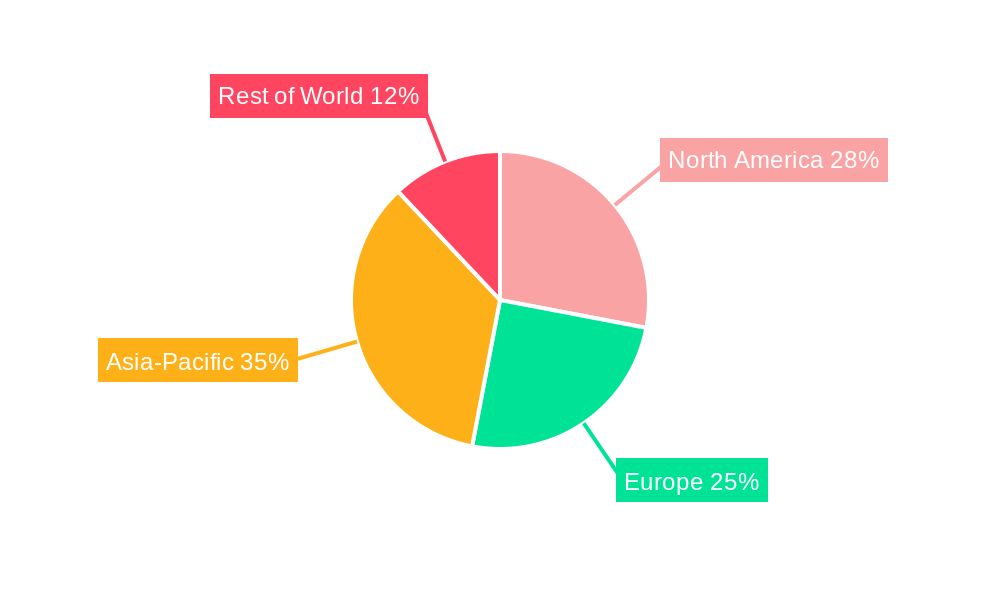
Heat-Resistant Glass Water Cups Regional Market Share
Geographic Coverage of Heat-Resistant Glass Water Cups
Heat-Resistant Glass Water Cups REPORT HIGHLIGHTS
| Aspects | Details |
|---|---|
| Study Period | 2020-2034 |
| Base Year | 2025 |
| Estimated Year | 2026 |
| Forecast Period | 2026-2034 |
| Historical Period | 2020-2025 |
| Growth Rate | CAGR of 5.9% from 2020-2034 |
| Segmentation |
|
Table of Contents
- 1. Introduction
- 1.1. Research Scope
- 1.2. Market Segmentation
- 1.3. Research Methodology
- 1.4. Definitions and Assumptions
- 2. Executive Summary
- 2.1. Introduction
- 3. Market Dynamics
- 3.1. Introduction
- 3.2. Market Drivers
- 3.3. Market Restrains
- 3.4. Market Trends
- 4. Market Factor Analysis
- 4.1. Porters Five Forces
- 4.2. Supply/Value Chain
- 4.3. PESTEL analysis
- 4.4. Market Entropy
- 4.5. Patent/Trademark Analysis
- 5. Global Heat-Resistant Glass Water Cups Analysis, Insights and Forecast, 2020-2032
- 5.1. Market Analysis, Insights and Forecast - by Application
- 5.1.1. Household
- 5.1.2. Commercial
- 5.2. Market Analysis, Insights and Forecast - by Types
- 5.2.1. Double Layers Glass Cup
- 5.2.2. Single Layer Glass Cup
- 5.3. Market Analysis, Insights and Forecast - by Region
- 5.3.1. North America
- 5.3.2. South America
- 5.3.3. Europe
- 5.3.4. Middle East & Africa
- 5.3.5. Asia Pacific
- 5.1. Market Analysis, Insights and Forecast - by Application
- 6. North America Heat-Resistant Glass Water Cups Analysis, Insights and Forecast, 2020-2032
- 6.1. Market Analysis, Insights and Forecast - by Application
- 6.1.1. Household
- 6.1.2. Commercial
- 6.2. Market Analysis, Insights and Forecast - by Types
- 6.2.1. Double Layers Glass Cup
- 6.2.2. Single Layer Glass Cup
- 6.1. Market Analysis, Insights and Forecast - by Application
- 7. South America Heat-Resistant Glass Water Cups Analysis, Insights and Forecast, 2020-2032
- 7.1. Market Analysis, Insights and Forecast - by Application
- 7.1.1. Household
- 7.1.2. Commercial
- 7.2. Market Analysis, Insights and Forecast - by Types
- 7.2.1. Double Layers Glass Cup
- 7.2.2. Single Layer Glass Cup
- 7.1. Market Analysis, Insights and Forecast - by Application
- 8. Europe Heat-Resistant Glass Water Cups Analysis, Insights and Forecast, 2020-2032
- 8.1. Market Analysis, Insights and Forecast - by Application
- 8.1.1. Household
- 8.1.2. Commercial
- 8.2. Market Analysis, Insights and Forecast - by Types
- 8.2.1. Double Layers Glass Cup
- 8.2.2. Single Layer Glass Cup
- 8.1. Market Analysis, Insights and Forecast - by Application
- 9. Middle East & Africa Heat-Resistant Glass Water Cups Analysis, Insights and Forecast, 2020-2032
- 9.1. Market Analysis, Insights and Forecast - by Application
- 9.1.1. Household
- 9.1.2. Commercial
- 9.2. Market Analysis, Insights and Forecast - by Types
- 9.2.1. Double Layers Glass Cup
- 9.2.2. Single Layer Glass Cup
- 9.1. Market Analysis, Insights and Forecast - by Application
- 10. Asia Pacific Heat-Resistant Glass Water Cups Analysis, Insights and Forecast, 2020-2032
- 10.1. Market Analysis, Insights and Forecast - by Application
- 10.1.1. Household
- 10.1.2. Commercial
- 10.2. Market Analysis, Insights and Forecast - by Types
- 10.2.1. Double Layers Glass Cup
- 10.2.2. Single Layer Glass Cup
- 10.1. Market Analysis, Insights and Forecast - by Application
- 11. Competitive Analysis
- 11.1. Global Market Share Analysis 2025
- 11.2. Company Profiles
- 11.2.1 Libbey
- 11.2.1.1. Overview
- 11.2.1.2. Products
- 11.2.1.3. SWOT Analysis
- 11.2.1.4. Recent Developments
- 11.2.1.5. Financials (Based on Availability)
- 11.2.2 LOCK&LOCK
- 11.2.2.1. Overview
- 11.2.2.2. Products
- 11.2.2.3. SWOT Analysis
- 11.2.2.4. Recent Developments
- 11.2.2.5. Financials (Based on Availability)
- 11.2.3 Glasslock
- 11.2.3.1. Overview
- 11.2.3.2. Products
- 11.2.3.3. SWOT Analysis
- 11.2.3.4. Recent Developments
- 11.2.3.5. Financials (Based on Availability)
- 11.2.4 HAERS
- 11.2.4.1. Overview
- 11.2.4.2. Products
- 11.2.4.3. SWOT Analysis
- 11.2.4.4. Recent Developments
- 11.2.4.5. Financials (Based on Availability)
- 11.2.5 Anhui Fuguang
- 11.2.5.1. Overview
- 11.2.5.2. Products
- 11.2.5.3. SWOT Analysis
- 11.2.5.4. Recent Developments
- 11.2.5.5. Financials (Based on Availability)
- 11.2.6 Dahua Glassware
- 11.2.6.1. Overview
- 11.2.6.2. Products
- 11.2.6.3. SWOT Analysis
- 11.2.6.4. Recent Developments
- 11.2.6.5. Financials (Based on Availability)
- 11.2.7 SUPOR
- 11.2.7.1. Overview
- 11.2.7.2. Products
- 11.2.7.3. SWOT Analysis
- 11.2.7.4. Recent Developments
- 11.2.7.5. Financials (Based on Availability)
- 11.2.8 HEENOOR
- 11.2.8.1. Overview
- 11.2.8.2. Products
- 11.2.8.3. SWOT Analysis
- 11.2.8.4. Recent Developments
- 11.2.8.5. Financials (Based on Availability)
- 11.2.9 THERMOS
- 11.2.9.1. Overview
- 11.2.9.2. Products
- 11.2.9.3. SWOT Analysis
- 11.2.9.4. Recent Developments
- 11.2.9.5. Financials (Based on Availability)
- 11.2.10 TOMIC
- 11.2.10.1. Overview
- 11.2.10.2. Products
- 11.2.10.3. SWOT Analysis
- 11.2.10.4. Recent Developments
- 11.2.10.5. Financials (Based on Availability)
- 11.2.1 Libbey
List of Figures
- Figure 1: Global Heat-Resistant Glass Water Cups Revenue Breakdown (billion, %) by Region 2025 & 2033
- Figure 2: Global Heat-Resistant Glass Water Cups Volume Breakdown (K, %) by Region 2025 & 2033
- Figure 3: North America Heat-Resistant Glass Water Cups Revenue (billion), by Application 2025 & 2033
- Figure 4: North America Heat-Resistant Glass Water Cups Volume (K), by Application 2025 & 2033
- Figure 5: North America Heat-Resistant Glass Water Cups Revenue Share (%), by Application 2025 & 2033
- Figure 6: North America Heat-Resistant Glass Water Cups Volume Share (%), by Application 2025 & 2033
- Figure 7: North America Heat-Resistant Glass Water Cups Revenue (billion), by Types 2025 & 2033
- Figure 8: North America Heat-Resistant Glass Water Cups Volume (K), by Types 2025 & 2033
- Figure 9: North America Heat-Resistant Glass Water Cups Revenue Share (%), by Types 2025 & 2033
- Figure 10: North America Heat-Resistant Glass Water Cups Volume Share (%), by Types 2025 & 2033
- Figure 11: North America Heat-Resistant Glass Water Cups Revenue (billion), by Country 2025 & 2033
- Figure 12: North America Heat-Resistant Glass Water Cups Volume (K), by Country 2025 & 2033
- Figure 13: North America Heat-Resistant Glass Water Cups Revenue Share (%), by Country 2025 & 2033
- Figure 14: North America Heat-Resistant Glass Water Cups Volume Share (%), by Country 2025 & 2033
- Figure 15: South America Heat-Resistant Glass Water Cups Revenue (billion), by Application 2025 & 2033
- Figure 16: South America Heat-Resistant Glass Water Cups Volume (K), by Application 2025 & 2033
- Figure 17: South America Heat-Resistant Glass Water Cups Revenue Share (%), by Application 2025 & 2033
- Figure 18: South America Heat-Resistant Glass Water Cups Volume Share (%), by Application 2025 & 2033
- Figure 19: South America Heat-Resistant Glass Water Cups Revenue (billion), by Types 2025 & 2033
- Figure 20: South America Heat-Resistant Glass Water Cups Volume (K), by Types 2025 & 2033
- Figure 21: South America Heat-Resistant Glass Water Cups Revenue Share (%), by Types 2025 & 2033
- Figure 22: South America Heat-Resistant Glass Water Cups Volume Share (%), by Types 2025 & 2033
- Figure 23: South America Heat-Resistant Glass Water Cups Revenue (billion), by Country 2025 & 2033
- Figure 24: South America Heat-Resistant Glass Water Cups Volume (K), by Country 2025 & 2033
- Figure 25: South America Heat-Resistant Glass Water Cups Revenue Share (%), by Country 2025 & 2033
- Figure 26: South America Heat-Resistant Glass Water Cups Volume Share (%), by Country 2025 & 2033
- Figure 27: Europe Heat-Resistant Glass Water Cups Revenue (billion), by Application 2025 & 2033
- Figure 28: Europe Heat-Resistant Glass Water Cups Volume (K), by Application 2025 & 2033
- Figure 29: Europe Heat-Resistant Glass Water Cups Revenue Share (%), by Application 2025 & 2033
- Figure 30: Europe Heat-Resistant Glass Water Cups Volume Share (%), by Application 2025 & 2033
- Figure 31: Europe Heat-Resistant Glass Water Cups Revenue (billion), by Types 2025 & 2033
- Figure 32: Europe Heat-Resistant Glass Water Cups Volume (K), by Types 2025 & 2033
- Figure 33: Europe Heat-Resistant Glass Water Cups Revenue Share (%), by Types 2025 & 2033
- Figure 34: Europe Heat-Resistant Glass Water Cups Volume Share (%), by Types 2025 & 2033
- Figure 35: Europe Heat-Resistant Glass Water Cups Revenue (billion), by Country 2025 & 2033
- Figure 36: Europe Heat-Resistant Glass Water Cups Volume (K), by Country 2025 & 2033
- Figure 37: Europe Heat-Resistant Glass Water Cups Revenue Share (%), by Country 2025 & 2033
- Figure 38: Europe Heat-Resistant Glass Water Cups Volume Share (%), by Country 2025 & 2033
- Figure 39: Middle East & Africa Heat-Resistant Glass Water Cups Revenue (billion), by Application 2025 & 2033
- Figure 40: Middle East & Africa Heat-Resistant Glass Water Cups Volume (K), by Application 2025 & 2033
- Figure 41: Middle East & Africa Heat-Resistant Glass Water Cups Revenue Share (%), by Application 2025 & 2033
- Figure 42: Middle East & Africa Heat-Resistant Glass Water Cups Volume Share (%), by Application 2025 & 2033
- Figure 43: Middle East & Africa Heat-Resistant Glass Water Cups Revenue (billion), by Types 2025 & 2033
- Figure 44: Middle East & Africa Heat-Resistant Glass Water Cups Volume (K), by Types 2025 & 2033
- Figure 45: Middle East & Africa Heat-Resistant Glass Water Cups Revenue Share (%), by Types 2025 & 2033
- Figure 46: Middle East & Africa Heat-Resistant Glass Water Cups Volume Share (%), by Types 2025 & 2033
- Figure 47: Middle East & Africa Heat-Resistant Glass Water Cups Revenue (billion), by Country 2025 & 2033
- Figure 48: Middle East & Africa Heat-Resistant Glass Water Cups Volume (K), by Country 2025 & 2033
- Figure 49: Middle East & Africa Heat-Resistant Glass Water Cups Revenue Share (%), by Country 2025 & 2033
- Figure 50: Middle East & Africa Heat-Resistant Glass Water Cups Volume Share (%), by Country 2025 & 2033
- Figure 51: Asia Pacific Heat-Resistant Glass Water Cups Revenue (billion), by Application 2025 & 2033
- Figure 52: Asia Pacific Heat-Resistant Glass Water Cups Volume (K), by Application 2025 & 2033
- Figure 53: Asia Pacific Heat-Resistant Glass Water Cups Revenue Share (%), by Application 2025 & 2033
- Figure 54: Asia Pacific Heat-Resistant Glass Water Cups Volume Share (%), by Application 2025 & 2033
- Figure 55: Asia Pacific Heat-Resistant Glass Water Cups Revenue (billion), by Types 2025 & 2033
- Figure 56: Asia Pacific Heat-Resistant Glass Water Cups Volume (K), by Types 2025 & 2033
- Figure 57: Asia Pacific Heat-Resistant Glass Water Cups Revenue Share (%), by Types 2025 & 2033
- Figure 58: Asia Pacific Heat-Resistant Glass Water Cups Volume Share (%), by Types 2025 & 2033
- Figure 59: Asia Pacific Heat-Resistant Glass Water Cups Revenue (billion), by Country 2025 & 2033
- Figure 60: Asia Pacific Heat-Resistant Glass Water Cups Volume (K), by Country 2025 & 2033
- Figure 61: Asia Pacific Heat-Resistant Glass Water Cups Revenue Share (%), by Country 2025 & 2033
- Figure 62: Asia Pacific Heat-Resistant Glass Water Cups Volume Share (%), by Country 2025 & 2033
List of Tables
- Table 1: Global Heat-Resistant Glass Water Cups Revenue billion Forecast, by Application 2020 & 2033
- Table 2: Global Heat-Resistant Glass Water Cups Volume K Forecast, by Application 2020 & 2033
- Table 3: Global Heat-Resistant Glass Water Cups Revenue billion Forecast, by Types 2020 & 2033
- Table 4: Global Heat-Resistant Glass Water Cups Volume K Forecast, by Types 2020 & 2033
- Table 5: Global Heat-Resistant Glass Water Cups Revenue billion Forecast, by Region 2020 & 2033
- Table 6: Global Heat-Resistant Glass Water Cups Volume K Forecast, by Region 2020 & 2033
- Table 7: Global Heat-Resistant Glass Water Cups Revenue billion Forecast, by Application 2020 & 2033
- Table 8: Global Heat-Resistant Glass Water Cups Volume K Forecast, by Application 2020 & 2033
- Table 9: Global Heat-Resistant Glass Water Cups Revenue billion Forecast, by Types 2020 & 2033
- Table 10: Global Heat-Resistant Glass Water Cups Volume K Forecast, by Types 2020 & 2033
- Table 11: Global Heat-Resistant Glass Water Cups Revenue billion Forecast, by Country 2020 & 2033
- Table 12: Global Heat-Resistant Glass Water Cups Volume K Forecast, by Country 2020 & 2033
- Table 13: United States Heat-Resistant Glass Water Cups Revenue (billion) Forecast, by Application 2020 & 2033
- Table 14: United States Heat-Resistant Glass Water Cups Volume (K) Forecast, by Application 2020 & 2033
- Table 15: Canada Heat-Resistant Glass Water Cups Revenue (billion) Forecast, by Application 2020 & 2033
- Table 16: Canada Heat-Resistant Glass Water Cups Volume (K) Forecast, by Application 2020 & 2033
- Table 17: Mexico Heat-Resistant Glass Water Cups Revenue (billion) Forecast, by Application 2020 & 2033
- Table 18: Mexico Heat-Resistant Glass Water Cups Volume (K) Forecast, by Application 2020 & 2033
- Table 19: Global Heat-Resistant Glass Water Cups Revenue billion Forecast, by Application 2020 & 2033
- Table 20: Global Heat-Resistant Glass Water Cups Volume K Forecast, by Application 2020 & 2033
- Table 21: Global Heat-Resistant Glass Water Cups Revenue billion Forecast, by Types 2020 & 2033
- Table 22: Global Heat-Resistant Glass Water Cups Volume K Forecast, by Types 2020 & 2033
- Table 23: Global Heat-Resistant Glass Water Cups Revenue billion Forecast, by Country 2020 & 2033
- Table 24: Global Heat-Resistant Glass Water Cups Volume K Forecast, by Country 2020 & 2033
- Table 25: Brazil Heat-Resistant Glass Water Cups Revenue (billion) Forecast, by Application 2020 & 2033
- Table 26: Brazil Heat-Resistant Glass Water Cups Volume (K) Forecast, by Application 2020 & 2033
- Table 27: Argentina Heat-Resistant Glass Water Cups Revenue (billion) Forecast, by Application 2020 & 2033
- Table 28: Argentina Heat-Resistant Glass Water Cups Volume (K) Forecast, by Application 2020 & 2033
- Table 29: Rest of South America Heat-Resistant Glass Water Cups Revenue (billion) Forecast, by Application 2020 & 2033
- Table 30: Rest of South America Heat-Resistant Glass Water Cups Volume (K) Forecast, by Application 2020 & 2033
- Table 31: Global Heat-Resistant Glass Water Cups Revenue billion Forecast, by Application 2020 & 2033
- Table 32: Global Heat-Resistant Glass Water Cups Volume K Forecast, by Application 2020 & 2033
- Table 33: Global Heat-Resistant Glass Water Cups Revenue billion Forecast, by Types 2020 & 2033
- Table 34: Global Heat-Resistant Glass Water Cups Volume K Forecast, by Types 2020 & 2033
- Table 35: Global Heat-Resistant Glass Water Cups Revenue billion Forecast, by Country 2020 & 2033
- Table 36: Global Heat-Resistant Glass Water Cups Volume K Forecast, by Country 2020 & 2033
- Table 37: United Kingdom Heat-Resistant Glass Water Cups Revenue (billion) Forecast, by Application 2020 & 2033
- Table 38: United Kingdom Heat-Resistant Glass Water Cups Volume (K) Forecast, by Application 2020 & 2033
- Table 39: Germany Heat-Resistant Glass Water Cups Revenue (billion) Forecast, by Application 2020 & 2033
- Table 40: Germany Heat-Resistant Glass Water Cups Volume (K) Forecast, by Application 2020 & 2033
- Table 41: France Heat-Resistant Glass Water Cups Revenue (billion) Forecast, by Application 2020 & 2033
- Table 42: France Heat-Resistant Glass Water Cups Volume (K) Forecast, by Application 2020 & 2033
- Table 43: Italy Heat-Resistant Glass Water Cups Revenue (billion) Forecast, by Application 2020 & 2033
- Table 44: Italy Heat-Resistant Glass Water Cups Volume (K) Forecast, by Application 2020 & 2033
- Table 45: Spain Heat-Resistant Glass Water Cups Revenue (billion) Forecast, by Application 2020 & 2033
- Table 46: Spain Heat-Resistant Glass Water Cups Volume (K) Forecast, by Application 2020 & 2033
- Table 47: Russia Heat-Resistant Glass Water Cups Revenue (billion) Forecast, by Application 2020 & 2033
- Table 48: Russia Heat-Resistant Glass Water Cups Volume (K) Forecast, by Application 2020 & 2033
- Table 49: Benelux Heat-Resistant Glass Water Cups Revenue (billion) Forecast, by Application 2020 & 2033
- Table 50: Benelux Heat-Resistant Glass Water Cups Volume (K) Forecast, by Application 2020 & 2033
- Table 51: Nordics Heat-Resistant Glass Water Cups Revenue (billion) Forecast, by Application 2020 & 2033
- Table 52: Nordics Heat-Resistant Glass Water Cups Volume (K) Forecast, by Application 2020 & 2033
- Table 53: Rest of Europe Heat-Resistant Glass Water Cups Revenue (billion) Forecast, by Application 2020 & 2033
- Table 54: Rest of Europe Heat-Resistant Glass Water Cups Volume (K) Forecast, by Application 2020 & 2033
- Table 55: Global Heat-Resistant Glass Water Cups Revenue billion Forecast, by Application 2020 & 2033
- Table 56: Global Heat-Resistant Glass Water Cups Volume K Forecast, by Application 2020 & 2033
- Table 57: Global Heat-Resistant Glass Water Cups Revenue billion Forecast, by Types 2020 & 2033
- Table 58: Global Heat-Resistant Glass Water Cups Volume K Forecast, by Types 2020 & 2033
- Table 59: Global Heat-Resistant Glass Water Cups Revenue billion Forecast, by Country 2020 & 2033
- Table 60: Global Heat-Resistant Glass Water Cups Volume K Forecast, by Country 2020 & 2033
- Table 61: Turkey Heat-Resistant Glass Water Cups Revenue (billion) Forecast, by Application 2020 & 2033
- Table 62: Turkey Heat-Resistant Glass Water Cups Volume (K) Forecast, by Application 2020 & 2033
- Table 63: Israel Heat-Resistant Glass Water Cups Revenue (billion) Forecast, by Application 2020 & 2033
- Table 64: Israel Heat-Resistant Glass Water Cups Volume (K) Forecast, by Application 2020 & 2033
- Table 65: GCC Heat-Resistant Glass Water Cups Revenue (billion) Forecast, by Application 2020 & 2033
- Table 66: GCC Heat-Resistant Glass Water Cups Volume (K) Forecast, by Application 2020 & 2033
- Table 67: North Africa Heat-Resistant Glass Water Cups Revenue (billion) Forecast, by Application 2020 & 2033
- Table 68: North Africa Heat-Resistant Glass Water Cups Volume (K) Forecast, by Application 2020 & 2033
- Table 69: South Africa Heat-Resistant Glass Water Cups Revenue (billion) Forecast, by Application 2020 & 2033
- Table 70: South Africa Heat-Resistant Glass Water Cups Volume (K) Forecast, by Application 2020 & 2033
- Table 71: Rest of Middle East & Africa Heat-Resistant Glass Water Cups Revenue (billion) Forecast, by Application 2020 & 2033
- Table 72: Rest of Middle East & Africa Heat-Resistant Glass Water Cups Volume (K) Forecast, by Application 2020 & 2033
- Table 73: Global Heat-Resistant Glass Water Cups Revenue billion Forecast, by Application 2020 & 2033
- Table 74: Global Heat-Resistant Glass Water Cups Volume K Forecast, by Application 2020 & 2033
- Table 75: Global Heat-Resistant Glass Water Cups Revenue billion Forecast, by Types 2020 & 2033
- Table 76: Global Heat-Resistant Glass Water Cups Volume K Forecast, by Types 2020 & 2033
- Table 77: Global Heat-Resistant Glass Water Cups Revenue billion Forecast, by Country 2020 & 2033
- Table 78: Global Heat-Resistant Glass Water Cups Volume K Forecast, by Country 2020 & 2033
- Table 79: China Heat-Resistant Glass Water Cups Revenue (billion) Forecast, by Application 2020 & 2033
- Table 80: China Heat-Resistant Glass Water Cups Volume (K) Forecast, by Application 2020 & 2033
- Table 81: India Heat-Resistant Glass Water Cups Revenue (billion) Forecast, by Application 2020 & 2033
- Table 82: India Heat-Resistant Glass Water Cups Volume (K) Forecast, by Application 2020 & 2033
- Table 83: Japan Heat-Resistant Glass Water Cups Revenue (billion) Forecast, by Application 2020 & 2033
- Table 84: Japan Heat-Resistant Glass Water Cups Volume (K) Forecast, by Application 2020 & 2033
- Table 85: South Korea Heat-Resistant Glass Water Cups Revenue (billion) Forecast, by Application 2020 & 2033
- Table 86: South Korea Heat-Resistant Glass Water Cups Volume (K) Forecast, by Application 2020 & 2033
- Table 87: ASEAN Heat-Resistant Glass Water Cups Revenue (billion) Forecast, by Application 2020 & 2033
- Table 88: ASEAN Heat-Resistant Glass Water Cups Volume (K) Forecast, by Application 2020 & 2033
- Table 89: Oceania Heat-Resistant Glass Water Cups Revenue (billion) Forecast, by Application 2020 & 2033
- Table 90: Oceania Heat-Resistant Glass Water Cups Volume (K) Forecast, by Application 2020 & 2033
- Table 91: Rest of Asia Pacific Heat-Resistant Glass Water Cups Revenue (billion) Forecast, by Application 2020 & 2033
- Table 92: Rest of Asia Pacific Heat-Resistant Glass Water Cups Volume (K) Forecast, by Application 2020 & 2033
Frequently Asked Questions
1. What is the projected Compound Annual Growth Rate (CAGR) of the Heat-Resistant Glass Water Cups?
The projected CAGR is approximately 5.9%.
2. Which companies are prominent players in the Heat-Resistant Glass Water Cups?
Key companies in the market include Libbey, LOCK&LOCK, Glasslock, HAERS, Anhui Fuguang, Dahua Glassware, SUPOR, HEENOOR, THERMOS, TOMIC.
3. What are the main segments of the Heat-Resistant Glass Water Cups?
The market segments include Application, Types.
4. Can you provide details about the market size?
The market size is estimated to be USD 8.2 billion as of 2022.
5. What are some drivers contributing to market growth?
N/A
6. What are the notable trends driving market growth?
N/A
7. Are there any restraints impacting market growth?
N/A
8. Can you provide examples of recent developments in the market?
N/A
9. What pricing options are available for accessing the report?
Pricing options include single-user, multi-user, and enterprise licenses priced at USD 3350.00, USD 5025.00, and USD 6700.00 respectively.
10. Is the market size provided in terms of value or volume?
The market size is provided in terms of value, measured in billion and volume, measured in K.
11. Are there any specific market keywords associated with the report?
Yes, the market keyword associated with the report is "Heat-Resistant Glass Water Cups," which aids in identifying and referencing the specific market segment covered.
12. How do I determine which pricing option suits my needs best?
The pricing options vary based on user requirements and access needs. Individual users may opt for single-user licenses, while businesses requiring broader access may choose multi-user or enterprise licenses for cost-effective access to the report.
13. Are there any additional resources or data provided in the Heat-Resistant Glass Water Cups report?
While the report offers comprehensive insights, it's advisable to review the specific contents or supplementary materials provided to ascertain if additional resources or data are available.
14. How can I stay updated on further developments or reports in the Heat-Resistant Glass Water Cups?
To stay informed about further developments, trends, and reports in the Heat-Resistant Glass Water Cups, consider subscribing to industry newsletters, following relevant companies and organizations, or regularly checking reputable industry news sources and publications.
Methodology
Step 1 - Identification of Relevant Samples Size from Population Database


Step 2 - Approaches for Defining Global Market Size (Value, Volume* & Price*)

Note*: In applicable scenarios
Step 3 - Data Sources
Primary Research
- Web Analytics
- Survey Reports
- Research Institute
- Latest Research Reports
- Opinion Leaders
Secondary Research
- Annual Reports
- White Paper
- Latest Press Release
- Industry Association
- Paid Database
- Investor Presentations

Step 4 - Data Triangulation
Involves using different sources of information in order to increase the validity of a study
These sources are likely to be stakeholders in a program - participants, other researchers, program staff, other community members, and so on.
Then we put all data in single framework & apply various statistical tools to find out the dynamic on the market.
During the analysis stage, feedback from the stakeholder groups would be compared to determine areas of agreement as well as areas of divergence