
Key Insights
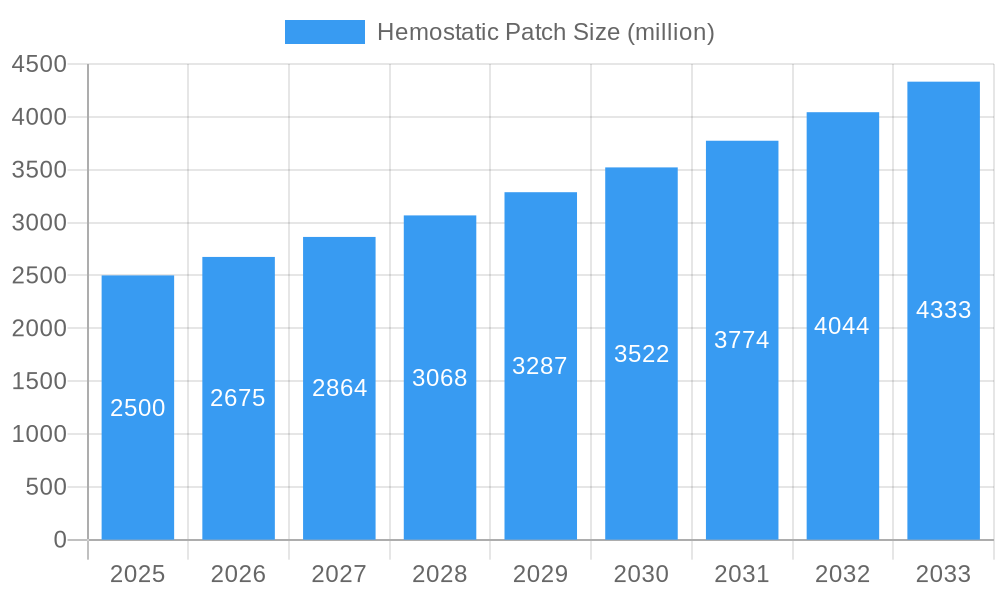
The hemostatic patch market is experiencing robust growth, driven by an increasing prevalence of trauma injuries, a rising number of surgical procedures, and the demand for effective, minimally invasive wound management solutions. The market's value is estimated to be around $2.5 billion in 2025, with a Compound Annual Growth Rate (CAGR) of approximately 7% projected through 2033. This growth is fueled by several key trends, including the development of advanced biomaterials that enhance hemostatic efficacy and reduce complications, the adoption of minimally invasive surgical techniques, and the rising demand for improved battlefield care solutions. Major players like Medtronic, Johnson & Johnson, and Baxter International are heavily invested in research and development, leading to continuous innovation in patch design, materials, and delivery systems. However, factors like high product costs and regulatory hurdles can restrain market expansion. Segment-wise, the market is likely segmented by material type (e.g., collagen, chitosan, cellulose), application (e.g., trauma care, surgical procedures), and end-user (e.g., hospitals, ambulances). Regional growth will likely be strongest in North America and Europe, driven by advanced healthcare infrastructure and higher adoption rates.
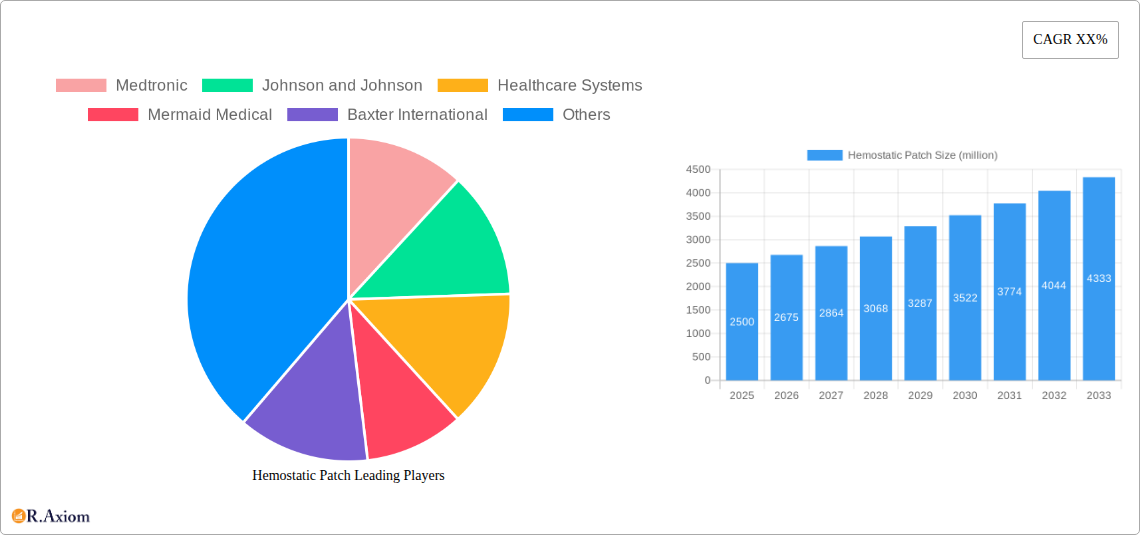
Hemostatic Patch Market Size (In Billion)

The competitive landscape is marked by both established players and emerging companies. Companies are focusing on strategic collaborations, mergers and acquisitions, and product diversification to gain a competitive edge. The next decade will likely see further consolidation within the market as companies seek to expand their product portfolios and geographic reach. Market growth will also be influenced by advancements in related technologies, such as tissue regeneration and advanced wound healing therapies. Continued innovation in hemostatic patch technology will be crucial for sustaining market expansion and improving patient outcomes. Focus areas include enhancing product efficacy, improving ease of use, and reducing side effects.
Hemostatic Patch Company Market Share
Hemostatic Patch Market Report: 2019-2033
This comprehensive report provides an in-depth analysis of the global hemostatic patch market, offering invaluable insights for industry stakeholders, investors, and researchers. Covering the period from 2019 to 2033, with a base year of 2025 and a forecast period of 2025-2033, this report meticulously examines market dynamics, competitive landscapes, and future growth potential. The market size is projected to reach xx million by 2033, showcasing significant growth opportunities.
Hemostatic Patch Market Concentration & Innovation
The global hemostatic patch market exhibits a moderately concentrated landscape, with key players like Medtronic, Johnson & Johnson, and Baxter International holding significant market share. However, the presence of several smaller, innovative companies, such as Mermaid Medical and Advamedica, indicates a dynamic competitive environment. The market share of the top three players is estimated at approximately xx%, while the remaining market is fragmented amongst numerous players.
- Innovation Drivers: Advancements in biomaterials, the development of minimally invasive surgical techniques, and the growing demand for effective hemostasis solutions are driving innovation within the hemostatic patch sector.
- Regulatory Frameworks: Stringent regulatory approvals and compliance requirements influence product development and market entry strategies.
- Product Substitutes: Traditional methods of hemostasis, such as sutures and cautery, pose competition, although hemostatic patches offer advantages in terms of ease of use and reduced surgical time.
- End-User Trends: Increasing preference for minimally invasive procedures and the rising incidence of trauma and surgical procedures are driving market growth.
- M&A Activities: The market has witnessed several mergers and acquisitions (M&A) in recent years, with deal values totaling an estimated xx million during the historical period. These activities aim to expand market reach and product portfolios.
Hemostatic Patch Industry Trends & Insights
The hemostatic patch market is experiencing robust growth, driven by factors such as the increasing prevalence of chronic diseases requiring surgical interventions, rising geriatric population, and technological advancements leading to the development of more effective and efficient hemostatic patches. The market is projected to witness a Compound Annual Growth Rate (CAGR) of xx% during the forecast period. Market penetration is currently at xx%, with significant potential for further growth in emerging markets.
Technological disruptions, such as the development of biocompatible and biodegradable materials, are transforming the market. Consumer preferences are shifting towards minimally invasive solutions with faster hemostasis capabilities and reduced post-operative complications. The competitive dynamics are characterized by intense rivalry amongst established players and emerging companies, leading to product diversification and strategic partnerships.
Dominant Markets & Segments in Hemostatic Patch
The North American region dominates the global hemostatic patch market, accounting for the largest market share due to factors such as high healthcare expenditure, advanced medical infrastructure, and increased adoption of minimally invasive surgical techniques.
- Key Drivers in North America:
- High prevalence of chronic diseases.
- Well-developed healthcare infrastructure.
- High healthcare expenditure and insurance coverage.
- Technological advancements and early adoption of innovative products.
- Stringent regulatory frameworks promoting product safety and efficacy.
Europe holds the second largest market share, driven by similar factors to North America, while the Asia-Pacific region shows significant growth potential due to increasing healthcare investment and rising surgical procedures. Further segmentation by product type (e.g., collagen-based, gelatin-based, chitosan-based), application (e.g., trauma, surgery), and end-user (e.g., hospitals, ambulatory surgical centers) reveals varied growth patterns and competitive dynamics within each segment. The collagen-based segment is projected to maintain the largest market share throughout the forecast period due to its high efficacy and wide acceptance amongst healthcare professionals.
Hemostatic Patch Product Developments
Recent product innovations focus on improving biocompatibility, enhancing hemostatic efficacy, and incorporating features that simplify application and reduce post-operative complications. Advancements in material science have led to the development of patches with superior absorbency and improved tissue integration. These innovations are enhancing market fit by catering to the growing demand for faster, safer, and more effective hemostasis solutions.
Report Scope & Segmentation Analysis
This report segments the hemostatic patch market based on product type (collagen, gelatin, chitosan, others), application (surgery, trauma care, dentistry), end-user (hospitals, ambulatory surgical centers, clinics), and geography (North America, Europe, Asia-Pacific, Middle East & Africa, South America). Each segment's market size, growth projections, and competitive dynamics are thoroughly analyzed, providing a comprehensive understanding of the market landscape. For example, the collagen-based segment is expected to witness significant growth due to its proven efficacy and versatility.
Key Drivers of Hemostatic Patch Growth
Several factors are fueling the growth of the hemostatic patch market, including technological advancements leading to improved product efficacy and ease of use, rising prevalence of chronic diseases and trauma requiring surgical interventions, and increasing healthcare expenditure globally. Favorable regulatory frameworks supporting the adoption of innovative hemostatic solutions further contribute to market expansion. For example, the development of bioabsorbable patches has reduced the need for secondary procedures, boosting market appeal.
Challenges in the Hemostatic Patch Sector
Despite significant growth potential, the hemostatic patch sector faces challenges, including stringent regulatory hurdles impacting product approvals and market entry, potential supply chain disruptions affecting raw material availability and manufacturing, and intense competition from established and emerging players. These factors can influence pricing strategies and market penetration rates. The impact of regulatory changes and supply chain fluctuations is estimated to be xx million annually on overall market growth.
Emerging Opportunities in Hemostatic Patch
Emerging trends indicate promising opportunities for growth in the hemostatic patch market. These include the development of advanced biomaterials with enhanced hemostatic properties, expansion into new applications like dental surgery and minimally invasive procedures, and penetration into emerging markets in Asia-Pacific and Latin America. Personalized medicine approaches and telehealth integration also present significant opportunities for market expansion and product differentiation.
Leading Players in the Hemostatic Patch Market
- Medtronic
- Johnson & Johnson
- Healthcare Systems
- Mermaid Medical
- Baxter International
- Advamedica
- QuikClot
- Tricol Biomedical
- Longmed Medical Technology Company
- 3M
- Yunnan Baiyao Group
- Zhende Medical
- Nanfang Medical
- Cofoe
Key Developments in Hemostatic Patch Industry
- 2022 Q3: Medtronic launched a new generation of hemostatic patch with enhanced biocompatibility.
- 2021 Q4: Johnson & Johnson acquired a smaller company specializing in biodegradable hemostatic patches, expanding its product portfolio.
- 2020 Q1: New regulatory guidelines for hemostatic patch approval were implemented in the EU.
- 2019 Q4: Significant investments in R&D by several companies resulted in the introduction of several innovative hemostatic patches. Further details on specific announcements are available within the full report.
Strategic Outlook for Hemostatic Patch Market
The hemostatic patch market is poised for sustained growth, driven by technological advancements, increasing demand for minimally invasive procedures, and the rising prevalence of conditions requiring hemostasis. Companies that focus on innovation, strategic partnerships, and expansion into emerging markets are expected to capture significant market share in the coming years. The market's future potential lies in developing advanced biomaterials, personalized medicine solutions, and cost-effective products to cater to diverse patient needs globally.
Hemostatic Patch Segmentation
-
1. Application
- 1.1. Hospital
- 1.2. Clinic
- 1.3. Other
-
2. Types
- 2.1. Waterproof Type
- 2.2. Normal Type
- 2.3. Other
Hemostatic Patch Segmentation By Geography
-
1. North America
- 1.1. United States
- 1.2. Canada
- 1.3. Mexico
-
2. South America
- 2.1. Brazil
- 2.2. Argentina
- 2.3. Rest of South America
-
3. Europe
- 3.1. United Kingdom
- 3.2. Germany
- 3.3. France
- 3.4. Italy
- 3.5. Spain
- 3.6. Russia
- 3.7. Benelux
- 3.8. Nordics
- 3.9. Rest of Europe
-
4. Middle East & Africa
- 4.1. Turkey
- 4.2. Israel
- 4.3. GCC
- 4.4. North Africa
- 4.5. South Africa
- 4.6. Rest of Middle East & Africa
-
5. Asia Pacific
- 5.1. China
- 5.2. India
- 5.3. Japan
- 5.4. South Korea
- 5.5. ASEAN
- 5.6. Oceania
- 5.7. Rest of Asia Pacific
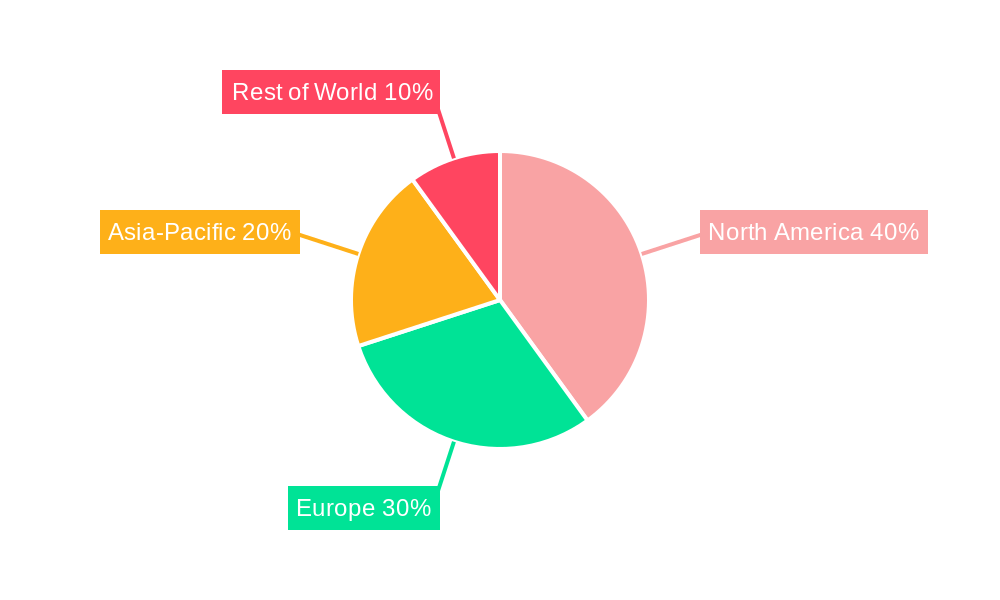
Hemostatic Patch Regional Market Share
Geographic Coverage of Hemostatic Patch
Hemostatic Patch REPORT HIGHLIGHTS
| Aspects | Details |
|---|---|
| Study Period | 2020-2034 |
| Base Year | 2025 |
| Estimated Year | 2026 |
| Forecast Period | 2026-2034 |
| Historical Period | 2020-2025 |
| Growth Rate | CAGR of 6.2% from 2020-2034 |
| Segmentation |
|
Table of Contents
- 1. Introduction
- 1.1. Research Scope
- 1.2. Market Segmentation
- 1.3. Research Methodology
- 1.4. Definitions and Assumptions
- 2. Executive Summary
- 2.1. Introduction
- 3. Market Dynamics
- 3.1. Introduction
- 3.2. Market Drivers
- 3.3. Market Restrains
- 3.4. Market Trends
- 4. Market Factor Analysis
- 4.1. Porters Five Forces
- 4.2. Supply/Value Chain
- 4.3. PESTEL analysis
- 4.4. Market Entropy
- 4.5. Patent/Trademark Analysis
- 5. Global Hemostatic Patch Analysis, Insights and Forecast, 2020-2032
- 5.1. Market Analysis, Insights and Forecast - by Application
- 5.1.1. Hospital
- 5.1.2. Clinic
- 5.1.3. Other
- 5.2. Market Analysis, Insights and Forecast - by Types
- 5.2.1. Waterproof Type
- 5.2.2. Normal Type
- 5.2.3. Other
- 5.3. Market Analysis, Insights and Forecast - by Region
- 5.3.1. North America
- 5.3.2. South America
- 5.3.3. Europe
- 5.3.4. Middle East & Africa
- 5.3.5. Asia Pacific
- 5.1. Market Analysis, Insights and Forecast - by Application
- 6. North America Hemostatic Patch Analysis, Insights and Forecast, 2020-2032
- 6.1. Market Analysis, Insights and Forecast - by Application
- 6.1.1. Hospital
- 6.1.2. Clinic
- 6.1.3. Other
- 6.2. Market Analysis, Insights and Forecast - by Types
- 6.2.1. Waterproof Type
- 6.2.2. Normal Type
- 6.2.3. Other
- 6.1. Market Analysis, Insights and Forecast - by Application
- 7. South America Hemostatic Patch Analysis, Insights and Forecast, 2020-2032
- 7.1. Market Analysis, Insights and Forecast - by Application
- 7.1.1. Hospital
- 7.1.2. Clinic
- 7.1.3. Other
- 7.2. Market Analysis, Insights and Forecast - by Types
- 7.2.1. Waterproof Type
- 7.2.2. Normal Type
- 7.2.3. Other
- 7.1. Market Analysis, Insights and Forecast - by Application
- 8. Europe Hemostatic Patch Analysis, Insights and Forecast, 2020-2032
- 8.1. Market Analysis, Insights and Forecast - by Application
- 8.1.1. Hospital
- 8.1.2. Clinic
- 8.1.3. Other
- 8.2. Market Analysis, Insights and Forecast - by Types
- 8.2.1. Waterproof Type
- 8.2.2. Normal Type
- 8.2.3. Other
- 8.1. Market Analysis, Insights and Forecast - by Application
- 9. Middle East & Africa Hemostatic Patch Analysis, Insights and Forecast, 2020-2032
- 9.1. Market Analysis, Insights and Forecast - by Application
- 9.1.1. Hospital
- 9.1.2. Clinic
- 9.1.3. Other
- 9.2. Market Analysis, Insights and Forecast - by Types
- 9.2.1. Waterproof Type
- 9.2.2. Normal Type
- 9.2.3. Other
- 9.1. Market Analysis, Insights and Forecast - by Application
- 10. Asia Pacific Hemostatic Patch Analysis, Insights and Forecast, 2020-2032
- 10.1. Market Analysis, Insights and Forecast - by Application
- 10.1.1. Hospital
- 10.1.2. Clinic
- 10.1.3. Other
- 10.2. Market Analysis, Insights and Forecast - by Types
- 10.2.1. Waterproof Type
- 10.2.2. Normal Type
- 10.2.3. Other
- 10.1. Market Analysis, Insights and Forecast - by Application
- 11. Competitive Analysis
- 11.1. Global Market Share Analysis 2025
- 11.2. Company Profiles
- 11.2.1 Medtronic
- 11.2.1.1. Overview
- 11.2.1.2. Products
- 11.2.1.3. SWOT Analysis
- 11.2.1.4. Recent Developments
- 11.2.1.5. Financials (Based on Availability)
- 11.2.2 Johnson and Johnson
- 11.2.2.1. Overview
- 11.2.2.2. Products
- 11.2.2.3. SWOT Analysis
- 11.2.2.4. Recent Developments
- 11.2.2.5. Financials (Based on Availability)
- 11.2.3 Healthcare Systems
- 11.2.3.1. Overview
- 11.2.3.2. Products
- 11.2.3.3. SWOT Analysis
- 11.2.3.4. Recent Developments
- 11.2.3.5. Financials (Based on Availability)
- 11.2.4 Mermaid Medical
- 11.2.4.1. Overview
- 11.2.4.2. Products
- 11.2.4.3. SWOT Analysis
- 11.2.4.4. Recent Developments
- 11.2.4.5. Financials (Based on Availability)
- 11.2.5 Baxter International
- 11.2.5.1. Overview
- 11.2.5.2. Products
- 11.2.5.3. SWOT Analysis
- 11.2.5.4. Recent Developments
- 11.2.5.5. Financials (Based on Availability)
- 11.2.6 Advamedica
- 11.2.6.1. Overview
- 11.2.6.2. Products
- 11.2.6.3. SWOT Analysis
- 11.2.6.4. Recent Developments
- 11.2.6.5. Financials (Based on Availability)
- 11.2.7 QuikClot
- 11.2.7.1. Overview
- 11.2.7.2. Products
- 11.2.7.3. SWOT Analysis
- 11.2.7.4. Recent Developments
- 11.2.7.5. Financials (Based on Availability)
- 11.2.8 Tricol Biomedical
- 11.2.8.1. Overview
- 11.2.8.2. Products
- 11.2.8.3. SWOT Analysis
- 11.2.8.4. Recent Developments
- 11.2.8.5. Financials (Based on Availability)
- 11.2.9 Longmed Medical Technology Company
- 11.2.9.1. Overview
- 11.2.9.2. Products
- 11.2.9.3. SWOT Analysis
- 11.2.9.4. Recent Developments
- 11.2.9.5. Financials (Based on Availability)
- 11.2.10 3M
- 11.2.10.1. Overview
- 11.2.10.2. Products
- 11.2.10.3. SWOT Analysis
- 11.2.10.4. Recent Developments
- 11.2.10.5. Financials (Based on Availability)
- 11.2.11 Yunnan Baiyao Group
- 11.2.11.1. Overview
- 11.2.11.2. Products
- 11.2.11.3. SWOT Analysis
- 11.2.11.4. Recent Developments
- 11.2.11.5. Financials (Based on Availability)
- 11.2.12 Zhende Medical
- 11.2.12.1. Overview
- 11.2.12.2. Products
- 11.2.12.3. SWOT Analysis
- 11.2.12.4. Recent Developments
- 11.2.12.5. Financials (Based on Availability)
- 11.2.13 Nanfang Medical
- 11.2.13.1. Overview
- 11.2.13.2. Products
- 11.2.13.3. SWOT Analysis
- 11.2.13.4. Recent Developments
- 11.2.13.5. Financials (Based on Availability)
- 11.2.14 Cofoe
- 11.2.14.1. Overview
- 11.2.14.2. Products
- 11.2.14.3. SWOT Analysis
- 11.2.14.4. Recent Developments
- 11.2.14.5. Financials (Based on Availability)
- 11.2.1 Medtronic
List of Figures
- Figure 1: Global Hemostatic Patch Revenue Breakdown (undefined, %) by Region 2025 & 2033
- Figure 2: Global Hemostatic Patch Volume Breakdown (K, %) by Region 2025 & 2033
- Figure 3: North America Hemostatic Patch Revenue (undefined), by Application 2025 & 2033
- Figure 4: North America Hemostatic Patch Volume (K), by Application 2025 & 2033
- Figure 5: North America Hemostatic Patch Revenue Share (%), by Application 2025 & 2033
- Figure 6: North America Hemostatic Patch Volume Share (%), by Application 2025 & 2033
- Figure 7: North America Hemostatic Patch Revenue (undefined), by Types 2025 & 2033
- Figure 8: North America Hemostatic Patch Volume (K), by Types 2025 & 2033
- Figure 9: North America Hemostatic Patch Revenue Share (%), by Types 2025 & 2033
- Figure 10: North America Hemostatic Patch Volume Share (%), by Types 2025 & 2033
- Figure 11: North America Hemostatic Patch Revenue (undefined), by Country 2025 & 2033
- Figure 12: North America Hemostatic Patch Volume (K), by Country 2025 & 2033
- Figure 13: North America Hemostatic Patch Revenue Share (%), by Country 2025 & 2033
- Figure 14: North America Hemostatic Patch Volume Share (%), by Country 2025 & 2033
- Figure 15: South America Hemostatic Patch Revenue (undefined), by Application 2025 & 2033
- Figure 16: South America Hemostatic Patch Volume (K), by Application 2025 & 2033
- Figure 17: South America Hemostatic Patch Revenue Share (%), by Application 2025 & 2033
- Figure 18: South America Hemostatic Patch Volume Share (%), by Application 2025 & 2033
- Figure 19: South America Hemostatic Patch Revenue (undefined), by Types 2025 & 2033
- Figure 20: South America Hemostatic Patch Volume (K), by Types 2025 & 2033
- Figure 21: South America Hemostatic Patch Revenue Share (%), by Types 2025 & 2033
- Figure 22: South America Hemostatic Patch Volume Share (%), by Types 2025 & 2033
- Figure 23: South America Hemostatic Patch Revenue (undefined), by Country 2025 & 2033
- Figure 24: South America Hemostatic Patch Volume (K), by Country 2025 & 2033
- Figure 25: South America Hemostatic Patch Revenue Share (%), by Country 2025 & 2033
- Figure 26: South America Hemostatic Patch Volume Share (%), by Country 2025 & 2033
- Figure 27: Europe Hemostatic Patch Revenue (undefined), by Application 2025 & 2033
- Figure 28: Europe Hemostatic Patch Volume (K), by Application 2025 & 2033
- Figure 29: Europe Hemostatic Patch Revenue Share (%), by Application 2025 & 2033
- Figure 30: Europe Hemostatic Patch Volume Share (%), by Application 2025 & 2033
- Figure 31: Europe Hemostatic Patch Revenue (undefined), by Types 2025 & 2033
- Figure 32: Europe Hemostatic Patch Volume (K), by Types 2025 & 2033
- Figure 33: Europe Hemostatic Patch Revenue Share (%), by Types 2025 & 2033
- Figure 34: Europe Hemostatic Patch Volume Share (%), by Types 2025 & 2033
- Figure 35: Europe Hemostatic Patch Revenue (undefined), by Country 2025 & 2033
- Figure 36: Europe Hemostatic Patch Volume (K), by Country 2025 & 2033
- Figure 37: Europe Hemostatic Patch Revenue Share (%), by Country 2025 & 2033
- Figure 38: Europe Hemostatic Patch Volume Share (%), by Country 2025 & 2033
- Figure 39: Middle East & Africa Hemostatic Patch Revenue (undefined), by Application 2025 & 2033
- Figure 40: Middle East & Africa Hemostatic Patch Volume (K), by Application 2025 & 2033
- Figure 41: Middle East & Africa Hemostatic Patch Revenue Share (%), by Application 2025 & 2033
- Figure 42: Middle East & Africa Hemostatic Patch Volume Share (%), by Application 2025 & 2033
- Figure 43: Middle East & Africa Hemostatic Patch Revenue (undefined), by Types 2025 & 2033
- Figure 44: Middle East & Africa Hemostatic Patch Volume (K), by Types 2025 & 2033
- Figure 45: Middle East & Africa Hemostatic Patch Revenue Share (%), by Types 2025 & 2033
- Figure 46: Middle East & Africa Hemostatic Patch Volume Share (%), by Types 2025 & 2033
- Figure 47: Middle East & Africa Hemostatic Patch Revenue (undefined), by Country 2025 & 2033
- Figure 48: Middle East & Africa Hemostatic Patch Volume (K), by Country 2025 & 2033
- Figure 49: Middle East & Africa Hemostatic Patch Revenue Share (%), by Country 2025 & 2033
- Figure 50: Middle East & Africa Hemostatic Patch Volume Share (%), by Country 2025 & 2033
- Figure 51: Asia Pacific Hemostatic Patch Revenue (undefined), by Application 2025 & 2033
- Figure 52: Asia Pacific Hemostatic Patch Volume (K), by Application 2025 & 2033
- Figure 53: Asia Pacific Hemostatic Patch Revenue Share (%), by Application 2025 & 2033
- Figure 54: Asia Pacific Hemostatic Patch Volume Share (%), by Application 2025 & 2033
- Figure 55: Asia Pacific Hemostatic Patch Revenue (undefined), by Types 2025 & 2033
- Figure 56: Asia Pacific Hemostatic Patch Volume (K), by Types 2025 & 2033
- Figure 57: Asia Pacific Hemostatic Patch Revenue Share (%), by Types 2025 & 2033
- Figure 58: Asia Pacific Hemostatic Patch Volume Share (%), by Types 2025 & 2033
- Figure 59: Asia Pacific Hemostatic Patch Revenue (undefined), by Country 2025 & 2033
- Figure 60: Asia Pacific Hemostatic Patch Volume (K), by Country 2025 & 2033
- Figure 61: Asia Pacific Hemostatic Patch Revenue Share (%), by Country 2025 & 2033
- Figure 62: Asia Pacific Hemostatic Patch Volume Share (%), by Country 2025 & 2033
List of Tables
- Table 1: Global Hemostatic Patch Revenue undefined Forecast, by Application 2020 & 2033
- Table 2: Global Hemostatic Patch Volume K Forecast, by Application 2020 & 2033
- Table 3: Global Hemostatic Patch Revenue undefined Forecast, by Types 2020 & 2033
- Table 4: Global Hemostatic Patch Volume K Forecast, by Types 2020 & 2033
- Table 5: Global Hemostatic Patch Revenue undefined Forecast, by Region 2020 & 2033
- Table 6: Global Hemostatic Patch Volume K Forecast, by Region 2020 & 2033
- Table 7: Global Hemostatic Patch Revenue undefined Forecast, by Application 2020 & 2033
- Table 8: Global Hemostatic Patch Volume K Forecast, by Application 2020 & 2033
- Table 9: Global Hemostatic Patch Revenue undefined Forecast, by Types 2020 & 2033
- Table 10: Global Hemostatic Patch Volume K Forecast, by Types 2020 & 2033
- Table 11: Global Hemostatic Patch Revenue undefined Forecast, by Country 2020 & 2033
- Table 12: Global Hemostatic Patch Volume K Forecast, by Country 2020 & 2033
- Table 13: United States Hemostatic Patch Revenue (undefined) Forecast, by Application 2020 & 2033
- Table 14: United States Hemostatic Patch Volume (K) Forecast, by Application 2020 & 2033
- Table 15: Canada Hemostatic Patch Revenue (undefined) Forecast, by Application 2020 & 2033
- Table 16: Canada Hemostatic Patch Volume (K) Forecast, by Application 2020 & 2033
- Table 17: Mexico Hemostatic Patch Revenue (undefined) Forecast, by Application 2020 & 2033
- Table 18: Mexico Hemostatic Patch Volume (K) Forecast, by Application 2020 & 2033
- Table 19: Global Hemostatic Patch Revenue undefined Forecast, by Application 2020 & 2033
- Table 20: Global Hemostatic Patch Volume K Forecast, by Application 2020 & 2033
- Table 21: Global Hemostatic Patch Revenue undefined Forecast, by Types 2020 & 2033
- Table 22: Global Hemostatic Patch Volume K Forecast, by Types 2020 & 2033
- Table 23: Global Hemostatic Patch Revenue undefined Forecast, by Country 2020 & 2033
- Table 24: Global Hemostatic Patch Volume K Forecast, by Country 2020 & 2033
- Table 25: Brazil Hemostatic Patch Revenue (undefined) Forecast, by Application 2020 & 2033
- Table 26: Brazil Hemostatic Patch Volume (K) Forecast, by Application 2020 & 2033
- Table 27: Argentina Hemostatic Patch Revenue (undefined) Forecast, by Application 2020 & 2033
- Table 28: Argentina Hemostatic Patch Volume (K) Forecast, by Application 2020 & 2033
- Table 29: Rest of South America Hemostatic Patch Revenue (undefined) Forecast, by Application 2020 & 2033
- Table 30: Rest of South America Hemostatic Patch Volume (K) Forecast, by Application 2020 & 2033
- Table 31: Global Hemostatic Patch Revenue undefined Forecast, by Application 2020 & 2033
- Table 32: Global Hemostatic Patch Volume K Forecast, by Application 2020 & 2033
- Table 33: Global Hemostatic Patch Revenue undefined Forecast, by Types 2020 & 2033
- Table 34: Global Hemostatic Patch Volume K Forecast, by Types 2020 & 2033
- Table 35: Global Hemostatic Patch Revenue undefined Forecast, by Country 2020 & 2033
- Table 36: Global Hemostatic Patch Volume K Forecast, by Country 2020 & 2033
- Table 37: United Kingdom Hemostatic Patch Revenue (undefined) Forecast, by Application 2020 & 2033
- Table 38: United Kingdom Hemostatic Patch Volume (K) Forecast, by Application 2020 & 2033
- Table 39: Germany Hemostatic Patch Revenue (undefined) Forecast, by Application 2020 & 2033
- Table 40: Germany Hemostatic Patch Volume (K) Forecast, by Application 2020 & 2033
- Table 41: France Hemostatic Patch Revenue (undefined) Forecast, by Application 2020 & 2033
- Table 42: France Hemostatic Patch Volume (K) Forecast, by Application 2020 & 2033
- Table 43: Italy Hemostatic Patch Revenue (undefined) Forecast, by Application 2020 & 2033
- Table 44: Italy Hemostatic Patch Volume (K) Forecast, by Application 2020 & 2033
- Table 45: Spain Hemostatic Patch Revenue (undefined) Forecast, by Application 2020 & 2033
- Table 46: Spain Hemostatic Patch Volume (K) Forecast, by Application 2020 & 2033
- Table 47: Russia Hemostatic Patch Revenue (undefined) Forecast, by Application 2020 & 2033
- Table 48: Russia Hemostatic Patch Volume (K) Forecast, by Application 2020 & 2033
- Table 49: Benelux Hemostatic Patch Revenue (undefined) Forecast, by Application 2020 & 2033
- Table 50: Benelux Hemostatic Patch Volume (K) Forecast, by Application 2020 & 2033
- Table 51: Nordics Hemostatic Patch Revenue (undefined) Forecast, by Application 2020 & 2033
- Table 52: Nordics Hemostatic Patch Volume (K) Forecast, by Application 2020 & 2033
- Table 53: Rest of Europe Hemostatic Patch Revenue (undefined) Forecast, by Application 2020 & 2033
- Table 54: Rest of Europe Hemostatic Patch Volume (K) Forecast, by Application 2020 & 2033
- Table 55: Global Hemostatic Patch Revenue undefined Forecast, by Application 2020 & 2033
- Table 56: Global Hemostatic Patch Volume K Forecast, by Application 2020 & 2033
- Table 57: Global Hemostatic Patch Revenue undefined Forecast, by Types 2020 & 2033
- Table 58: Global Hemostatic Patch Volume K Forecast, by Types 2020 & 2033
- Table 59: Global Hemostatic Patch Revenue undefined Forecast, by Country 2020 & 2033
- Table 60: Global Hemostatic Patch Volume K Forecast, by Country 2020 & 2033
- Table 61: Turkey Hemostatic Patch Revenue (undefined) Forecast, by Application 2020 & 2033
- Table 62: Turkey Hemostatic Patch Volume (K) Forecast, by Application 2020 & 2033
- Table 63: Israel Hemostatic Patch Revenue (undefined) Forecast, by Application 2020 & 2033
- Table 64: Israel Hemostatic Patch Volume (K) Forecast, by Application 2020 & 2033
- Table 65: GCC Hemostatic Patch Revenue (undefined) Forecast, by Application 2020 & 2033
- Table 66: GCC Hemostatic Patch Volume (K) Forecast, by Application 2020 & 2033
- Table 67: North Africa Hemostatic Patch Revenue (undefined) Forecast, by Application 2020 & 2033
- Table 68: North Africa Hemostatic Patch Volume (K) Forecast, by Application 2020 & 2033
- Table 69: South Africa Hemostatic Patch Revenue (undefined) Forecast, by Application 2020 & 2033
- Table 70: South Africa Hemostatic Patch Volume (K) Forecast, by Application 2020 & 2033
- Table 71: Rest of Middle East & Africa Hemostatic Patch Revenue (undefined) Forecast, by Application 2020 & 2033
- Table 72: Rest of Middle East & Africa Hemostatic Patch Volume (K) Forecast, by Application 2020 & 2033
- Table 73: Global Hemostatic Patch Revenue undefined Forecast, by Application 2020 & 2033
- Table 74: Global Hemostatic Patch Volume K Forecast, by Application 2020 & 2033
- Table 75: Global Hemostatic Patch Revenue undefined Forecast, by Types 2020 & 2033
- Table 76: Global Hemostatic Patch Volume K Forecast, by Types 2020 & 2033
- Table 77: Global Hemostatic Patch Revenue undefined Forecast, by Country 2020 & 2033
- Table 78: Global Hemostatic Patch Volume K Forecast, by Country 2020 & 2033
- Table 79: China Hemostatic Patch Revenue (undefined) Forecast, by Application 2020 & 2033
- Table 80: China Hemostatic Patch Volume (K) Forecast, by Application 2020 & 2033
- Table 81: India Hemostatic Patch Revenue (undefined) Forecast, by Application 2020 & 2033
- Table 82: India Hemostatic Patch Volume (K) Forecast, by Application 2020 & 2033
- Table 83: Japan Hemostatic Patch Revenue (undefined) Forecast, by Application 2020 & 2033
- Table 84: Japan Hemostatic Patch Volume (K) Forecast, by Application 2020 & 2033
- Table 85: South Korea Hemostatic Patch Revenue (undefined) Forecast, by Application 2020 & 2033
- Table 86: South Korea Hemostatic Patch Volume (K) Forecast, by Application 2020 & 2033
- Table 87: ASEAN Hemostatic Patch Revenue (undefined) Forecast, by Application 2020 & 2033
- Table 88: ASEAN Hemostatic Patch Volume (K) Forecast, by Application 2020 & 2033
- Table 89: Oceania Hemostatic Patch Revenue (undefined) Forecast, by Application 2020 & 2033
- Table 90: Oceania Hemostatic Patch Volume (K) Forecast, by Application 2020 & 2033
- Table 91: Rest of Asia Pacific Hemostatic Patch Revenue (undefined) Forecast, by Application 2020 & 2033
- Table 92: Rest of Asia Pacific Hemostatic Patch Volume (K) Forecast, by Application 2020 & 2033
Frequently Asked Questions
1. What is the projected Compound Annual Growth Rate (CAGR) of the Hemostatic Patch?
The projected CAGR is approximately 6.2%.
2. Which companies are prominent players in the Hemostatic Patch?
Key companies in the market include Medtronic, Johnson and Johnson, Healthcare Systems, Mermaid Medical, Baxter International, Advamedica, QuikClot, Tricol Biomedical, Longmed Medical Technology Company, 3M, Yunnan Baiyao Group, Zhende Medical, Nanfang Medical, Cofoe.
3. What are the main segments of the Hemostatic Patch?
The market segments include Application, Types.
4. Can you provide details about the market size?
The market size is estimated to be USD XXX N/A as of 2022.
5. What are some drivers contributing to market growth?
N/A
6. What are the notable trends driving market growth?
N/A
7. Are there any restraints impacting market growth?
N/A
8. Can you provide examples of recent developments in the market?
N/A
9. What pricing options are available for accessing the report?
Pricing options include single-user, multi-user, and enterprise licenses priced at USD 3350.00, USD 5025.00, and USD 6700.00 respectively.
10. Is the market size provided in terms of value or volume?
The market size is provided in terms of value, measured in N/A and volume, measured in K.
11. Are there any specific market keywords associated with the report?
Yes, the market keyword associated with the report is "Hemostatic Patch," which aids in identifying and referencing the specific market segment covered.
12. How do I determine which pricing option suits my needs best?
The pricing options vary based on user requirements and access needs. Individual users may opt for single-user licenses, while businesses requiring broader access may choose multi-user or enterprise licenses for cost-effective access to the report.
13. Are there any additional resources or data provided in the Hemostatic Patch report?
While the report offers comprehensive insights, it's advisable to review the specific contents or supplementary materials provided to ascertain if additional resources or data are available.
14. How can I stay updated on further developments or reports in the Hemostatic Patch?
To stay informed about further developments, trends, and reports in the Hemostatic Patch, consider subscribing to industry newsletters, following relevant companies and organizations, or regularly checking reputable industry news sources and publications.
Methodology
Step 1 - Identification of Relevant Samples Size from Population Database


Step 2 - Approaches for Defining Global Market Size (Value, Volume* & Price*)

Note*: In applicable scenarios
Step 3 - Data Sources
Primary Research
- Web Analytics
- Survey Reports
- Research Institute
- Latest Research Reports
- Opinion Leaders
Secondary Research
- Annual Reports
- White Paper
- Latest Press Release
- Industry Association
- Paid Database
- Investor Presentations

Step 4 - Data Triangulation
Involves using different sources of information in order to increase the validity of a study
These sources are likely to be stakeholders in a program - participants, other researchers, program staff, other community members, and so on.
Then we put all data in single framework & apply various statistical tools to find out the dynamic on the market.
During the analysis stage, feedback from the stakeholder groups would be compared to determine areas of agreement as well as areas of divergence

