


Key Insights
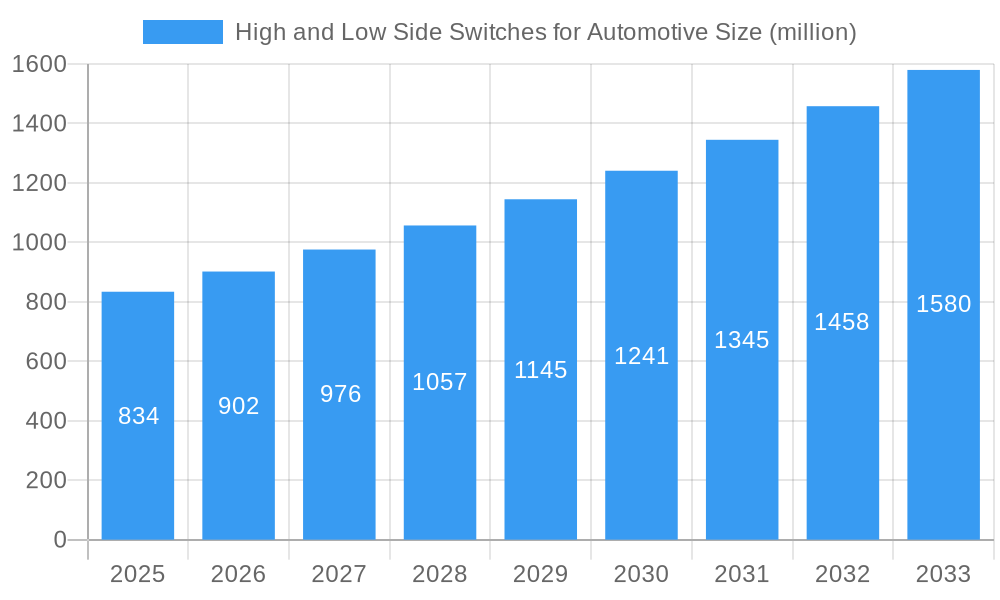
The automotive high and low-side switch market, valued at $834 million in 2025, is projected to experience robust growth, driven primarily by the increasing adoption of advanced driver-assistance systems (ADAS) and the proliferation of electric vehicles (EVs). The rising demand for enhanced safety features, improved fuel efficiency, and sophisticated power management necessitates the integration of more sophisticated switching solutions. This market segment benefits from technological advancements in semiconductor materials and packaging, leading to smaller, more efficient, and reliable switches. The competitive landscape is characterized by a mix of established players like Infineon Technologies, STMicroelectronics, and Texas Instruments alongside emerging companies, particularly in regions like Asia. The ongoing trend toward electrification is a significant catalyst, demanding high-voltage, high-power switches capable of handling the unique demands of EV powertrains and battery management systems. Factors such as stringent automotive safety standards and the high cost of development and qualification processes could pose challenges to market growth. However, ongoing innovation in silicon carbide (SiC) and gallium nitride (GaN) based switches is expected to mitigate these concerns and drive further expansion.
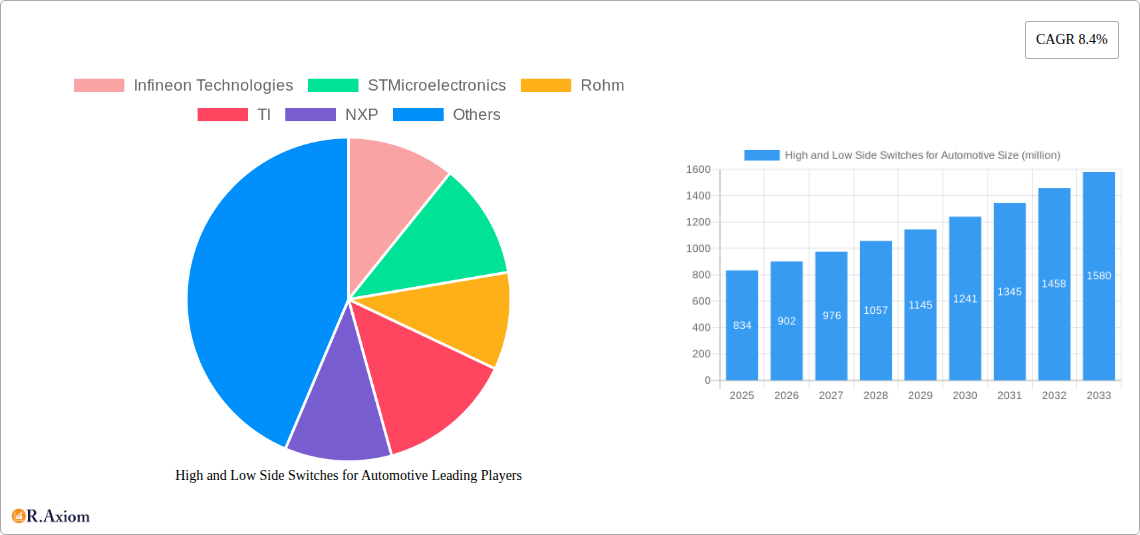
High and Low Side Switches for Automotive Market Size (In Million)

The forecast period (2025-2033) anticipates a continuation of this upward trajectory, with a compound annual growth rate (CAGR) of 8.4%. This growth reflects the broader trend of automotive electronics becoming increasingly complex, necessitating a higher volume and more diverse range of high and low-side switches. Regional variations will likely occur, with markets in North America, Europe, and Asia exhibiting strong growth fueled by variations in vehicle production and adoption of advanced technologies. The continued push towards autonomous driving capabilities will further enhance demand for sophisticated, reliable switching solutions, particularly those capable of managing the power requirements of radar, lidar, and other sensor systems. The market will likely see increased consolidation among existing players, with potential mergers and acquisitions to strengthen market positions.
High and Low Side Switches for Automotive Company Market Share
High and Low Side Switches for Automotive Market: A Comprehensive Analysis (2019-2033)
This comprehensive report provides an in-depth analysis of the High and Low Side Switches for Automotive market, offering invaluable insights for industry stakeholders, investors, and strategists. The report covers the period from 2019 to 2033, with a focus on the forecast period of 2025-2033 and a base year of 2025. The market is segmented by various factors, including geography, application, and technology, providing a granular understanding of the market dynamics and growth potential. This report utilizes data from reliable sources and employs advanced analytical techniques to deliver actionable insights and accurate market predictions. The market size is estimated to be in the millions of dollars.
High and Low Side Switches for Automotive Market Concentration & Innovation
This section analyzes the market concentration, identifying key players and their market share. It also explores the innovation drivers, regulatory landscape, and competitive dynamics within the automotive high and low-side switch market. The study period (2019-2024) reveals a dynamic market with significant M&A activity influencing market concentration.
Market Concentration: The market is moderately concentrated, with the top five players—Infineon Technologies, STMicroelectronics, NXP, Renesas Electronics, and Texas Instruments—holding an estimated xx% market share in 2025. Smaller players, including Rohm, onsemi, and Diodes Incorporated, contribute significantly to the overall market.
Innovation Drivers: The increasing demand for electric vehicles (EVs) and advanced driver-assistance systems (ADAS) fuels innovation in high and low-side switches. Miniaturization, improved efficiency, and enhanced reliability are key drivers shaping product development.
Regulatory Frameworks: Stringent automotive safety standards and emission regulations globally influence the adoption of high-performance and energy-efficient switches. Compliance with these standards is a major factor for manufacturers.
Product Substitutes: While few direct substitutes exist, advancements in alternative switching technologies, such as GaN and SiC, present potential challenges and opportunities.
End-User Trends: The shift towards EVs and autonomous vehicles drives demand for high-performance, reliable switches capable of handling high currents and voltages.
M&A Activities: The automotive semiconductor sector has witnessed significant M&A activity in the historical period, with several large transactions exceeding $xx million impacting market structure and competition. This consolidation trend is expected to continue into the forecast period.
High and Low Side Switches for Automotive Industry Trends & Insights
This section delves into the key trends shaping the automotive high and low-side switch market. It provides a detailed analysis of market growth drivers, technological disruptions, consumer preferences, and competitive dynamics. The analysis includes insights from 2019 to 2024 with projections extending to 2033.
The market experienced significant growth during the historical period (2019-2024), driven by the rising adoption of advanced driver-assistance systems (ADAS) and the increasing demand for electric vehicles (EVs). The compound annual growth rate (CAGR) during this period is estimated at xx%. Market penetration of high and low-side switches in the automotive sector is projected to reach xx% by 2033, driven by rising vehicle production and technological advancements. Technological disruptions, such as the adoption of wide-bandgap semiconductors (GaN and SiC), are expected to significantly alter the market landscape, impacting efficiency, cost, and performance. The preference for smaller, more efficient switches is driving innovation in packaging technologies and design. Competitive dynamics are characterized by intense competition amongst established players and the emergence of new entrants, leading to price pressures and continuous product improvements.
Dominant Markets & Segments in High and Low Side Switches for Automotive
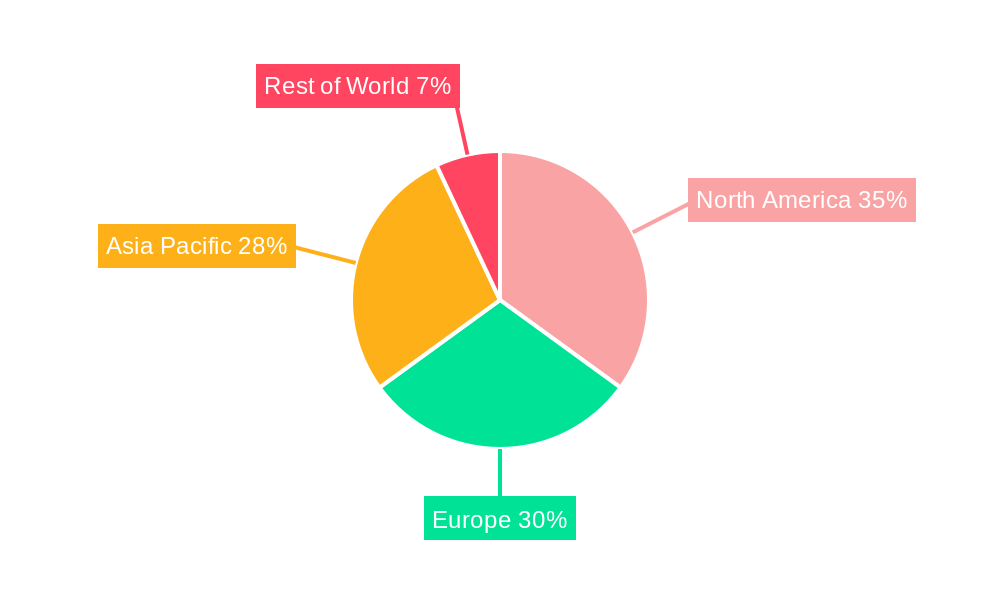
This section identifies the leading regions and segments in the global automotive high and low-side switch market.
The Asia-Pacific region is projected to dominate the market throughout the forecast period (2025-2033), driven by the rapid growth of the automotive industry in countries like China, Japan, and South Korea.
- Key Drivers in Asia-Pacific:
- Large and growing automotive manufacturing base.
- Significant investments in EV infrastructure and technology.
- Supportive government policies promoting electric vehicle adoption.
- Growing demand for ADAS features in vehicles.
This dominance is further reinforced by a robust supply chain ecosystem in the region, supporting the cost-effective manufacturing of automotive high and low-side switches. Europe and North America also represent significant markets, with growth influenced by factors such as stringent emission regulations and the increasing adoption of fuel-efficient and electric vehicles.
High and Low Side Switches for Automotive Product Developments
Recent product developments focus on enhancing efficiency, reducing size, and improving reliability. The integration of advanced features, such as integrated protection circuitry and enhanced thermal management, is becoming increasingly common. These innovations cater to the increasing demand for higher power density and improved performance in modern automotive applications. The market is witnessing a shift toward wide-bandgap semiconductor technology (GaN and SiC), offering significant improvements in efficiency and power density compared to traditional silicon-based devices.
Report Scope & Segmentation Analysis
The report segments the market by several factors:
By Product Type: High-side switches and Low-side switches, each with detailed analysis of growth rates and market share.
By Vehicle Type: Passenger cars, commercial vehicles, and two-wheelers, reflecting diverse demands and application requirements.
By Application: Powertrain, body control, lighting, and infotainment systems—highlighting the varying needs across different automotive functionalities.
By Geography: North America, Europe, Asia-Pacific, and Rest of the World—providing a regional perspective on market size and growth dynamics.
Key Drivers of High and Low Side Switches for Automotive Growth
The automotive high and low-side switch market's growth is driven by several factors:
The increasing adoption of electric and hybrid vehicles is a significant driver, as these vehicles require more sophisticated power management systems.
The rising demand for advanced driver-assistance systems (ADAS) necessitates higher-performance and more reliable switching components.
Stringent fuel efficiency regulations globally are driving manufacturers to adopt energy-efficient switches to meet regulatory requirements.
Challenges in the High and Low Side Switches for Automotive Sector
Challenges include:
Supply Chain Disruptions: Global supply chain instability can impact production and delivery times, leading to increased costs and delays.
High Development Costs: Developing advanced switching technologies requires significant investments in research and development, impacting overall profitability.
Intense Competition: The market is characterized by intense competition among numerous established players, resulting in price pressures and margin compression.
Emerging Opportunities in High and Low Side Switches for Automotive
Emerging opportunities exist in:
Wide-bandgap Semiconductor Technology: GaN and SiC-based switches offer significant improvements in efficiency and performance, opening up new market segments.
Automotive Electrification: The rapid adoption of electric and hybrid vehicles presents significant growth potential for high-performance switching components.
Autonomous Driving: The development of self-driving cars increases the demand for reliable and high-performance switches for various critical functions.
Leading Players in the High and Low Side Switches for Automotive Market
- Infineon Technologies
- STMicroelectronics
- Rohm
- TI
- NXP
- Renesas Electronics
- onsemi
- Diodes Incorporated
- Toshiba
- ADI
- Nexperia
- Suzhou Novosns
- Microchip Technology
- Dioo Microcircuits
- Fuji Electric
- Shenzhen MICHIP
- Monolithic Power Systems (MPS)
- ZLG Technology
- Shenhzen Winsemi
- Analogysemi
- Chengdu Convenient Power
- InverTek
- Halo Microelectronics Co.,Ltd
- BASALT Semiconductor Co.,Ltd
- Shaanxi Reactor Microelectronics
Key Developments in High and Low Side Switches for Automotive Industry
- 2022-Q4: Infineon Technologies announces a new generation of high-efficiency automotive switches.
- 2023-Q1: STMicroelectronics partners with an automotive manufacturer to develop a customized switch solution.
- 2023-Q2: NXP launches a new family of low-side switches optimized for electric vehicle applications. (Further details would be added here in the full report)
Strategic Outlook for High and Low Side Switches for Automotive Market
The automotive high and low-side switch market is poised for robust growth, driven by the ongoing shift toward electrification, autonomous driving, and the increasing adoption of ADAS features. The market is expected to witness continuous innovation in semiconductor technologies, packaging solutions, and product design, leading to improved performance, efficiency, and reliability. The growing demand for high-performance switches in various automotive applications presents significant opportunities for established players and new entrants alike. The market's future trajectory is highly positive, presenting lucrative prospects for businesses strategically positioned to capitalize on these trends.
High and Low Side Switches for Automotive Segmentation
-
1. Application
- 1.1. Automotive Lights
- 1.2. Automotiver Seats
- 1.3. Pumps
- 1.4. Automotiver Valves
- 1.5. Automotiver Power Distribution
- 1.6. Others
-
2. Types
- 2.1. Low Side Switches for Automotive
- 2.2. High Side Switches for Automotive
High and Low Side Switches for Automotive Segmentation By Geography
-
1. North America
- 1.1. United States
- 1.2. Canada
- 1.3. Mexico
-
2. South America
- 2.1. Brazil
- 2.2. Argentina
- 2.3. Rest of South America
-
3. Europe
- 3.1. United Kingdom
- 3.2. Germany
- 3.3. France
- 3.4. Italy
- 3.5. Spain
- 3.6. Russia
- 3.7. Benelux
- 3.8. Nordics
- 3.9. Rest of Europe
-
4. Middle East & Africa
- 4.1. Turkey
- 4.2. Israel
- 4.3. GCC
- 4.4. North Africa
- 4.5. South Africa
- 4.6. Rest of Middle East & Africa
-
5. Asia Pacific
- 5.1. China
- 5.2. India
- 5.3. Japan
- 5.4. South Korea
- 5.5. ASEAN
- 5.6. Oceania
- 5.7. Rest of Asia Pacific
High and Low Side Switches for Automotive Regional Market Share
Geographic Coverage of High and Low Side Switches for Automotive
High and Low Side Switches for Automotive REPORT HIGHLIGHTS
| Aspects | Details |
|---|---|
| Study Period | 2020-2034 |
| Base Year | 2025 |
| Estimated Year | 2026 |
| Forecast Period | 2026-2034 |
| Historical Period | 2020-2025 |
| Growth Rate | CAGR of 8.4% from 2020-2034 |
| Segmentation |
|
Table of Contents
- 1. Introduction
- 1.1. Research Scope
- 1.2. Market Segmentation
- 1.3. Research Methodology
- 1.4. Definitions and Assumptions
- 2. Executive Summary
- 2.1. Introduction
- 3. Market Dynamics
- 3.1. Introduction
- 3.2. Market Drivers
- 3.3. Market Restrains
- 3.4. Market Trends
- 4. Market Factor Analysis
- 4.1. Porters Five Forces
- 4.2. Supply/Value Chain
- 4.3. PESTEL analysis
- 4.4. Market Entropy
- 4.5. Patent/Trademark Analysis
- 5. Global High and Low Side Switches for Automotive Analysis, Insights and Forecast, 2020-2032
- 5.1. Market Analysis, Insights and Forecast - by Application
- 5.1.1. Automotive Lights
- 5.1.2. Automotiver Seats
- 5.1.3. Pumps
- 5.1.4. Automotiver Valves
- 5.1.5. Automotiver Power Distribution
- 5.1.6. Others
- 5.2. Market Analysis, Insights and Forecast - by Types
- 5.2.1. Low Side Switches for Automotive
- 5.2.2. High Side Switches for Automotive
- 5.3. Market Analysis, Insights and Forecast - by Region
- 5.3.1. North America
- 5.3.2. South America
- 5.3.3. Europe
- 5.3.4. Middle East & Africa
- 5.3.5. Asia Pacific
- 5.1. Market Analysis, Insights and Forecast - by Application
- 6. North America High and Low Side Switches for Automotive Analysis, Insights and Forecast, 2020-2032
- 6.1. Market Analysis, Insights and Forecast - by Application
- 6.1.1. Automotive Lights
- 6.1.2. Automotiver Seats
- 6.1.3. Pumps
- 6.1.4. Automotiver Valves
- 6.1.5. Automotiver Power Distribution
- 6.1.6. Others
- 6.2. Market Analysis, Insights and Forecast - by Types
- 6.2.1. Low Side Switches for Automotive
- 6.2.2. High Side Switches for Automotive
- 6.1. Market Analysis, Insights and Forecast - by Application
- 7. South America High and Low Side Switches for Automotive Analysis, Insights and Forecast, 2020-2032
- 7.1. Market Analysis, Insights and Forecast - by Application
- 7.1.1. Automotive Lights
- 7.1.2. Automotiver Seats
- 7.1.3. Pumps
- 7.1.4. Automotiver Valves
- 7.1.5. Automotiver Power Distribution
- 7.1.6. Others
- 7.2. Market Analysis, Insights and Forecast - by Types
- 7.2.1. Low Side Switches for Automotive
- 7.2.2. High Side Switches for Automotive
- 7.1. Market Analysis, Insights and Forecast - by Application
- 8. Europe High and Low Side Switches for Automotive Analysis, Insights and Forecast, 2020-2032
- 8.1. Market Analysis, Insights and Forecast - by Application
- 8.1.1. Automotive Lights
- 8.1.2. Automotiver Seats
- 8.1.3. Pumps
- 8.1.4. Automotiver Valves
- 8.1.5. Automotiver Power Distribution
- 8.1.6. Others
- 8.2. Market Analysis, Insights and Forecast - by Types
- 8.2.1. Low Side Switches for Automotive
- 8.2.2. High Side Switches for Automotive
- 8.1. Market Analysis, Insights and Forecast - by Application
- 9. Middle East & Africa High and Low Side Switches for Automotive Analysis, Insights and Forecast, 2020-2032
- 9.1. Market Analysis, Insights and Forecast - by Application
- 9.1.1. Automotive Lights
- 9.1.2. Automotiver Seats
- 9.1.3. Pumps
- 9.1.4. Automotiver Valves
- 9.1.5. Automotiver Power Distribution
- 9.1.6. Others
- 9.2. Market Analysis, Insights and Forecast - by Types
- 9.2.1. Low Side Switches for Automotive
- 9.2.2. High Side Switches for Automotive
- 9.1. Market Analysis, Insights and Forecast - by Application
- 10. Asia Pacific High and Low Side Switches for Automotive Analysis, Insights and Forecast, 2020-2032
- 10.1. Market Analysis, Insights and Forecast - by Application
- 10.1.1. Automotive Lights
- 10.1.2. Automotiver Seats
- 10.1.3. Pumps
- 10.1.4. Automotiver Valves
- 10.1.5. Automotiver Power Distribution
- 10.1.6. Others
- 10.2. Market Analysis, Insights and Forecast - by Types
- 10.2.1. Low Side Switches for Automotive
- 10.2.2. High Side Switches for Automotive
- 10.1. Market Analysis, Insights and Forecast - by Application
- 11. Competitive Analysis
- 11.1. Global Market Share Analysis 2025
- 11.2. Company Profiles
- 11.2.1 Infineon Technologies
- 11.2.1.1. Overview
- 11.2.1.2. Products
- 11.2.1.3. SWOT Analysis
- 11.2.1.4. Recent Developments
- 11.2.1.5. Financials (Based on Availability)
- 11.2.2 STMicroelectronics
- 11.2.2.1. Overview
- 11.2.2.2. Products
- 11.2.2.3. SWOT Analysis
- 11.2.2.4. Recent Developments
- 11.2.2.5. Financials (Based on Availability)
- 11.2.3 Rohm
- 11.2.3.1. Overview
- 11.2.3.2. Products
- 11.2.3.3. SWOT Analysis
- 11.2.3.4. Recent Developments
- 11.2.3.5. Financials (Based on Availability)
- 11.2.4 TI
- 11.2.4.1. Overview
- 11.2.4.2. Products
- 11.2.4.3. SWOT Analysis
- 11.2.4.4. Recent Developments
- 11.2.4.5. Financials (Based on Availability)
- 11.2.5 NXP
- 11.2.5.1. Overview
- 11.2.5.2. Products
- 11.2.5.3. SWOT Analysis
- 11.2.5.4. Recent Developments
- 11.2.5.5. Financials (Based on Availability)
- 11.2.6 Renesas Electronics
- 11.2.6.1. Overview
- 11.2.6.2. Products
- 11.2.6.3. SWOT Analysis
- 11.2.6.4. Recent Developments
- 11.2.6.5. Financials (Based on Availability)
- 11.2.7 onsemi
- 11.2.7.1. Overview
- 11.2.7.2. Products
- 11.2.7.3. SWOT Analysis
- 11.2.7.4. Recent Developments
- 11.2.7.5. Financials (Based on Availability)
- 11.2.8 Diodes Incorporated
- 11.2.8.1. Overview
- 11.2.8.2. Products
- 11.2.8.3. SWOT Analysis
- 11.2.8.4. Recent Developments
- 11.2.8.5. Financials (Based on Availability)
- 11.2.9 Toshiba
- 11.2.9.1. Overview
- 11.2.9.2. Products
- 11.2.9.3. SWOT Analysis
- 11.2.9.4. Recent Developments
- 11.2.9.5. Financials (Based on Availability)
- 11.2.10 ADI
- 11.2.10.1. Overview
- 11.2.10.2. Products
- 11.2.10.3. SWOT Analysis
- 11.2.10.4. Recent Developments
- 11.2.10.5. Financials (Based on Availability)
- 11.2.11 Nexperia
- 11.2.11.1. Overview
- 11.2.11.2. Products
- 11.2.11.3. SWOT Analysis
- 11.2.11.4. Recent Developments
- 11.2.11.5. Financials (Based on Availability)
- 11.2.12 Suzhou Novosns
- 11.2.12.1. Overview
- 11.2.12.2. Products
- 11.2.12.3. SWOT Analysis
- 11.2.12.4. Recent Developments
- 11.2.12.5. Financials (Based on Availability)
- 11.2.13 Microchip Technology
- 11.2.13.1. Overview
- 11.2.13.2. Products
- 11.2.13.3. SWOT Analysis
- 11.2.13.4. Recent Developments
- 11.2.13.5. Financials (Based on Availability)
- 11.2.14 Dioo Microcircuits
- 11.2.14.1. Overview
- 11.2.14.2. Products
- 11.2.14.3. SWOT Analysis
- 11.2.14.4. Recent Developments
- 11.2.14.5. Financials (Based on Availability)
- 11.2.15 Fuji Electric
- 11.2.15.1. Overview
- 11.2.15.2. Products
- 11.2.15.3. SWOT Analysis
- 11.2.15.4. Recent Developments
- 11.2.15.5. Financials (Based on Availability)
- 11.2.16 Shenzhen MICHIP
- 11.2.16.1. Overview
- 11.2.16.2. Products
- 11.2.16.3. SWOT Analysis
- 11.2.16.4. Recent Developments
- 11.2.16.5. Financials (Based on Availability)
- 11.2.17 Monolithic Power Systems (MPS)
- 11.2.17.1. Overview
- 11.2.17.2. Products
- 11.2.17.3. SWOT Analysis
- 11.2.17.4. Recent Developments
- 11.2.17.5. Financials (Based on Availability)
- 11.2.18 ZLG Technology
- 11.2.18.1. Overview
- 11.2.18.2. Products
- 11.2.18.3. SWOT Analysis
- 11.2.18.4. Recent Developments
- 11.2.18.5. Financials (Based on Availability)
- 11.2.19 Shenhzen Winsemi
- 11.2.19.1. Overview
- 11.2.19.2. Products
- 11.2.19.3. SWOT Analysis
- 11.2.19.4. Recent Developments
- 11.2.19.5. Financials (Based on Availability)
- 11.2.20 Analogysemi
- 11.2.20.1. Overview
- 11.2.20.2. Products
- 11.2.20.3. SWOT Analysis
- 11.2.20.4. Recent Developments
- 11.2.20.5. Financials (Based on Availability)
- 11.2.21 Chengdu Convenient Power
- 11.2.21.1. Overview
- 11.2.21.2. Products
- 11.2.21.3. SWOT Analysis
- 11.2.21.4. Recent Developments
- 11.2.21.5. Financials (Based on Availability)
- 11.2.22 InverTek
- 11.2.22.1. Overview
- 11.2.22.2. Products
- 11.2.22.3. SWOT Analysis
- 11.2.22.4. Recent Developments
- 11.2.22.5. Financials (Based on Availability)
- 11.2.23 Halo Microelectronics Co.
- 11.2.23.1. Overview
- 11.2.23.2. Products
- 11.2.23.3. SWOT Analysis
- 11.2.23.4. Recent Developments
- 11.2.23.5. Financials (Based on Availability)
- 11.2.24 Ltd
- 11.2.24.1. Overview
- 11.2.24.2. Products
- 11.2.24.3. SWOT Analysis
- 11.2.24.4. Recent Developments
- 11.2.24.5. Financials (Based on Availability)
- 11.2.25 BASALT Semiconductor Co.
- 11.2.25.1. Overview
- 11.2.25.2. Products
- 11.2.25.3. SWOT Analysis
- 11.2.25.4. Recent Developments
- 11.2.25.5. Financials (Based on Availability)
- 11.2.26 Ltd
- 11.2.26.1. Overview
- 11.2.26.2. Products
- 11.2.26.3. SWOT Analysis
- 11.2.26.4. Recent Developments
- 11.2.26.5. Financials (Based on Availability)
- 11.2.27 Shaanxi Reactor Microelectronics
- 11.2.27.1. Overview
- 11.2.27.2. Products
- 11.2.27.3. SWOT Analysis
- 11.2.27.4. Recent Developments
- 11.2.27.5. Financials (Based on Availability)
- 11.2.1 Infineon Technologies
List of Figures
- Figure 1: Global High and Low Side Switches for Automotive Revenue Breakdown (million, %) by Region 2025 & 2033
- Figure 2: Global High and Low Side Switches for Automotive Volume Breakdown (K, %) by Region 2025 & 2033
- Figure 3: North America High and Low Side Switches for Automotive Revenue (million), by Application 2025 & 2033
- Figure 4: North America High and Low Side Switches for Automotive Volume (K), by Application 2025 & 2033
- Figure 5: North America High and Low Side Switches for Automotive Revenue Share (%), by Application 2025 & 2033
- Figure 6: North America High and Low Side Switches for Automotive Volume Share (%), by Application 2025 & 2033
- Figure 7: North America High and Low Side Switches for Automotive Revenue (million), by Types 2025 & 2033
- Figure 8: North America High and Low Side Switches for Automotive Volume (K), by Types 2025 & 2033
- Figure 9: North America High and Low Side Switches for Automotive Revenue Share (%), by Types 2025 & 2033
- Figure 10: North America High and Low Side Switches for Automotive Volume Share (%), by Types 2025 & 2033
- Figure 11: North America High and Low Side Switches for Automotive Revenue (million), by Country 2025 & 2033
- Figure 12: North America High and Low Side Switches for Automotive Volume (K), by Country 2025 & 2033
- Figure 13: North America High and Low Side Switches for Automotive Revenue Share (%), by Country 2025 & 2033
- Figure 14: North America High and Low Side Switches for Automotive Volume Share (%), by Country 2025 & 2033
- Figure 15: South America High and Low Side Switches for Automotive Revenue (million), by Application 2025 & 2033
- Figure 16: South America High and Low Side Switches for Automotive Volume (K), by Application 2025 & 2033
- Figure 17: South America High and Low Side Switches for Automotive Revenue Share (%), by Application 2025 & 2033
- Figure 18: South America High and Low Side Switches for Automotive Volume Share (%), by Application 2025 & 2033
- Figure 19: South America High and Low Side Switches for Automotive Revenue (million), by Types 2025 & 2033
- Figure 20: South America High and Low Side Switches for Automotive Volume (K), by Types 2025 & 2033
- Figure 21: South America High and Low Side Switches for Automotive Revenue Share (%), by Types 2025 & 2033
- Figure 22: South America High and Low Side Switches for Automotive Volume Share (%), by Types 2025 & 2033
- Figure 23: South America High and Low Side Switches for Automotive Revenue (million), by Country 2025 & 2033
- Figure 24: South America High and Low Side Switches for Automotive Volume (K), by Country 2025 & 2033
- Figure 25: South America High and Low Side Switches for Automotive Revenue Share (%), by Country 2025 & 2033
- Figure 26: South America High and Low Side Switches for Automotive Volume Share (%), by Country 2025 & 2033
- Figure 27: Europe High and Low Side Switches for Automotive Revenue (million), by Application 2025 & 2033
- Figure 28: Europe High and Low Side Switches for Automotive Volume (K), by Application 2025 & 2033
- Figure 29: Europe High and Low Side Switches for Automotive Revenue Share (%), by Application 2025 & 2033
- Figure 30: Europe High and Low Side Switches for Automotive Volume Share (%), by Application 2025 & 2033
- Figure 31: Europe High and Low Side Switches for Automotive Revenue (million), by Types 2025 & 2033
- Figure 32: Europe High and Low Side Switches for Automotive Volume (K), by Types 2025 & 2033
- Figure 33: Europe High and Low Side Switches for Automotive Revenue Share (%), by Types 2025 & 2033
- Figure 34: Europe High and Low Side Switches for Automotive Volume Share (%), by Types 2025 & 2033
- Figure 35: Europe High and Low Side Switches for Automotive Revenue (million), by Country 2025 & 2033
- Figure 36: Europe High and Low Side Switches for Automotive Volume (K), by Country 2025 & 2033
- Figure 37: Europe High and Low Side Switches for Automotive Revenue Share (%), by Country 2025 & 2033
- Figure 38: Europe High and Low Side Switches for Automotive Volume Share (%), by Country 2025 & 2033
- Figure 39: Middle East & Africa High and Low Side Switches for Automotive Revenue (million), by Application 2025 & 2033
- Figure 40: Middle East & Africa High and Low Side Switches for Automotive Volume (K), by Application 2025 & 2033
- Figure 41: Middle East & Africa High and Low Side Switches for Automotive Revenue Share (%), by Application 2025 & 2033
- Figure 42: Middle East & Africa High and Low Side Switches for Automotive Volume Share (%), by Application 2025 & 2033
- Figure 43: Middle East & Africa High and Low Side Switches for Automotive Revenue (million), by Types 2025 & 2033
- Figure 44: Middle East & Africa High and Low Side Switches for Automotive Volume (K), by Types 2025 & 2033
- Figure 45: Middle East & Africa High and Low Side Switches for Automotive Revenue Share (%), by Types 2025 & 2033
- Figure 46: Middle East & Africa High and Low Side Switches for Automotive Volume Share (%), by Types 2025 & 2033
- Figure 47: Middle East & Africa High and Low Side Switches for Automotive Revenue (million), by Country 2025 & 2033
- Figure 48: Middle East & Africa High and Low Side Switches for Automotive Volume (K), by Country 2025 & 2033
- Figure 49: Middle East & Africa High and Low Side Switches for Automotive Revenue Share (%), by Country 2025 & 2033
- Figure 50: Middle East & Africa High and Low Side Switches for Automotive Volume Share (%), by Country 2025 & 2033
- Figure 51: Asia Pacific High and Low Side Switches for Automotive Revenue (million), by Application 2025 & 2033
- Figure 52: Asia Pacific High and Low Side Switches for Automotive Volume (K), by Application 2025 & 2033
- Figure 53: Asia Pacific High and Low Side Switches for Automotive Revenue Share (%), by Application 2025 & 2033
- Figure 54: Asia Pacific High and Low Side Switches for Automotive Volume Share (%), by Application 2025 & 2033
- Figure 55: Asia Pacific High and Low Side Switches for Automotive Revenue (million), by Types 2025 & 2033
- Figure 56: Asia Pacific High and Low Side Switches for Automotive Volume (K), by Types 2025 & 2033
- Figure 57: Asia Pacific High and Low Side Switches for Automotive Revenue Share (%), by Types 2025 & 2033
- Figure 58: Asia Pacific High and Low Side Switches for Automotive Volume Share (%), by Types 2025 & 2033
- Figure 59: Asia Pacific High and Low Side Switches for Automotive Revenue (million), by Country 2025 & 2033
- Figure 60: Asia Pacific High and Low Side Switches for Automotive Volume (K), by Country 2025 & 2033
- Figure 61: Asia Pacific High and Low Side Switches for Automotive Revenue Share (%), by Country 2025 & 2033
- Figure 62: Asia Pacific High and Low Side Switches for Automotive Volume Share (%), by Country 2025 & 2033
List of Tables
- Table 1: Global High and Low Side Switches for Automotive Revenue million Forecast, by Application 2020 & 2033
- Table 2: Global High and Low Side Switches for Automotive Volume K Forecast, by Application 2020 & 2033
- Table 3: Global High and Low Side Switches for Automotive Revenue million Forecast, by Types 2020 & 2033
- Table 4: Global High and Low Side Switches for Automotive Volume K Forecast, by Types 2020 & 2033
- Table 5: Global High and Low Side Switches for Automotive Revenue million Forecast, by Region 2020 & 2033
- Table 6: Global High and Low Side Switches for Automotive Volume K Forecast, by Region 2020 & 2033
- Table 7: Global High and Low Side Switches for Automotive Revenue million Forecast, by Application 2020 & 2033
- Table 8: Global High and Low Side Switches for Automotive Volume K Forecast, by Application 2020 & 2033
- Table 9: Global High and Low Side Switches for Automotive Revenue million Forecast, by Types 2020 & 2033
- Table 10: Global High and Low Side Switches for Automotive Volume K Forecast, by Types 2020 & 2033
- Table 11: Global High and Low Side Switches for Automotive Revenue million Forecast, by Country 2020 & 2033
- Table 12: Global High and Low Side Switches for Automotive Volume K Forecast, by Country 2020 & 2033
- Table 13: United States High and Low Side Switches for Automotive Revenue (million) Forecast, by Application 2020 & 2033
- Table 14: United States High and Low Side Switches for Automotive Volume (K) Forecast, by Application 2020 & 2033
- Table 15: Canada High and Low Side Switches for Automotive Revenue (million) Forecast, by Application 2020 & 2033
- Table 16: Canada High and Low Side Switches for Automotive Volume (K) Forecast, by Application 2020 & 2033
- Table 17: Mexico High and Low Side Switches for Automotive Revenue (million) Forecast, by Application 2020 & 2033
- Table 18: Mexico High and Low Side Switches for Automotive Volume (K) Forecast, by Application 2020 & 2033
- Table 19: Global High and Low Side Switches for Automotive Revenue million Forecast, by Application 2020 & 2033
- Table 20: Global High and Low Side Switches for Automotive Volume K Forecast, by Application 2020 & 2033
- Table 21: Global High and Low Side Switches for Automotive Revenue million Forecast, by Types 2020 & 2033
- Table 22: Global High and Low Side Switches for Automotive Volume K Forecast, by Types 2020 & 2033
- Table 23: Global High and Low Side Switches for Automotive Revenue million Forecast, by Country 2020 & 2033
- Table 24: Global High and Low Side Switches for Automotive Volume K Forecast, by Country 2020 & 2033
- Table 25: Brazil High and Low Side Switches for Automotive Revenue (million) Forecast, by Application 2020 & 2033
- Table 26: Brazil High and Low Side Switches for Automotive Volume (K) Forecast, by Application 2020 & 2033
- Table 27: Argentina High and Low Side Switches for Automotive Revenue (million) Forecast, by Application 2020 & 2033
- Table 28: Argentina High and Low Side Switches for Automotive Volume (K) Forecast, by Application 2020 & 2033
- Table 29: Rest of South America High and Low Side Switches for Automotive Revenue (million) Forecast, by Application 2020 & 2033
- Table 30: Rest of South America High and Low Side Switches for Automotive Volume (K) Forecast, by Application 2020 & 2033
- Table 31: Global High and Low Side Switches for Automotive Revenue million Forecast, by Application 2020 & 2033
- Table 32: Global High and Low Side Switches for Automotive Volume K Forecast, by Application 2020 & 2033
- Table 33: Global High and Low Side Switches for Automotive Revenue million Forecast, by Types 2020 & 2033
- Table 34: Global High and Low Side Switches for Automotive Volume K Forecast, by Types 2020 & 2033
- Table 35: Global High and Low Side Switches for Automotive Revenue million Forecast, by Country 2020 & 2033
- Table 36: Global High and Low Side Switches for Automotive Volume K Forecast, by Country 2020 & 2033
- Table 37: United Kingdom High and Low Side Switches for Automotive Revenue (million) Forecast, by Application 2020 & 2033
- Table 38: United Kingdom High and Low Side Switches for Automotive Volume (K) Forecast, by Application 2020 & 2033
- Table 39: Germany High and Low Side Switches for Automotive Revenue (million) Forecast, by Application 2020 & 2033
- Table 40: Germany High and Low Side Switches for Automotive Volume (K) Forecast, by Application 2020 & 2033
- Table 41: France High and Low Side Switches for Automotive Revenue (million) Forecast, by Application 2020 & 2033
- Table 42: France High and Low Side Switches for Automotive Volume (K) Forecast, by Application 2020 & 2033
- Table 43: Italy High and Low Side Switches for Automotive Revenue (million) Forecast, by Application 2020 & 2033
- Table 44: Italy High and Low Side Switches for Automotive Volume (K) Forecast, by Application 2020 & 2033
- Table 45: Spain High and Low Side Switches for Automotive Revenue (million) Forecast, by Application 2020 & 2033
- Table 46: Spain High and Low Side Switches for Automotive Volume (K) Forecast, by Application 2020 & 2033
- Table 47: Russia High and Low Side Switches for Automotive Revenue (million) Forecast, by Application 2020 & 2033
- Table 48: Russia High and Low Side Switches for Automotive Volume (K) Forecast, by Application 2020 & 2033
- Table 49: Benelux High and Low Side Switches for Automotive Revenue (million) Forecast, by Application 2020 & 2033
- Table 50: Benelux High and Low Side Switches for Automotive Volume (K) Forecast, by Application 2020 & 2033
- Table 51: Nordics High and Low Side Switches for Automotive Revenue (million) Forecast, by Application 2020 & 2033
- Table 52: Nordics High and Low Side Switches for Automotive Volume (K) Forecast, by Application 2020 & 2033
- Table 53: Rest of Europe High and Low Side Switches for Automotive Revenue (million) Forecast, by Application 2020 & 2033
- Table 54: Rest of Europe High and Low Side Switches for Automotive Volume (K) Forecast, by Application 2020 & 2033
- Table 55: Global High and Low Side Switches for Automotive Revenue million Forecast, by Application 2020 & 2033
- Table 56: Global High and Low Side Switches for Automotive Volume K Forecast, by Application 2020 & 2033
- Table 57: Global High and Low Side Switches for Automotive Revenue million Forecast, by Types 2020 & 2033
- Table 58: Global High and Low Side Switches for Automotive Volume K Forecast, by Types 2020 & 2033
- Table 59: Global High and Low Side Switches for Automotive Revenue million Forecast, by Country 2020 & 2033
- Table 60: Global High and Low Side Switches for Automotive Volume K Forecast, by Country 2020 & 2033
- Table 61: Turkey High and Low Side Switches for Automotive Revenue (million) Forecast, by Application 2020 & 2033
- Table 62: Turkey High and Low Side Switches for Automotive Volume (K) Forecast, by Application 2020 & 2033
- Table 63: Israel High and Low Side Switches for Automotive Revenue (million) Forecast, by Application 2020 & 2033
- Table 64: Israel High and Low Side Switches for Automotive Volume (K) Forecast, by Application 2020 & 2033
- Table 65: GCC High and Low Side Switches for Automotive Revenue (million) Forecast, by Application 2020 & 2033
- Table 66: GCC High and Low Side Switches for Automotive Volume (K) Forecast, by Application 2020 & 2033
- Table 67: North Africa High and Low Side Switches for Automotive Revenue (million) Forecast, by Application 2020 & 2033
- Table 68: North Africa High and Low Side Switches for Automotive Volume (K) Forecast, by Application 2020 & 2033
- Table 69: South Africa High and Low Side Switches for Automotive Revenue (million) Forecast, by Application 2020 & 2033
- Table 70: South Africa High and Low Side Switches for Automotive Volume (K) Forecast, by Application 2020 & 2033
- Table 71: Rest of Middle East & Africa High and Low Side Switches for Automotive Revenue (million) Forecast, by Application 2020 & 2033
- Table 72: Rest of Middle East & Africa High and Low Side Switches for Automotive Volume (K) Forecast, by Application 2020 & 2033
- Table 73: Global High and Low Side Switches for Automotive Revenue million Forecast, by Application 2020 & 2033
- Table 74: Global High and Low Side Switches for Automotive Volume K Forecast, by Application 2020 & 2033
- Table 75: Global High and Low Side Switches for Automotive Revenue million Forecast, by Types 2020 & 2033
- Table 76: Global High and Low Side Switches for Automotive Volume K Forecast, by Types 2020 & 2033
- Table 77: Global High and Low Side Switches for Automotive Revenue million Forecast, by Country 2020 & 2033
- Table 78: Global High and Low Side Switches for Automotive Volume K Forecast, by Country 2020 & 2033
- Table 79: China High and Low Side Switches for Automotive Revenue (million) Forecast, by Application 2020 & 2033
- Table 80: China High and Low Side Switches for Automotive Volume (K) Forecast, by Application 2020 & 2033
- Table 81: India High and Low Side Switches for Automotive Revenue (million) Forecast, by Application 2020 & 2033
- Table 82: India High and Low Side Switches for Automotive Volume (K) Forecast, by Application 2020 & 2033
- Table 83: Japan High and Low Side Switches for Automotive Revenue (million) Forecast, by Application 2020 & 2033
- Table 84: Japan High and Low Side Switches for Automotive Volume (K) Forecast, by Application 2020 & 2033
- Table 85: South Korea High and Low Side Switches for Automotive Revenue (million) Forecast, by Application 2020 & 2033
- Table 86: South Korea High and Low Side Switches for Automotive Volume (K) Forecast, by Application 2020 & 2033
- Table 87: ASEAN High and Low Side Switches for Automotive Revenue (million) Forecast, by Application 2020 & 2033
- Table 88: ASEAN High and Low Side Switches for Automotive Volume (K) Forecast, by Application 2020 & 2033
- Table 89: Oceania High and Low Side Switches for Automotive Revenue (million) Forecast, by Application 2020 & 2033
- Table 90: Oceania High and Low Side Switches for Automotive Volume (K) Forecast, by Application 2020 & 2033
- Table 91: Rest of Asia Pacific High and Low Side Switches for Automotive Revenue (million) Forecast, by Application 2020 & 2033
- Table 92: Rest of Asia Pacific High and Low Side Switches for Automotive Volume (K) Forecast, by Application 2020 & 2033
Frequently Asked Questions
1. What is the projected Compound Annual Growth Rate (CAGR) of the High and Low Side Switches for Automotive?
The projected CAGR is approximately 8.4%.
2. Which companies are prominent players in the High and Low Side Switches for Automotive?
Key companies in the market include Infineon Technologies, STMicroelectronics, Rohm, TI, NXP, Renesas Electronics, onsemi, Diodes Incorporated, Toshiba, ADI, Nexperia, Suzhou Novosns, Microchip Technology, Dioo Microcircuits, Fuji Electric, Shenzhen MICHIP, Monolithic Power Systems (MPS), ZLG Technology, Shenhzen Winsemi, Analogysemi, Chengdu Convenient Power, InverTek, Halo Microelectronics Co., Ltd, BASALT Semiconductor Co., Ltd, Shaanxi Reactor Microelectronics.
3. What are the main segments of the High and Low Side Switches for Automotive?
The market segments include Application, Types.
4. Can you provide details about the market size?
The market size is estimated to be USD 834 million as of 2022.
5. What are some drivers contributing to market growth?
N/A
6. What are the notable trends driving market growth?
N/A
7. Are there any restraints impacting market growth?
N/A
8. Can you provide examples of recent developments in the market?
N/A
9. What pricing options are available for accessing the report?
Pricing options include single-user, multi-user, and enterprise licenses priced at USD 4350.00, USD 6525.00, and USD 8700.00 respectively.
10. Is the market size provided in terms of value or volume?
The market size is provided in terms of value, measured in million and volume, measured in K.
11. Are there any specific market keywords associated with the report?
Yes, the market keyword associated with the report is "High and Low Side Switches for Automotive," which aids in identifying and referencing the specific market segment covered.
12. How do I determine which pricing option suits my needs best?
The pricing options vary based on user requirements and access needs. Individual users may opt for single-user licenses, while businesses requiring broader access may choose multi-user or enterprise licenses for cost-effective access to the report.
13. Are there any additional resources or data provided in the High and Low Side Switches for Automotive report?
While the report offers comprehensive insights, it's advisable to review the specific contents or supplementary materials provided to ascertain if additional resources or data are available.
14. How can I stay updated on further developments or reports in the High and Low Side Switches for Automotive?
To stay informed about further developments, trends, and reports in the High and Low Side Switches for Automotive, consider subscribing to industry newsletters, following relevant companies and organizations, or regularly checking reputable industry news sources and publications.
Methodology
Step 1 - Identification of Relevant Samples Size from Population Database


Step 2 - Approaches for Defining Global Market Size (Value, Volume* & Price*)

Note*: In applicable scenarios
Step 3 - Data Sources
Primary Research
- Web Analytics
- Survey Reports
- Research Institute
- Latest Research Reports
- Opinion Leaders
Secondary Research
- Annual Reports
- White Paper
- Latest Press Release
- Industry Association
- Paid Database
- Investor Presentations

Step 4 - Data Triangulation
Involves using different sources of information in order to increase the validity of a study
These sources are likely to be stakeholders in a program - participants, other researchers, program staff, other community members, and so on.
Then we put all data in single framework & apply various statistical tools to find out the dynamic on the market.
During the analysis stage, feedback from the stakeholder groups would be compared to determine areas of agreement as well as areas of divergence