


Key Insights
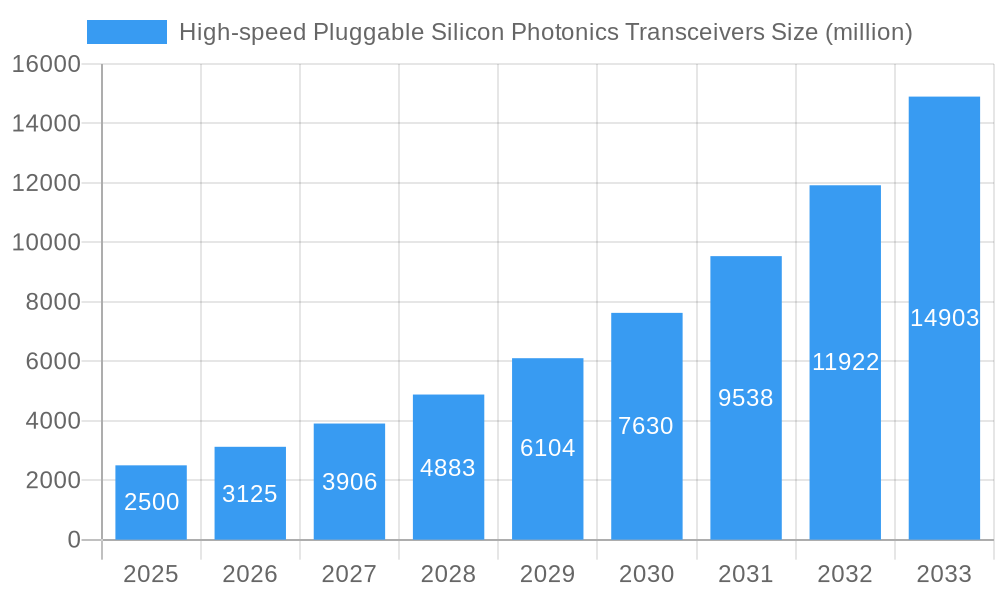
The high-speed pluggable silicon photonics transceivers market is experiencing substantial growth, propelled by the escalating demand for enhanced bandwidth and reduced latency in data centers and telecommunications. This expansion is driven by the widespread adoption of cloud computing, 5G infrastructure, and surging data traffic volumes. Leading companies, including Intel, Cisco Systems, and Marvell (via its acquisition of InPhi), are significantly investing in R&D, fostering continuous advancements in transceiver performance and cost optimization. This competitive environment fuels innovation, leading to faster data rates and more compact form factors, thereby amplifying market attractiveness. Despite challenges such as initial deployment costs and specialized infrastructure requirements, the long-term advantages in scalability and efficiency are projected to drive significant market expansion. We forecast a remarkable growth trajectory, with a compound annual growth rate (CAGR) of 25.3% from 2025 to 2033, attributed to ongoing technological progress and increasing sector-wide adoption.
High-speed Pluggable Silicon Photonics Transceivers Market Size (In Billion)

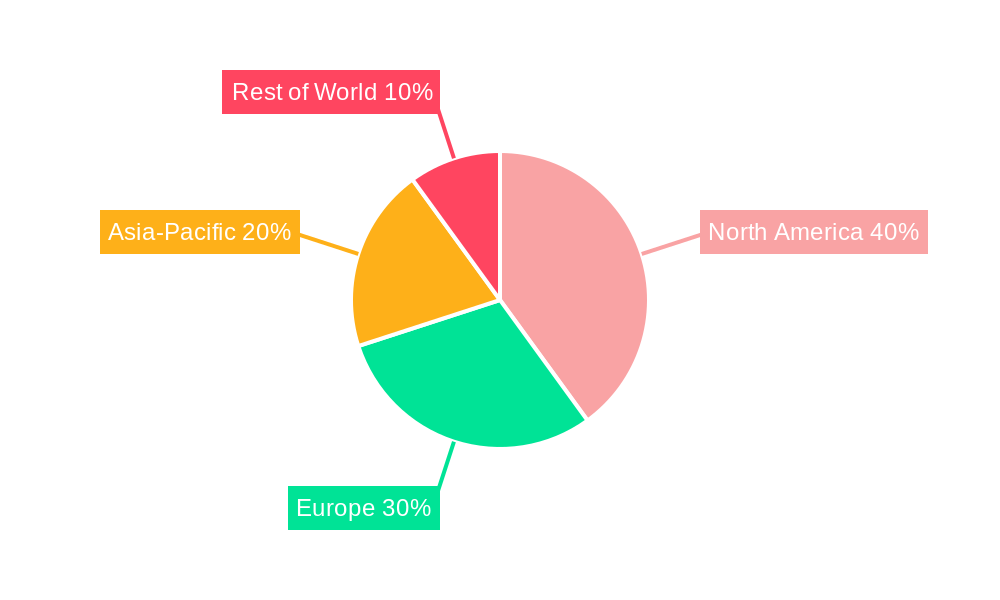
This growth is anticipated to be globally consistent, with North America and Europe initially leading due to advanced adoption and established infrastructure. Asia-Pacific, however, is poised for rapid expansion, fueled by substantial data center investments and developing telecommunication networks in emerging economies. The market is segmented by data rate, form factor, and application. Segments featuring higher data rates (e.g., 400G, 800G, and above) are expected to exhibit the fastest growth, reflecting the industry's persistent pursuit of superior data transmission capabilities. Continuous innovation in silicon photonics, focusing on integration density, power efficiency, and cost-effectiveness, will be paramount for sustained long-term market growth. The emergence of new market entrants and strategic collaborations further contribute to a dynamic and competitive landscape.
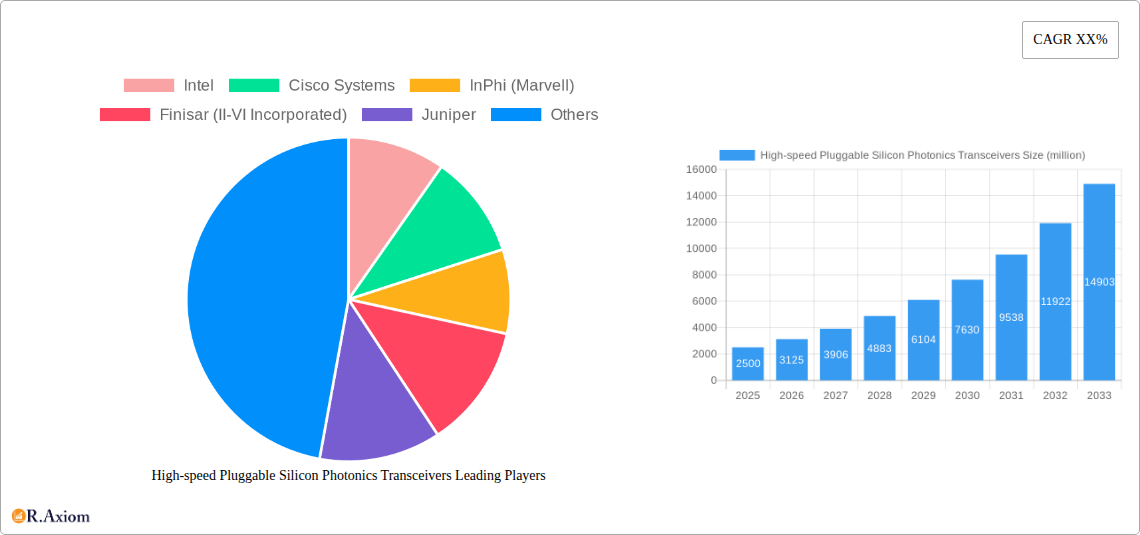
High-speed Pluggable Silicon Photonics Transceivers Company Market Share
High-Speed Pluggable Silicon Photonics Transceivers Market Analysis: 2025-2033
This comprehensive report delivers an in-depth analysis of the high-speed pluggable silicon photonics transceivers market, providing critical intelligence for stakeholders, investors, and strategists. Spanning the forecast period 2025-2033, with a base year of 2025, this report meticulously examines market dynamics, technological breakthroughs, competitive environments, and future growth potential. The market is projected to reach 3.27 billion by 2033, presenting significant growth opportunities. Key market participants, including Intel, Cisco Systems, InPhi (Marvell), Finisar (II-VI Incorporated), Juniper, Rockley Photonics, and FUJITSU, are thoroughly analyzed.
High-speed Pluggable Silicon Photonics Transceivers Market Concentration & Innovation
This section analyzes the market concentration, highlighting the market share held by key players like Intel, Cisco Systems, and InPhi (Marvell). We examine the innovative drivers shaping the market, including advancements in silicon photonics technology and the increasing demand for high-bandwidth data transmission. Regulatory frameworks impacting the industry and the presence of substitute technologies are also discussed. Furthermore, the report details end-user trends, such as the growing adoption of cloud computing and 5G networks, and analyzes significant M&A activities within the industry, including deal values and their impact on market consolidation. The report estimates that the top 5 players hold approximately xx% of the market share in 2025, with a projected xx% increase by 2033. The total value of M&A deals within the period 2019-2024 is estimated at xx million.
- Market Share Analysis: Detailed breakdown of market share for key players in 2025 and projected share in 2033.
- Innovation Drivers: Analysis of technological advancements driving market growth (e.g., higher data rates, lower power consumption).
- Regulatory Landscape: Overview of regulations influencing market development and adoption.
- M&A Activity: Review of significant mergers and acquisitions, including deal values and implications.
High-speed Pluggable Silicon Photonics Transceivers Industry Trends & Insights
This section delves into the key trends and insights shaping the high-speed pluggable silicon photonics transceivers market. We explore market growth drivers, including the escalating demand for high-bandwidth connectivity fueled by data center expansion, cloud computing adoption, and the proliferation of 5G networks. Technological disruptions, such as the emergence of coherent optical technologies and advancements in silicon photonics integration, are also analyzed, along with their impact on market dynamics. Consumer preferences, focusing on requirements for higher data rates, lower latency, and improved energy efficiency, are examined. The competitive dynamics, including pricing strategies, product differentiation, and technological innovation among key players, are thoroughly assessed. The market is expected to exhibit a Compound Annual Growth Rate (CAGR) of xx% during the forecast period (2025-2033), with market penetration expected to reach xx% by 2033.
Dominant Markets & Segments in High-speed Pluggable Silicon Photonics Transceivers
This section identifies the leading regions and segments within the high-speed pluggable silicon photonics transceivers market. North America is currently the dominant region due to the strong presence of major technology companies and a well-established data center infrastructure. However, the Asia-Pacific region is anticipated to experience significant growth owing to increasing investment in 5G infrastructure and the expanding data center market in countries like China and Japan.
- Key Drivers for North America:
- Strong presence of major technology companies and data centers.
- High investment in research and development.
- Robust telecommunications infrastructure.
- Key Drivers for Asia-Pacific:
- Rapid growth of data centers in China and Japan.
- Massive investment in 5G network infrastructure.
- Increasing adoption of cloud computing services.
- Segment Analysis: Detailed analysis of market segmentation by data rate, application (e.g., data centers, telecom), and form factor.
High-speed Pluggable Silicon Photonics Transceivers Product Developments
This section summarizes recent product innovations, highlighting advancements in data rates, power consumption, and form factors. The competitive advantages offered by these new products, such as improved energy efficiency and higher bandwidth capabilities, are discussed in the context of their market fit and alignment with emerging industry trends. The integration of artificial intelligence and machine learning into the design and operation of these transceivers are highlighted as significant technological trends.
Report Scope & Segmentation Analysis
This report segments the market by data rate (e.g., 400G, 800G, 1.6T), application (e.g., data centers, telecom networks), and form factor (e.g., CFP, QSFP-DD, OSFP). Each segment's growth projections, market size (in millions of USD), and competitive dynamics are analyzed. The market is expected to witness significant growth across all segments, driven by increasing demand for higher bandwidth and lower latency in various applications.
Key Drivers of High-speed Pluggable Silicon Photonics Transceivers Growth
The growth of the high-speed pluggable silicon photonics transceivers market is driven by several factors. The increasing demand for high-bandwidth connectivity in data centers, fueled by the growth of cloud computing and big data, is a primary driver. Furthermore, the deployment of 5G networks and the expansion of the Internet of Things (IoT) are contributing significantly to market growth. Advancements in silicon photonics technology, leading to smaller, more energy-efficient transceivers, are also key growth drivers. Government initiatives promoting the development and adoption of high-speed communication technologies further contribute to the market's expansion.
Challenges in the High-speed Pluggable Silicon Photonics Transceivers Sector
The high-speed pluggable silicon photonics transceivers market faces challenges, including the high cost of these advanced components, the complexity of integrating them into existing systems, and the potential for supply chain disruptions. Furthermore, stringent regulatory requirements for data security and interoperability can pose hurdles for market expansion. Competition from alternative technologies, such as copper cabling, although limited at higher data rates, also presents a challenge. These factors can collectively impact market growth by xx% in the coming years.
Emerging Opportunities in High-speed Pluggable Silicon Photonics Transceivers
Several opportunities exist within the high-speed pluggable silicon photonics transceivers market. The growing demand for high-bandwidth connectivity in edge computing deployments presents a significant opportunity for market expansion. Advancements in packaging technologies and the development of integrated photonic circuits promise to further reduce costs and improve performance, creating new opportunities for market penetration. Furthermore, emerging applications in artificial intelligence (AI) and machine learning (ML) require high-bandwidth communication, creating additional opportunities for growth.
Leading Players in the High-speed Pluggable Silicon Photonics Transceivers Market
Key Developments in High-speed Pluggable Silicon Photonics Transceivers Industry
- 2022 Q4: Intel announced a new generation of high-speed silicon photonics transceivers with enhanced performance.
- 2023 Q1: Cisco Systems acquired a smaller silicon photonics company, expanding its portfolio.
- 2023 Q2: Marvell launched a new line of 800G transceivers, increasing competition in the market. (Further developments can be added here as they occur)
Strategic Outlook for High-speed Pluggable Silicon Photonics Transceivers Market
The high-speed pluggable silicon photonics transceivers market is poised for significant growth in the coming years, driven by the continued expansion of data centers, the adoption of 5G networks, and technological advancements in silicon photonics. The market is expected to experience substantial growth, driven by these factors, creating numerous opportunities for key players to expand their market share and develop new, innovative products. Continuous innovation in silicon photonics technology, coupled with increasing demand for high-bandwidth connectivity, will shape the future of this market, presenting exciting prospects for industry stakeholders.
High-speed Pluggable Silicon Photonics Transceivers Segmentation
-
1. Application
- 1.1. Data Center
- 1.2. High Performance Computing
- 1.3. Telecom (FTTH, MAN)
- 1.4. Autonomous Cars
- 1.5. Others
-
2. Types
- 2.1. 100G
- 2.2. 200G
- 2.3. 400G
- 2.4. Others
High-speed Pluggable Silicon Photonics Transceivers Segmentation By Geography
-
1. North America
- 1.1. United States
- 1.2. Canada
- 1.3. Mexico
-
2. South America
- 2.1. Brazil
- 2.2. Argentina
- 2.3. Rest of South America
-
3. Europe
- 3.1. United Kingdom
- 3.2. Germany
- 3.3. France
- 3.4. Italy
- 3.5. Spain
- 3.6. Russia
- 3.7. Benelux
- 3.8. Nordics
- 3.9. Rest of Europe
-
4. Middle East & Africa
- 4.1. Turkey
- 4.2. Israel
- 4.3. GCC
- 4.4. North Africa
- 4.5. South Africa
- 4.6. Rest of Middle East & Africa
-
5. Asia Pacific
- 5.1. China
- 5.2. India
- 5.3. Japan
- 5.4. South Korea
- 5.5. ASEAN
- 5.6. Oceania
- 5.7. Rest of Asia Pacific
High-speed Pluggable Silicon Photonics Transceivers Regional Market Share
Geographic Coverage of High-speed Pluggable Silicon Photonics Transceivers
High-speed Pluggable Silicon Photonics Transceivers REPORT HIGHLIGHTS
| Aspects | Details |
|---|---|
| Study Period | 2020-2034 |
| Base Year | 2025 |
| Estimated Year | 2026 |
| Forecast Period | 2026-2034 |
| Historical Period | 2020-2025 |
| Growth Rate | CAGR of 25.3% from 2020-2034 |
| Segmentation |
|
Table of Contents
- 1. Introduction
- 1.1. Research Scope
- 1.2. Market Segmentation
- 1.3. Research Methodology
- 1.4. Definitions and Assumptions
- 2. Executive Summary
- 2.1. Introduction
- 3. Market Dynamics
- 3.1. Introduction
- 3.2. Market Drivers
- 3.3. Market Restrains
- 3.4. Market Trends
- 4. Market Factor Analysis
- 4.1. Porters Five Forces
- 4.2. Supply/Value Chain
- 4.3. PESTEL analysis
- 4.4. Market Entropy
- 4.5. Patent/Trademark Analysis
- 5. Global High-speed Pluggable Silicon Photonics Transceivers Analysis, Insights and Forecast, 2020-2032
- 5.1. Market Analysis, Insights and Forecast - by Application
- 5.1.1. Data Center
- 5.1.2. High Performance Computing
- 5.1.3. Telecom (FTTH, MAN)
- 5.1.4. Autonomous Cars
- 5.1.5. Others
- 5.2. Market Analysis, Insights and Forecast - by Types
- 5.2.1. 100G
- 5.2.2. 200G
- 5.2.3. 400G
- 5.2.4. Others
- 5.3. Market Analysis, Insights and Forecast - by Region
- 5.3.1. North America
- 5.3.2. South America
- 5.3.3. Europe
- 5.3.4. Middle East & Africa
- 5.3.5. Asia Pacific
- 5.1. Market Analysis, Insights and Forecast - by Application
- 6. North America High-speed Pluggable Silicon Photonics Transceivers Analysis, Insights and Forecast, 2020-2032
- 6.1. Market Analysis, Insights and Forecast - by Application
- 6.1.1. Data Center
- 6.1.2. High Performance Computing
- 6.1.3. Telecom (FTTH, MAN)
- 6.1.4. Autonomous Cars
- 6.1.5. Others
- 6.2. Market Analysis, Insights and Forecast - by Types
- 6.2.1. 100G
- 6.2.2. 200G
- 6.2.3. 400G
- 6.2.4. Others
- 6.1. Market Analysis, Insights and Forecast - by Application
- 7. South America High-speed Pluggable Silicon Photonics Transceivers Analysis, Insights and Forecast, 2020-2032
- 7.1. Market Analysis, Insights and Forecast - by Application
- 7.1.1. Data Center
- 7.1.2. High Performance Computing
- 7.1.3. Telecom (FTTH, MAN)
- 7.1.4. Autonomous Cars
- 7.1.5. Others
- 7.2. Market Analysis, Insights and Forecast - by Types
- 7.2.1. 100G
- 7.2.2. 200G
- 7.2.3. 400G
- 7.2.4. Others
- 7.1. Market Analysis, Insights and Forecast - by Application
- 8. Europe High-speed Pluggable Silicon Photonics Transceivers Analysis, Insights and Forecast, 2020-2032
- 8.1. Market Analysis, Insights and Forecast - by Application
- 8.1.1. Data Center
- 8.1.2. High Performance Computing
- 8.1.3. Telecom (FTTH, MAN)
- 8.1.4. Autonomous Cars
- 8.1.5. Others
- 8.2. Market Analysis, Insights and Forecast - by Types
- 8.2.1. 100G
- 8.2.2. 200G
- 8.2.3. 400G
- 8.2.4. Others
- 8.1. Market Analysis, Insights and Forecast - by Application
- 9. Middle East & Africa High-speed Pluggable Silicon Photonics Transceivers Analysis, Insights and Forecast, 2020-2032
- 9.1. Market Analysis, Insights and Forecast - by Application
- 9.1.1. Data Center
- 9.1.2. High Performance Computing
- 9.1.3. Telecom (FTTH, MAN)
- 9.1.4. Autonomous Cars
- 9.1.5. Others
- 9.2. Market Analysis, Insights and Forecast - by Types
- 9.2.1. 100G
- 9.2.2. 200G
- 9.2.3. 400G
- 9.2.4. Others
- 9.1. Market Analysis, Insights and Forecast - by Application
- 10. Asia Pacific High-speed Pluggable Silicon Photonics Transceivers Analysis, Insights and Forecast, 2020-2032
- 10.1. Market Analysis, Insights and Forecast - by Application
- 10.1.1. Data Center
- 10.1.2. High Performance Computing
- 10.1.3. Telecom (FTTH, MAN)
- 10.1.4. Autonomous Cars
- 10.1.5. Others
- 10.2. Market Analysis, Insights and Forecast - by Types
- 10.2.1. 100G
- 10.2.2. 200G
- 10.2.3. 400G
- 10.2.4. Others
- 10.1. Market Analysis, Insights and Forecast - by Application
- 11. Competitive Analysis
- 11.1. Global Market Share Analysis 2025
- 11.2. Company Profiles
- 11.2.1 Intel
- 11.2.1.1. Overview
- 11.2.1.2. Products
- 11.2.1.3. SWOT Analysis
- 11.2.1.4. Recent Developments
- 11.2.1.5. Financials (Based on Availability)
- 11.2.2 Cisco Systems
- 11.2.2.1. Overview
- 11.2.2.2. Products
- 11.2.2.3. SWOT Analysis
- 11.2.2.4. Recent Developments
- 11.2.2.5. Financials (Based on Availability)
- 11.2.3 InPhi (Marvell)
- 11.2.3.1. Overview
- 11.2.3.2. Products
- 11.2.3.3. SWOT Analysis
- 11.2.3.4. Recent Developments
- 11.2.3.5. Financials (Based on Availability)
- 11.2.4 Finisar (II-VI Incorporated)
- 11.2.4.1. Overview
- 11.2.4.2. Products
- 11.2.4.3. SWOT Analysis
- 11.2.4.4. Recent Developments
- 11.2.4.5. Financials (Based on Availability)
- 11.2.5 Juniper
- 11.2.5.1. Overview
- 11.2.5.2. Products
- 11.2.5.3. SWOT Analysis
- 11.2.5.4. Recent Developments
- 11.2.5.5. Financials (Based on Availability)
- 11.2.6 Rockley Photonics
- 11.2.6.1. Overview
- 11.2.6.2. Products
- 11.2.6.3. SWOT Analysis
- 11.2.6.4. Recent Developments
- 11.2.6.5. Financials (Based on Availability)
- 11.2.7 FUJITSU
- 11.2.7.1. Overview
- 11.2.7.2. Products
- 11.2.7.3. SWOT Analysis
- 11.2.7.4. Recent Developments
- 11.2.7.5. Financials (Based on Availability)
- 11.2.1 Intel
List of Figures
- Figure 1: Global High-speed Pluggable Silicon Photonics Transceivers Revenue Breakdown (billion, %) by Region 2025 & 2033
- Figure 2: Global High-speed Pluggable Silicon Photonics Transceivers Volume Breakdown (K, %) by Region 2025 & 2033
- Figure 3: North America High-speed Pluggable Silicon Photonics Transceivers Revenue (billion), by Application 2025 & 2033
- Figure 4: North America High-speed Pluggable Silicon Photonics Transceivers Volume (K), by Application 2025 & 2033
- Figure 5: North America High-speed Pluggable Silicon Photonics Transceivers Revenue Share (%), by Application 2025 & 2033
- Figure 6: North America High-speed Pluggable Silicon Photonics Transceivers Volume Share (%), by Application 2025 & 2033
- Figure 7: North America High-speed Pluggable Silicon Photonics Transceivers Revenue (billion), by Types 2025 & 2033
- Figure 8: North America High-speed Pluggable Silicon Photonics Transceivers Volume (K), by Types 2025 & 2033
- Figure 9: North America High-speed Pluggable Silicon Photonics Transceivers Revenue Share (%), by Types 2025 & 2033
- Figure 10: North America High-speed Pluggable Silicon Photonics Transceivers Volume Share (%), by Types 2025 & 2033
- Figure 11: North America High-speed Pluggable Silicon Photonics Transceivers Revenue (billion), by Country 2025 & 2033
- Figure 12: North America High-speed Pluggable Silicon Photonics Transceivers Volume (K), by Country 2025 & 2033
- Figure 13: North America High-speed Pluggable Silicon Photonics Transceivers Revenue Share (%), by Country 2025 & 2033
- Figure 14: North America High-speed Pluggable Silicon Photonics Transceivers Volume Share (%), by Country 2025 & 2033
- Figure 15: South America High-speed Pluggable Silicon Photonics Transceivers Revenue (billion), by Application 2025 & 2033
- Figure 16: South America High-speed Pluggable Silicon Photonics Transceivers Volume (K), by Application 2025 & 2033
- Figure 17: South America High-speed Pluggable Silicon Photonics Transceivers Revenue Share (%), by Application 2025 & 2033
- Figure 18: South America High-speed Pluggable Silicon Photonics Transceivers Volume Share (%), by Application 2025 & 2033
- Figure 19: South America High-speed Pluggable Silicon Photonics Transceivers Revenue (billion), by Types 2025 & 2033
- Figure 20: South America High-speed Pluggable Silicon Photonics Transceivers Volume (K), by Types 2025 & 2033
- Figure 21: South America High-speed Pluggable Silicon Photonics Transceivers Revenue Share (%), by Types 2025 & 2033
- Figure 22: South America High-speed Pluggable Silicon Photonics Transceivers Volume Share (%), by Types 2025 & 2033
- Figure 23: South America High-speed Pluggable Silicon Photonics Transceivers Revenue (billion), by Country 2025 & 2033
- Figure 24: South America High-speed Pluggable Silicon Photonics Transceivers Volume (K), by Country 2025 & 2033
- Figure 25: South America High-speed Pluggable Silicon Photonics Transceivers Revenue Share (%), by Country 2025 & 2033
- Figure 26: South America High-speed Pluggable Silicon Photonics Transceivers Volume Share (%), by Country 2025 & 2033
- Figure 27: Europe High-speed Pluggable Silicon Photonics Transceivers Revenue (billion), by Application 2025 & 2033
- Figure 28: Europe High-speed Pluggable Silicon Photonics Transceivers Volume (K), by Application 2025 & 2033
- Figure 29: Europe High-speed Pluggable Silicon Photonics Transceivers Revenue Share (%), by Application 2025 & 2033
- Figure 30: Europe High-speed Pluggable Silicon Photonics Transceivers Volume Share (%), by Application 2025 & 2033
- Figure 31: Europe High-speed Pluggable Silicon Photonics Transceivers Revenue (billion), by Types 2025 & 2033
- Figure 32: Europe High-speed Pluggable Silicon Photonics Transceivers Volume (K), by Types 2025 & 2033
- Figure 33: Europe High-speed Pluggable Silicon Photonics Transceivers Revenue Share (%), by Types 2025 & 2033
- Figure 34: Europe High-speed Pluggable Silicon Photonics Transceivers Volume Share (%), by Types 2025 & 2033
- Figure 35: Europe High-speed Pluggable Silicon Photonics Transceivers Revenue (billion), by Country 2025 & 2033
- Figure 36: Europe High-speed Pluggable Silicon Photonics Transceivers Volume (K), by Country 2025 & 2033
- Figure 37: Europe High-speed Pluggable Silicon Photonics Transceivers Revenue Share (%), by Country 2025 & 2033
- Figure 38: Europe High-speed Pluggable Silicon Photonics Transceivers Volume Share (%), by Country 2025 & 2033
- Figure 39: Middle East & Africa High-speed Pluggable Silicon Photonics Transceivers Revenue (billion), by Application 2025 & 2033
- Figure 40: Middle East & Africa High-speed Pluggable Silicon Photonics Transceivers Volume (K), by Application 2025 & 2033
- Figure 41: Middle East & Africa High-speed Pluggable Silicon Photonics Transceivers Revenue Share (%), by Application 2025 & 2033
- Figure 42: Middle East & Africa High-speed Pluggable Silicon Photonics Transceivers Volume Share (%), by Application 2025 & 2033
- Figure 43: Middle East & Africa High-speed Pluggable Silicon Photonics Transceivers Revenue (billion), by Types 2025 & 2033
- Figure 44: Middle East & Africa High-speed Pluggable Silicon Photonics Transceivers Volume (K), by Types 2025 & 2033
- Figure 45: Middle East & Africa High-speed Pluggable Silicon Photonics Transceivers Revenue Share (%), by Types 2025 & 2033
- Figure 46: Middle East & Africa High-speed Pluggable Silicon Photonics Transceivers Volume Share (%), by Types 2025 & 2033
- Figure 47: Middle East & Africa High-speed Pluggable Silicon Photonics Transceivers Revenue (billion), by Country 2025 & 2033
- Figure 48: Middle East & Africa High-speed Pluggable Silicon Photonics Transceivers Volume (K), by Country 2025 & 2033
- Figure 49: Middle East & Africa High-speed Pluggable Silicon Photonics Transceivers Revenue Share (%), by Country 2025 & 2033
- Figure 50: Middle East & Africa High-speed Pluggable Silicon Photonics Transceivers Volume Share (%), by Country 2025 & 2033
- Figure 51: Asia Pacific High-speed Pluggable Silicon Photonics Transceivers Revenue (billion), by Application 2025 & 2033
- Figure 52: Asia Pacific High-speed Pluggable Silicon Photonics Transceivers Volume (K), by Application 2025 & 2033
- Figure 53: Asia Pacific High-speed Pluggable Silicon Photonics Transceivers Revenue Share (%), by Application 2025 & 2033
- Figure 54: Asia Pacific High-speed Pluggable Silicon Photonics Transceivers Volume Share (%), by Application 2025 & 2033
- Figure 55: Asia Pacific High-speed Pluggable Silicon Photonics Transceivers Revenue (billion), by Types 2025 & 2033
- Figure 56: Asia Pacific High-speed Pluggable Silicon Photonics Transceivers Volume (K), by Types 2025 & 2033
- Figure 57: Asia Pacific High-speed Pluggable Silicon Photonics Transceivers Revenue Share (%), by Types 2025 & 2033
- Figure 58: Asia Pacific High-speed Pluggable Silicon Photonics Transceivers Volume Share (%), by Types 2025 & 2033
- Figure 59: Asia Pacific High-speed Pluggable Silicon Photonics Transceivers Revenue (billion), by Country 2025 & 2033
- Figure 60: Asia Pacific High-speed Pluggable Silicon Photonics Transceivers Volume (K), by Country 2025 & 2033
- Figure 61: Asia Pacific High-speed Pluggable Silicon Photonics Transceivers Revenue Share (%), by Country 2025 & 2033
- Figure 62: Asia Pacific High-speed Pluggable Silicon Photonics Transceivers Volume Share (%), by Country 2025 & 2033
List of Tables
- Table 1: Global High-speed Pluggable Silicon Photonics Transceivers Revenue billion Forecast, by Application 2020 & 2033
- Table 2: Global High-speed Pluggable Silicon Photonics Transceivers Volume K Forecast, by Application 2020 & 2033
- Table 3: Global High-speed Pluggable Silicon Photonics Transceivers Revenue billion Forecast, by Types 2020 & 2033
- Table 4: Global High-speed Pluggable Silicon Photonics Transceivers Volume K Forecast, by Types 2020 & 2033
- Table 5: Global High-speed Pluggable Silicon Photonics Transceivers Revenue billion Forecast, by Region 2020 & 2033
- Table 6: Global High-speed Pluggable Silicon Photonics Transceivers Volume K Forecast, by Region 2020 & 2033
- Table 7: Global High-speed Pluggable Silicon Photonics Transceivers Revenue billion Forecast, by Application 2020 & 2033
- Table 8: Global High-speed Pluggable Silicon Photonics Transceivers Volume K Forecast, by Application 2020 & 2033
- Table 9: Global High-speed Pluggable Silicon Photonics Transceivers Revenue billion Forecast, by Types 2020 & 2033
- Table 10: Global High-speed Pluggable Silicon Photonics Transceivers Volume K Forecast, by Types 2020 & 2033
- Table 11: Global High-speed Pluggable Silicon Photonics Transceivers Revenue billion Forecast, by Country 2020 & 2033
- Table 12: Global High-speed Pluggable Silicon Photonics Transceivers Volume K Forecast, by Country 2020 & 2033
- Table 13: United States High-speed Pluggable Silicon Photonics Transceivers Revenue (billion) Forecast, by Application 2020 & 2033
- Table 14: United States High-speed Pluggable Silicon Photonics Transceivers Volume (K) Forecast, by Application 2020 & 2033
- Table 15: Canada High-speed Pluggable Silicon Photonics Transceivers Revenue (billion) Forecast, by Application 2020 & 2033
- Table 16: Canada High-speed Pluggable Silicon Photonics Transceivers Volume (K) Forecast, by Application 2020 & 2033
- Table 17: Mexico High-speed Pluggable Silicon Photonics Transceivers Revenue (billion) Forecast, by Application 2020 & 2033
- Table 18: Mexico High-speed Pluggable Silicon Photonics Transceivers Volume (K) Forecast, by Application 2020 & 2033
- Table 19: Global High-speed Pluggable Silicon Photonics Transceivers Revenue billion Forecast, by Application 2020 & 2033
- Table 20: Global High-speed Pluggable Silicon Photonics Transceivers Volume K Forecast, by Application 2020 & 2033
- Table 21: Global High-speed Pluggable Silicon Photonics Transceivers Revenue billion Forecast, by Types 2020 & 2033
- Table 22: Global High-speed Pluggable Silicon Photonics Transceivers Volume K Forecast, by Types 2020 & 2033
- Table 23: Global High-speed Pluggable Silicon Photonics Transceivers Revenue billion Forecast, by Country 2020 & 2033
- Table 24: Global High-speed Pluggable Silicon Photonics Transceivers Volume K Forecast, by Country 2020 & 2033
- Table 25: Brazil High-speed Pluggable Silicon Photonics Transceivers Revenue (billion) Forecast, by Application 2020 & 2033
- Table 26: Brazil High-speed Pluggable Silicon Photonics Transceivers Volume (K) Forecast, by Application 2020 & 2033
- Table 27: Argentina High-speed Pluggable Silicon Photonics Transceivers Revenue (billion) Forecast, by Application 2020 & 2033
- Table 28: Argentina High-speed Pluggable Silicon Photonics Transceivers Volume (K) Forecast, by Application 2020 & 2033
- Table 29: Rest of South America High-speed Pluggable Silicon Photonics Transceivers Revenue (billion) Forecast, by Application 2020 & 2033
- Table 30: Rest of South America High-speed Pluggable Silicon Photonics Transceivers Volume (K) Forecast, by Application 2020 & 2033
- Table 31: Global High-speed Pluggable Silicon Photonics Transceivers Revenue billion Forecast, by Application 2020 & 2033
- Table 32: Global High-speed Pluggable Silicon Photonics Transceivers Volume K Forecast, by Application 2020 & 2033
- Table 33: Global High-speed Pluggable Silicon Photonics Transceivers Revenue billion Forecast, by Types 2020 & 2033
- Table 34: Global High-speed Pluggable Silicon Photonics Transceivers Volume K Forecast, by Types 2020 & 2033
- Table 35: Global High-speed Pluggable Silicon Photonics Transceivers Revenue billion Forecast, by Country 2020 & 2033
- Table 36: Global High-speed Pluggable Silicon Photonics Transceivers Volume K Forecast, by Country 2020 & 2033
- Table 37: United Kingdom High-speed Pluggable Silicon Photonics Transceivers Revenue (billion) Forecast, by Application 2020 & 2033
- Table 38: United Kingdom High-speed Pluggable Silicon Photonics Transceivers Volume (K) Forecast, by Application 2020 & 2033
- Table 39: Germany High-speed Pluggable Silicon Photonics Transceivers Revenue (billion) Forecast, by Application 2020 & 2033
- Table 40: Germany High-speed Pluggable Silicon Photonics Transceivers Volume (K) Forecast, by Application 2020 & 2033
- Table 41: France High-speed Pluggable Silicon Photonics Transceivers Revenue (billion) Forecast, by Application 2020 & 2033
- Table 42: France High-speed Pluggable Silicon Photonics Transceivers Volume (K) Forecast, by Application 2020 & 2033
- Table 43: Italy High-speed Pluggable Silicon Photonics Transceivers Revenue (billion) Forecast, by Application 2020 & 2033
- Table 44: Italy High-speed Pluggable Silicon Photonics Transceivers Volume (K) Forecast, by Application 2020 & 2033
- Table 45: Spain High-speed Pluggable Silicon Photonics Transceivers Revenue (billion) Forecast, by Application 2020 & 2033
- Table 46: Spain High-speed Pluggable Silicon Photonics Transceivers Volume (K) Forecast, by Application 2020 & 2033
- Table 47: Russia High-speed Pluggable Silicon Photonics Transceivers Revenue (billion) Forecast, by Application 2020 & 2033
- Table 48: Russia High-speed Pluggable Silicon Photonics Transceivers Volume (K) Forecast, by Application 2020 & 2033
- Table 49: Benelux High-speed Pluggable Silicon Photonics Transceivers Revenue (billion) Forecast, by Application 2020 & 2033
- Table 50: Benelux High-speed Pluggable Silicon Photonics Transceivers Volume (K) Forecast, by Application 2020 & 2033
- Table 51: Nordics High-speed Pluggable Silicon Photonics Transceivers Revenue (billion) Forecast, by Application 2020 & 2033
- Table 52: Nordics High-speed Pluggable Silicon Photonics Transceivers Volume (K) Forecast, by Application 2020 & 2033
- Table 53: Rest of Europe High-speed Pluggable Silicon Photonics Transceivers Revenue (billion) Forecast, by Application 2020 & 2033
- Table 54: Rest of Europe High-speed Pluggable Silicon Photonics Transceivers Volume (K) Forecast, by Application 2020 & 2033
- Table 55: Global High-speed Pluggable Silicon Photonics Transceivers Revenue billion Forecast, by Application 2020 & 2033
- Table 56: Global High-speed Pluggable Silicon Photonics Transceivers Volume K Forecast, by Application 2020 & 2033
- Table 57: Global High-speed Pluggable Silicon Photonics Transceivers Revenue billion Forecast, by Types 2020 & 2033
- Table 58: Global High-speed Pluggable Silicon Photonics Transceivers Volume K Forecast, by Types 2020 & 2033
- Table 59: Global High-speed Pluggable Silicon Photonics Transceivers Revenue billion Forecast, by Country 2020 & 2033
- Table 60: Global High-speed Pluggable Silicon Photonics Transceivers Volume K Forecast, by Country 2020 & 2033
- Table 61: Turkey High-speed Pluggable Silicon Photonics Transceivers Revenue (billion) Forecast, by Application 2020 & 2033
- Table 62: Turkey High-speed Pluggable Silicon Photonics Transceivers Volume (K) Forecast, by Application 2020 & 2033
- Table 63: Israel High-speed Pluggable Silicon Photonics Transceivers Revenue (billion) Forecast, by Application 2020 & 2033
- Table 64: Israel High-speed Pluggable Silicon Photonics Transceivers Volume (K) Forecast, by Application 2020 & 2033
- Table 65: GCC High-speed Pluggable Silicon Photonics Transceivers Revenue (billion) Forecast, by Application 2020 & 2033
- Table 66: GCC High-speed Pluggable Silicon Photonics Transceivers Volume (K) Forecast, by Application 2020 & 2033
- Table 67: North Africa High-speed Pluggable Silicon Photonics Transceivers Revenue (billion) Forecast, by Application 2020 & 2033
- Table 68: North Africa High-speed Pluggable Silicon Photonics Transceivers Volume (K) Forecast, by Application 2020 & 2033
- Table 69: South Africa High-speed Pluggable Silicon Photonics Transceivers Revenue (billion) Forecast, by Application 2020 & 2033
- Table 70: South Africa High-speed Pluggable Silicon Photonics Transceivers Volume (K) Forecast, by Application 2020 & 2033
- Table 71: Rest of Middle East & Africa High-speed Pluggable Silicon Photonics Transceivers Revenue (billion) Forecast, by Application 2020 & 2033
- Table 72: Rest of Middle East & Africa High-speed Pluggable Silicon Photonics Transceivers Volume (K) Forecast, by Application 2020 & 2033
- Table 73: Global High-speed Pluggable Silicon Photonics Transceivers Revenue billion Forecast, by Application 2020 & 2033
- Table 74: Global High-speed Pluggable Silicon Photonics Transceivers Volume K Forecast, by Application 2020 & 2033
- Table 75: Global High-speed Pluggable Silicon Photonics Transceivers Revenue billion Forecast, by Types 2020 & 2033
- Table 76: Global High-speed Pluggable Silicon Photonics Transceivers Volume K Forecast, by Types 2020 & 2033
- Table 77: Global High-speed Pluggable Silicon Photonics Transceivers Revenue billion Forecast, by Country 2020 & 2033
- Table 78: Global High-speed Pluggable Silicon Photonics Transceivers Volume K Forecast, by Country 2020 & 2033
- Table 79: China High-speed Pluggable Silicon Photonics Transceivers Revenue (billion) Forecast, by Application 2020 & 2033
- Table 80: China High-speed Pluggable Silicon Photonics Transceivers Volume (K) Forecast, by Application 2020 & 2033
- Table 81: India High-speed Pluggable Silicon Photonics Transceivers Revenue (billion) Forecast, by Application 2020 & 2033
- Table 82: India High-speed Pluggable Silicon Photonics Transceivers Volume (K) Forecast, by Application 2020 & 2033
- Table 83: Japan High-speed Pluggable Silicon Photonics Transceivers Revenue (billion) Forecast, by Application 2020 & 2033
- Table 84: Japan High-speed Pluggable Silicon Photonics Transceivers Volume (K) Forecast, by Application 2020 & 2033
- Table 85: South Korea High-speed Pluggable Silicon Photonics Transceivers Revenue (billion) Forecast, by Application 2020 & 2033
- Table 86: South Korea High-speed Pluggable Silicon Photonics Transceivers Volume (K) Forecast, by Application 2020 & 2033
- Table 87: ASEAN High-speed Pluggable Silicon Photonics Transceivers Revenue (billion) Forecast, by Application 2020 & 2033
- Table 88: ASEAN High-speed Pluggable Silicon Photonics Transceivers Volume (K) Forecast, by Application 2020 & 2033
- Table 89: Oceania High-speed Pluggable Silicon Photonics Transceivers Revenue (billion) Forecast, by Application 2020 & 2033
- Table 90: Oceania High-speed Pluggable Silicon Photonics Transceivers Volume (K) Forecast, by Application 2020 & 2033
- Table 91: Rest of Asia Pacific High-speed Pluggable Silicon Photonics Transceivers Revenue (billion) Forecast, by Application 2020 & 2033
- Table 92: Rest of Asia Pacific High-speed Pluggable Silicon Photonics Transceivers Volume (K) Forecast, by Application 2020 & 2033
Frequently Asked Questions
1. What is the projected Compound Annual Growth Rate (CAGR) of the High-speed Pluggable Silicon Photonics Transceivers?
The projected CAGR is approximately 25.3%.
2. Which companies are prominent players in the High-speed Pluggable Silicon Photonics Transceivers?
Key companies in the market include Intel, Cisco Systems, InPhi (Marvell), Finisar (II-VI Incorporated), Juniper, Rockley Photonics, FUJITSU.
3. What are the main segments of the High-speed Pluggable Silicon Photonics Transceivers?
The market segments include Application, Types.
4. Can you provide details about the market size?
The market size is estimated to be USD 3.27 billion as of 2022.
5. What are some drivers contributing to market growth?
N/A
6. What are the notable trends driving market growth?
N/A
7. Are there any restraints impacting market growth?
N/A
8. Can you provide examples of recent developments in the market?
N/A
9. What pricing options are available for accessing the report?
Pricing options include single-user, multi-user, and enterprise licenses priced at USD 3950.00, USD 5925.00, and USD 7900.00 respectively.
10. Is the market size provided in terms of value or volume?
The market size is provided in terms of value, measured in billion and volume, measured in K.
11. Are there any specific market keywords associated with the report?
Yes, the market keyword associated with the report is "High-speed Pluggable Silicon Photonics Transceivers," which aids in identifying and referencing the specific market segment covered.
12. How do I determine which pricing option suits my needs best?
The pricing options vary based on user requirements and access needs. Individual users may opt for single-user licenses, while businesses requiring broader access may choose multi-user or enterprise licenses for cost-effective access to the report.
13. Are there any additional resources or data provided in the High-speed Pluggable Silicon Photonics Transceivers report?
While the report offers comprehensive insights, it's advisable to review the specific contents or supplementary materials provided to ascertain if additional resources or data are available.
14. How can I stay updated on further developments or reports in the High-speed Pluggable Silicon Photonics Transceivers?
To stay informed about further developments, trends, and reports in the High-speed Pluggable Silicon Photonics Transceivers, consider subscribing to industry newsletters, following relevant companies and organizations, or regularly checking reputable industry news sources and publications.
Methodology
Step 1 - Identification of Relevant Samples Size from Population Database


Step 2 - Approaches for Defining Global Market Size (Value, Volume* & Price*)

Note*: In applicable scenarios
Step 3 - Data Sources
Primary Research
- Web Analytics
- Survey Reports
- Research Institute
- Latest Research Reports
- Opinion Leaders
Secondary Research
- Annual Reports
- White Paper
- Latest Press Release
- Industry Association
- Paid Database
- Investor Presentations

Step 4 - Data Triangulation
Involves using different sources of information in order to increase the validity of a study
These sources are likely to be stakeholders in a program - participants, other researchers, program staff, other community members, and so on.
Then we put all data in single framework & apply various statistical tools to find out the dynamic on the market.
During the analysis stage, feedback from the stakeholder groups would be compared to determine areas of agreement as well as areas of divergence