

Key Insights
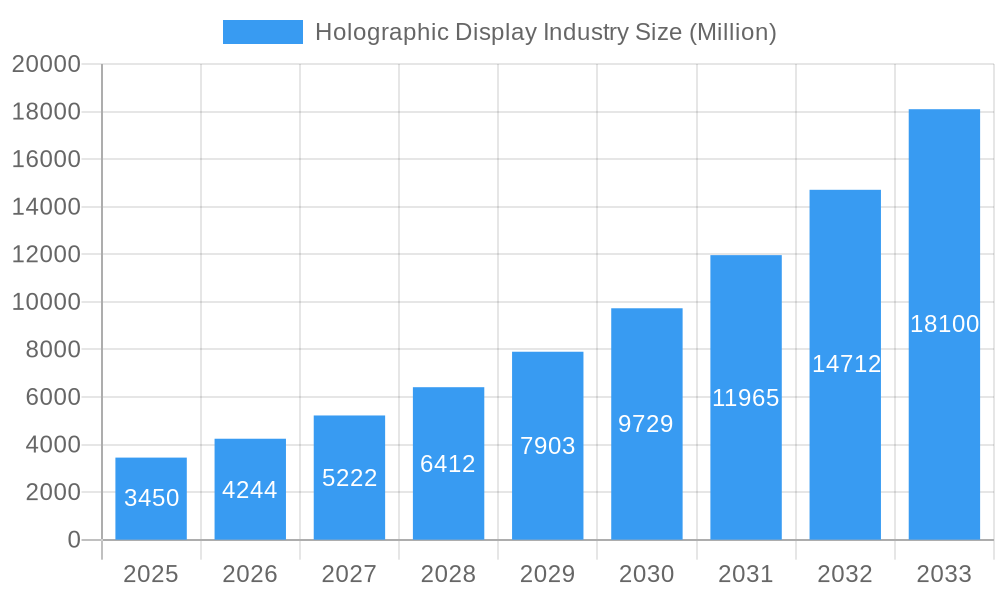
The holographic display market is experiencing explosive growth, projected to reach \$3.45 billion in 2025 and exhibiting a remarkable Compound Annual Growth Rate (CAGR) of 23.12% from 2025 to 2033. This surge is driven by increasing demand across diverse sectors. The consumer electronics industry is a major contributor, with holographic displays enhancing mobile devices, gaming consoles, and home entertainment systems. Retail is witnessing adoption for interactive product displays and immersive shopping experiences. The media and entertainment industry leverages holograms for captivating concerts, advertising, and theatrical productions. Further fueling market expansion is the growing adoption in military and defense for training simulations and advanced display systems, along with the integration into healthcare for medical imaging and surgical planning. The automotive sector is exploring applications in advanced heads-up displays and infotainment systems. Technological advancements such as improved resolution, brighter displays, and reduced production costs are key enablers of market growth. Competition among leading companies like Musion Das Hologram Ltd, Realview Imaging Ltd, and Looking Glass Factory Inc. is further driving innovation and affordability.
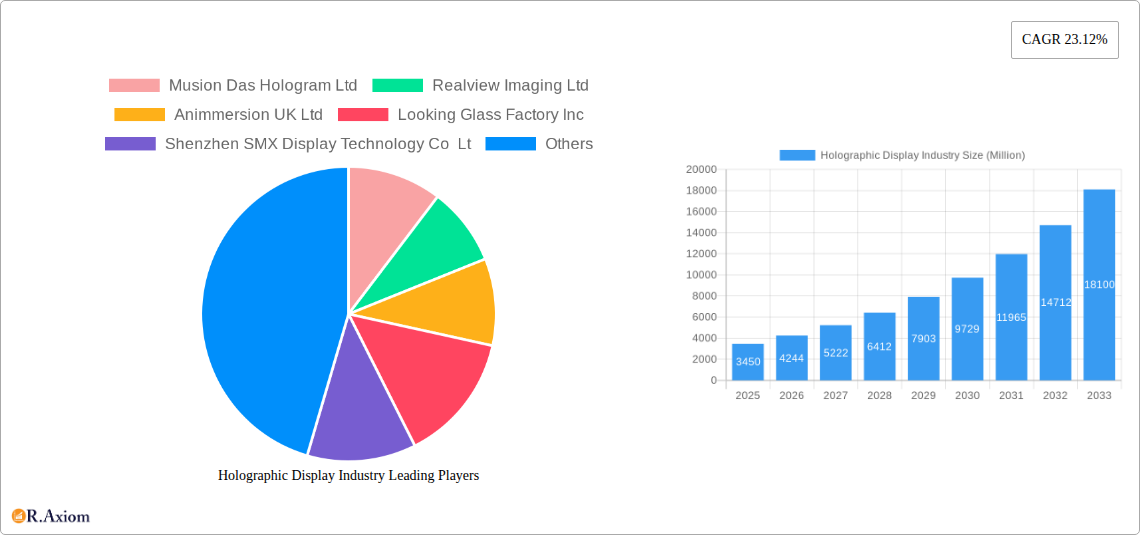
Holographic Display Industry Market Size (In Billion)
However, challenges remain. High production costs and limited availability of skilled professionals specializing in holographic display technology present hurdles to wider adoption. Concerns regarding the potential impact on human vision and the need for substantial infrastructure investment, particularly in the deployment of high-quality holographic systems, also act as restraints. Despite these challenges, the market’s trajectory remains overwhelmingly positive, fueled by consistent technological progress and increasing demand across various applications. Regional adoption varies, with North America and Europe currently leading, followed by rapidly developing markets in Asia. The next decade promises even greater innovation and broader integration of holographic displays across numerous industries, transforming the way we interact with technology and media.
Holographic Display Industry Company Market Share
Holographic Display Industry: A Comprehensive Market Report (2019-2033)
This comprehensive report provides an in-depth analysis of the holographic display industry, covering market size, growth projections, key players, technological advancements, and future opportunities. The study period spans from 2019 to 2033, with 2025 serving as the base and estimated year. The forecast period extends from 2025 to 2033, encompassing the historical period of 2019-2024. The report offers actionable insights for industry stakeholders, investors, and businesses seeking to understand and capitalize on the burgeoning holographic display market. The global market value in 2025 is estimated at $XX Million and is projected to reach $XX Million by 2033, exhibiting a CAGR of XX%.
Holographic Display Industry Market Concentration & Innovation
The holographic display market is characterized by a moderately concentrated landscape with several key players vying for market share. While a few dominant companies hold significant portions, the market also features a number of smaller, innovative companies. Market share data for 2024 suggests that the top 5 players account for approximately XX% of the global market, indicating a potential for further consolidation through mergers and acquisitions (M&A). Innovation drivers in the sector include advancements in display technologies (e.g., laser-based holographic projections, volumetric displays), improved image processing algorithms, and the development of more compact and cost-effective hardware. Regulatory frameworks vary across different regions, impacting market penetration and adoption rates. Product substitutes, such as advanced projection systems and high-resolution LED displays, present competitive challenges. End-user trends toward immersive experiences and interactive interfaces are significant growth drivers. M&A activity has been moderate, with deal values ranging from $XX Million to $XX Million in recent years, reflecting the strategic importance of acquiring technological expertise and expanding market reach.
- Key Players Market Share (2024): Musion Das Hologram Ltd (XX%), Realview Imaging Ltd (XX%), Animmersion UK Ltd (XX%), Looking Glass Factory Inc (XX%), others (XX%).
- Recent M&A Activity (2019-2024): Three deals valued at over $XX Million each, primarily focused on technology integration and market expansion.
Holographic Display Industry Industry Trends & Insights
The holographic display market is experiencing robust growth driven by several factors. The increasing demand for immersive and interactive experiences across various sectors, such as entertainment, retail, and healthcare, is a major catalyst. Technological advancements, including improvements in display resolution, brightness, and viewing angles, are enhancing the quality and realism of holographic projections. Consumer preferences are shifting towards more engaging and personalized experiences, boosting the adoption of holographic displays in consumer electronics and retail applications. The competitive dynamics are characterized by intense rivalry among established players and the emergence of new entrants with innovative technologies. The market is expected to witness significant growth during the forecast period (2025-2033), with several segments experiencing substantial market penetration. For instance, the adoption rate of holographic displays in the automotive sector is anticipated to increase substantially, driven by the integration of augmented reality (AR) features and advanced driver-assistance systems.
Dominant Markets & Segments in Holographic Display Industry
The North American market currently holds a dominant position, driven by robust technological advancements, high consumer spending power, and early adoption of holographic technology. Within the end-user verticals, the Media and Entertainment segment demonstrates the strongest growth, driven by increasing investments in immersive entertainment experiences and the use of holographic displays in live concerts, theaters, and theme parks.
- Key Drivers in North America: Strong R&D investments, early adoption of new technologies, high consumer demand.
- Key Drivers in Media & Entertainment: Demand for immersive experiences, increasing adoption in live events and entertainment venues, advancements in visual effects and projection technology.
- Market Dominance Analysis: North America leads in market size and technological advancements, while Asia-Pacific is expected to experience the fastest growth due to expanding economies and increasing investments in infrastructure.
Holographic Display Industry Product Developments
Recent advancements have led to the development of more compact, energy-efficient, and cost-effective holographic displays. These improvements are broadening the applications of this technology across diverse industries. The integration of AI and machine learning is enhancing the realism and interactivity of holographic projections, creating more engaging and immersive experiences. The introduction of transparent holographic displays in automobiles, as demonstrated by Hyundai Mobis, showcases a significant development expanding the technology's practical applications. The integration of 3D capture and rendering technologies is further boosting the realism and overall utility of holographic projection solutions.
Report Scope & Segmentation Analysis
This report segments the holographic display market by end-user verticals:
Consumer Electronics: This segment is expected to witness significant growth driven by the increasing demand for AR/VR experiences and interactive devices. The market is projected to reach $XX Million by 2033. Competitive dynamics are shaped by a mix of established electronics manufacturers and emerging tech startups.
Retail: The retail sector is adopting holographic displays to enhance customer engagement and create immersive shopping experiences. Market size is projected to reach $XX Million by 2033. Key players are adapting existing technologies to improve customer experience.
Media and Entertainment: This is a dominant segment with strong growth potential. The market is projected to reach $XX Million by 2033. The segment is driven by increasing demand for immersive and interactive experiences.
Military and Defense: The adoption of holographic displays in military and defense applications is growing due to their potential to improve situational awareness and enhance training. The market is estimated to reach $XX Million by 2033.
Healthcare: Holographic displays are finding applications in medical training, surgical planning, and patient education. The market is projected to reach $XX Million by 2033.
Automotive: With the advent of transparent displays (as seen with Hyundai Mobis’s innovation), the automotive industry is embracing holographic technology for advanced driver-assistance systems and infotainment. The market is projected to reach $XX Million by 2033.
Other End-user Verticals: This segment includes various applications in education, museums, and other industries.
Key Drivers of Holographic Display Industry Growth
The holographic display industry's growth is driven by several factors: Technological advancements, leading to smaller, more efficient, and cost-effective displays. Increasing demand for immersive experiences across various sectors such as entertainment and retail, pushing the adoption of more advanced projection technology. Supportive government policies and investments in research and development, particularly in countries pushing for technological innovation. The integration of AI and machine learning to improve realism and interactivity, further driving market demand.
Challenges in the Holographic Display Industry Sector
The industry faces challenges such as high production costs, limiting widespread adoption. The complexity of holographic display technology leads to high manufacturing costs compared to traditional display technologies. A lack of standardization across the industry hinders interoperability and limits scalability, creating barriers to market expansion. Competition from alternative display technologies and the availability of substitutes limit market growth potential.
Emerging Opportunities in Holographic Display Industry
Emerging opportunities include the integration of holographic displays with 5G and IoT networks to enable remote collaborations and real-time interactive experiences. The utilization of holographic displays for enhanced training simulations in various fields such as aerospace and medicine. Expanding into new markets like education and smart cities offering new avenues for revenue generation. New materials and manufacturing techniques reducing the cost and improving the performance of holographic displays.
Leading Players in the Holographic Display Industry Market
- Musion Das Hologram Ltd
- Realview Imaging Ltd
- Animmersion UK Ltd
- Looking Glass Factory Inc
- Shenzhen SMX Display Technology Co Lt
- Kino-mo Limited (HYPERVSN)
- RealFiction Holding AB
- Provision Holding Inc
Key Developments in Holographic Display Industry Industry
January 2024: Hyundai Mobis unveils a transparent holographic display for next-generation vehicles, showcasing significant innovation in the automotive sector and demonstrating the practical application of the technology.
January 2024: ARHT Media Inc. partners with a global luxury retail brand to install holographic displays in multiple locations, highlighting the increasing adoption of holographic technology for retail applications and enhancing brand experiences.
Strategic Outlook for Holographic Display Industry Market
The holographic display market presents a significant growth opportunity, with substantial potential across diverse sectors. Continued technological advancements, decreasing costs, and rising demand for immersive experiences will fuel market expansion. Strategic partnerships and acquisitions will play a key role in shaping the competitive landscape. The focus on developing more compact, energy-efficient, and cost-effective holographic displays is pivotal for increasing market penetration and driving widespread adoption across various sectors.
Holographic Display Industry Segmentation
-
1. End-user Verticals
- 1.1. Consumer Electronics
- 1.2. Retail
- 1.3. Media and Entertainment
- 1.4. Military and Defense
- 1.5. Healthcare
- 1.6. Automotive
- 1.7. Other End-user Verticals
Holographic Display Industry Segmentation By Geography
- 1. North America
- 2. Europe
- 3. Asia
- 4. Australia and New Zealand
- 5. Latin America
- 6. Middle East and Africa
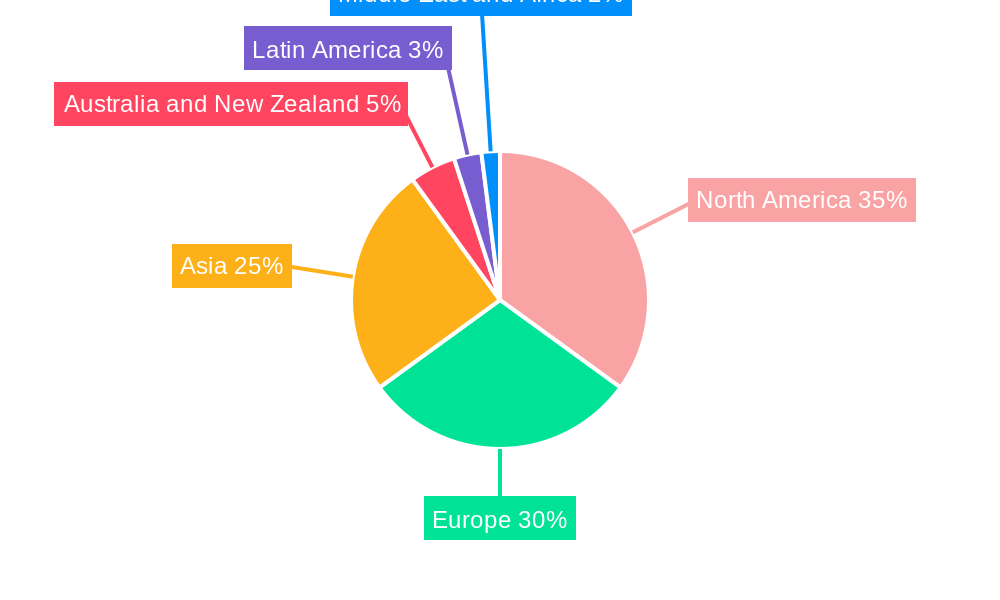
Holographic Display Industry Regional Market Share
Geographic Coverage of Holographic Display Industry
Holographic Display Industry REPORT HIGHLIGHTS
| Aspects | Details |
|---|---|
| Study Period | 2020-2034 |
| Base Year | 2025 |
| Estimated Year | 2026 |
| Forecast Period | 2026-2034 |
| Historical Period | 2020-2025 |
| Growth Rate | CAGR of 23.12% from 2020-2034 |
| Segmentation |
|
Table of Contents
- 1. Introduction
- 1.1. Research Scope
- 1.2. Market Segmentation
- 1.3. Research Methodology
- 1.4. Definitions and Assumptions
- 2. Executive Summary
- 2.1. Introduction
- 3. Market Dynamics
- 3.1. Introduction
- 3.2. Market Drivers
- 3.2.1. Increasing Investments in 3D Technology; Advancements in Screenless Displays
- 3.3. Market Restrains
- 3.3.1. High Cost of Assembling Holographic Display Devices; Presence of Substitute Display Products
- 3.4. Market Trends
- 3.4.1. Automotive Segment is Expected to Witness Significant Growth
- 4. Market Factor Analysis
- 4.1. Porters Five Forces
- 4.2. Supply/Value Chain
- 4.3. PESTEL analysis
- 4.4. Market Entropy
- 4.5. Patent/Trademark Analysis
- 5. Global Holographic Display Industry Analysis, Insights and Forecast, 2020-2032
- 5.1. Market Analysis, Insights and Forecast - by End-user Verticals
- 5.1.1. Consumer Electronics
- 5.1.2. Retail
- 5.1.3. Media and Entertainment
- 5.1.4. Military and Defense
- 5.1.5. Healthcare
- 5.1.6. Automotive
- 5.1.7. Other End-user Verticals
- 5.2. Market Analysis, Insights and Forecast - by Region
- 5.2.1. North America
- 5.2.2. Europe
- 5.2.3. Asia
- 5.2.4. Australia and New Zealand
- 5.2.5. Latin America
- 5.2.6. Middle East and Africa
- 5.1. Market Analysis, Insights and Forecast - by End-user Verticals
- 6. North America Holographic Display Industry Analysis, Insights and Forecast, 2020-2032
- 6.1. Market Analysis, Insights and Forecast - by End-user Verticals
- 6.1.1. Consumer Electronics
- 6.1.2. Retail
- 6.1.3. Media and Entertainment
- 6.1.4. Military and Defense
- 6.1.5. Healthcare
- 6.1.6. Automotive
- 6.1.7. Other End-user Verticals
- 6.1. Market Analysis, Insights and Forecast - by End-user Verticals
- 7. Europe Holographic Display Industry Analysis, Insights and Forecast, 2020-2032
- 7.1. Market Analysis, Insights and Forecast - by End-user Verticals
- 7.1.1. Consumer Electronics
- 7.1.2. Retail
- 7.1.3. Media and Entertainment
- 7.1.4. Military and Defense
- 7.1.5. Healthcare
- 7.1.6. Automotive
- 7.1.7. Other End-user Verticals
- 7.1. Market Analysis, Insights and Forecast - by End-user Verticals
- 8. Asia Holographic Display Industry Analysis, Insights and Forecast, 2020-2032
- 8.1. Market Analysis, Insights and Forecast - by End-user Verticals
- 8.1.1. Consumer Electronics
- 8.1.2. Retail
- 8.1.3. Media and Entertainment
- 8.1.4. Military and Defense
- 8.1.5. Healthcare
- 8.1.6. Automotive
- 8.1.7. Other End-user Verticals
- 8.1. Market Analysis, Insights and Forecast - by End-user Verticals
- 9. Australia and New Zealand Holographic Display Industry Analysis, Insights and Forecast, 2020-2032
- 9.1. Market Analysis, Insights and Forecast - by End-user Verticals
- 9.1.1. Consumer Electronics
- 9.1.2. Retail
- 9.1.3. Media and Entertainment
- 9.1.4. Military and Defense
- 9.1.5. Healthcare
- 9.1.6. Automotive
- 9.1.7. Other End-user Verticals
- 9.1. Market Analysis, Insights and Forecast - by End-user Verticals
- 10. Latin America Holographic Display Industry Analysis, Insights and Forecast, 2020-2032
- 10.1. Market Analysis, Insights and Forecast - by End-user Verticals
- 10.1.1. Consumer Electronics
- 10.1.2. Retail
- 10.1.3. Media and Entertainment
- 10.1.4. Military and Defense
- 10.1.5. Healthcare
- 10.1.6. Automotive
- 10.1.7. Other End-user Verticals
- 10.1. Market Analysis, Insights and Forecast - by End-user Verticals
- 11. Middle East and Africa Holographic Display Industry Analysis, Insights and Forecast, 2020-2032
- 11.1. Market Analysis, Insights and Forecast - by End-user Verticals
- 11.1.1. Consumer Electronics
- 11.1.2. Retail
- 11.1.3. Media and Entertainment
- 11.1.4. Military and Defense
- 11.1.5. Healthcare
- 11.1.6. Automotive
- 11.1.7. Other End-user Verticals
- 11.1. Market Analysis, Insights and Forecast - by End-user Verticals
- 12. Competitive Analysis
- 12.1. Global Market Share Analysis 2025
- 12.2. Company Profiles
- 12.2.1 Musion Das Hologram Ltd
- 12.2.1.1. Overview
- 12.2.1.2. Products
- 12.2.1.3. SWOT Analysis
- 12.2.1.4. Recent Developments
- 12.2.1.5. Financials (Based on Availability)
- 12.2.2 Realview Imaging Ltd
- 12.2.2.1. Overview
- 12.2.2.2. Products
- 12.2.2.3. SWOT Analysis
- 12.2.2.4. Recent Developments
- 12.2.2.5. Financials (Based on Availability)
- 12.2.3 Animmersion UK Ltd
- 12.2.3.1. Overview
- 12.2.3.2. Products
- 12.2.3.3. SWOT Analysis
- 12.2.3.4. Recent Developments
- 12.2.3.5. Financials (Based on Availability)
- 12.2.4 Looking Glass Factory Inc
- 12.2.4.1. Overview
- 12.2.4.2. Products
- 12.2.4.3. SWOT Analysis
- 12.2.4.4. Recent Developments
- 12.2.4.5. Financials (Based on Availability)
- 12.2.5 Shenzhen SMX Display Technology Co Lt
- 12.2.5.1. Overview
- 12.2.5.2. Products
- 12.2.5.3. SWOT Analysis
- 12.2.5.4. Recent Developments
- 12.2.5.5. Financials (Based on Availability)
- 12.2.6 Kino-mo Limited (HYPERVSN)
- 12.2.6.1. Overview
- 12.2.6.2. Products
- 12.2.6.3. SWOT Analysis
- 12.2.6.4. Recent Developments
- 12.2.6.5. Financials (Based on Availability)
- 12.2.7 RealFiction Holding AB
- 12.2.7.1. Overview
- 12.2.7.2. Products
- 12.2.7.3. SWOT Analysis
- 12.2.7.4. Recent Developments
- 12.2.7.5. Financials (Based on Availability)
- 12.2.8 Provision Holding Inc
- 12.2.8.1. Overview
- 12.2.8.2. Products
- 12.2.8.3. SWOT Analysis
- 12.2.8.4. Recent Developments
- 12.2.8.5. Financials (Based on Availability)
- 12.2.1 Musion Das Hologram Ltd
List of Figures
- Figure 1: Global Holographic Display Industry Revenue Breakdown (Million, %) by Region 2025 & 2033
- Figure 2: North America Holographic Display Industry Revenue (Million), by End-user Verticals 2025 & 2033
- Figure 3: North America Holographic Display Industry Revenue Share (%), by End-user Verticals 2025 & 2033
- Figure 4: North America Holographic Display Industry Revenue (Million), by Country 2025 & 2033
- Figure 5: North America Holographic Display Industry Revenue Share (%), by Country 2025 & 2033
- Figure 6: Europe Holographic Display Industry Revenue (Million), by End-user Verticals 2025 & 2033
- Figure 7: Europe Holographic Display Industry Revenue Share (%), by End-user Verticals 2025 & 2033
- Figure 8: Europe Holographic Display Industry Revenue (Million), by Country 2025 & 2033
- Figure 9: Europe Holographic Display Industry Revenue Share (%), by Country 2025 & 2033
- Figure 10: Asia Holographic Display Industry Revenue (Million), by End-user Verticals 2025 & 2033
- Figure 11: Asia Holographic Display Industry Revenue Share (%), by End-user Verticals 2025 & 2033
- Figure 12: Asia Holographic Display Industry Revenue (Million), by Country 2025 & 2033
- Figure 13: Asia Holographic Display Industry Revenue Share (%), by Country 2025 & 2033
- Figure 14: Australia and New Zealand Holographic Display Industry Revenue (Million), by End-user Verticals 2025 & 2033
- Figure 15: Australia and New Zealand Holographic Display Industry Revenue Share (%), by End-user Verticals 2025 & 2033
- Figure 16: Australia and New Zealand Holographic Display Industry Revenue (Million), by Country 2025 & 2033
- Figure 17: Australia and New Zealand Holographic Display Industry Revenue Share (%), by Country 2025 & 2033
- Figure 18: Latin America Holographic Display Industry Revenue (Million), by End-user Verticals 2025 & 2033
- Figure 19: Latin America Holographic Display Industry Revenue Share (%), by End-user Verticals 2025 & 2033
- Figure 20: Latin America Holographic Display Industry Revenue (Million), by Country 2025 & 2033
- Figure 21: Latin America Holographic Display Industry Revenue Share (%), by Country 2025 & 2033
- Figure 22: Middle East and Africa Holographic Display Industry Revenue (Million), by End-user Verticals 2025 & 2033
- Figure 23: Middle East and Africa Holographic Display Industry Revenue Share (%), by End-user Verticals 2025 & 2033
- Figure 24: Middle East and Africa Holographic Display Industry Revenue (Million), by Country 2025 & 2033
- Figure 25: Middle East and Africa Holographic Display Industry Revenue Share (%), by Country 2025 & 2033
List of Tables
- Table 1: Global Holographic Display Industry Revenue Million Forecast, by End-user Verticals 2020 & 2033
- Table 2: Global Holographic Display Industry Revenue Million Forecast, by Region 2020 & 2033
- Table 3: Global Holographic Display Industry Revenue Million Forecast, by End-user Verticals 2020 & 2033
- Table 4: Global Holographic Display Industry Revenue Million Forecast, by Country 2020 & 2033
- Table 5: Global Holographic Display Industry Revenue Million Forecast, by End-user Verticals 2020 & 2033
- Table 6: Global Holographic Display Industry Revenue Million Forecast, by Country 2020 & 2033
- Table 7: Global Holographic Display Industry Revenue Million Forecast, by End-user Verticals 2020 & 2033
- Table 8: Global Holographic Display Industry Revenue Million Forecast, by Country 2020 & 2033
- Table 9: Global Holographic Display Industry Revenue Million Forecast, by End-user Verticals 2020 & 2033
- Table 10: Global Holographic Display Industry Revenue Million Forecast, by Country 2020 & 2033
- Table 11: Global Holographic Display Industry Revenue Million Forecast, by End-user Verticals 2020 & 2033
- Table 12: Global Holographic Display Industry Revenue Million Forecast, by Country 2020 & 2033
- Table 13: Global Holographic Display Industry Revenue Million Forecast, by End-user Verticals 2020 & 2033
- Table 14: Global Holographic Display Industry Revenue Million Forecast, by Country 2020 & 2033
Frequently Asked Questions
1. What is the projected Compound Annual Growth Rate (CAGR) of the Holographic Display Industry?
The projected CAGR is approximately 23.12%.
2. Which companies are prominent players in the Holographic Display Industry?
Key companies in the market include Musion Das Hologram Ltd, Realview Imaging Ltd, Animmersion UK Ltd, Looking Glass Factory Inc, Shenzhen SMX Display Technology Co Lt, Kino-mo Limited (HYPERVSN), RealFiction Holding AB, Provision Holding Inc.
3. What are the main segments of the Holographic Display Industry?
The market segments include End-user Verticals.
4. Can you provide details about the market size?
The market size is estimated to be USD 3.45 Million as of 2022.
5. What are some drivers contributing to market growth?
Increasing Investments in 3D Technology; Advancements in Screenless Displays.
6. What are the notable trends driving market growth?
Automotive Segment is Expected to Witness Significant Growth.
7. Are there any restraints impacting market growth?
High Cost of Assembling Holographic Display Devices; Presence of Substitute Display Products.
8. Can you provide examples of recent developments in the market?
Jan 2024: Hyundai Mobis, Hyundai’s largest supplier, unveiled its latest EV tech. It uses the first transparent display screen using holographic tech. The company revealed its “innovative display series” for next-gen vehicles, which included the “world’s first rollable display and swivel display.” Hyundai Mobis presented a transparent display that uses holographic elements. The display appears on a transparent panel, making it easier for drivers to keep their eyes on the road.
9. What pricing options are available for accessing the report?
Pricing options include single-user, multi-user, and enterprise licenses priced at USD 4750, USD 5250, and USD 8750 respectively.
10. Is the market size provided in terms of value or volume?
The market size is provided in terms of value, measured in Million.
11. Are there any specific market keywords associated with the report?
Yes, the market keyword associated with the report is "Holographic Display Industry," which aids in identifying and referencing the specific market segment covered.
12. How do I determine which pricing option suits my needs best?
The pricing options vary based on user requirements and access needs. Individual users may opt for single-user licenses, while businesses requiring broader access may choose multi-user or enterprise licenses for cost-effective access to the report.
13. Are there any additional resources or data provided in the Holographic Display Industry report?
While the report offers comprehensive insights, it's advisable to review the specific contents or supplementary materials provided to ascertain if additional resources or data are available.
14. How can I stay updated on further developments or reports in the Holographic Display Industry?
To stay informed about further developments, trends, and reports in the Holographic Display Industry, consider subscribing to industry newsletters, following relevant companies and organizations, or regularly checking reputable industry news sources and publications.
Methodology
Step 1 - Identification of Relevant Samples Size from Population Database


Step 2 - Approaches for Defining Global Market Size (Value, Volume* & Price*)

Note*: In applicable scenarios
Step 3 - Data Sources
Primary Research
- Web Analytics
- Survey Reports
- Research Institute
- Latest Research Reports
- Opinion Leaders
Secondary Research
- Annual Reports
- White Paper
- Latest Press Release
- Industry Association
- Paid Database
- Investor Presentations

Step 4 - Data Triangulation
Involves using different sources of information in order to increase the validity of a study
These sources are likely to be stakeholders in a program - participants, other researchers, program staff, other community members, and so on.
Then we put all data in single framework & apply various statistical tools to find out the dynamic on the market.
During the analysis stage, feedback from the stakeholder groups would be compared to determine areas of agreement as well as areas of divergence