

Key Insights
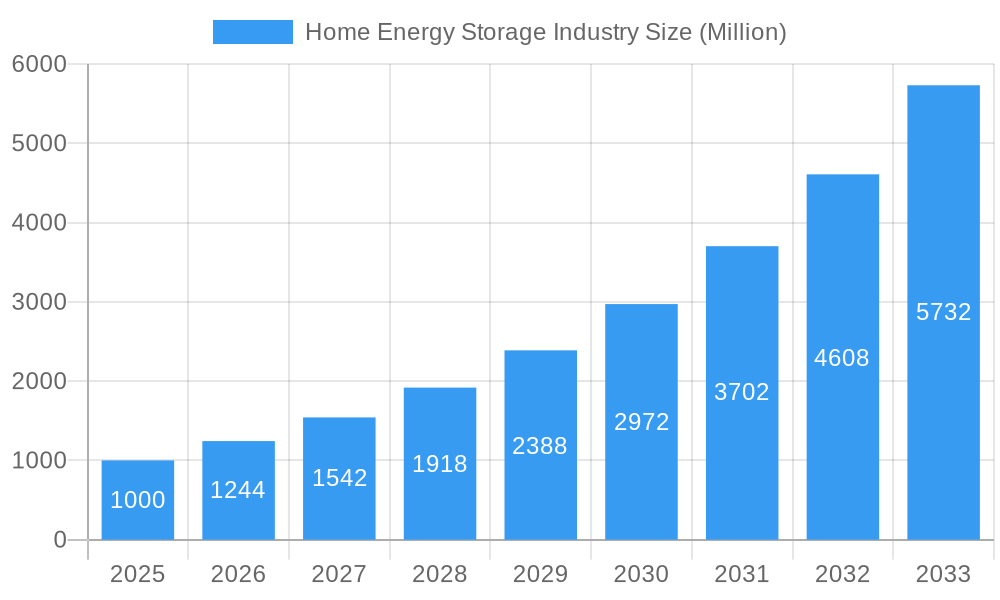
The global Home Energy Storage (HES) market is experiencing substantial expansion, driven by escalating electricity costs, heightened climate change concerns, and the widespread adoption of renewable energy sources like solar photovoltaics. The market, currently valued at $61.5 billion in the base year 2024, is forecast to grow at a Compound Annual Growth Rate (CAGR) of 18.3% during the projection period (2024-2033). Key growth drivers include the increasing installation of rooftop solar systems, which fuels demand for efficient HES solutions to optimize self-consumption and reduce grid dependency. Furthermore, government incentives and supportive policies promoting renewable energy and energy independence are significantly bolstering market growth. Technological innovations in battery chemistry and energy density are also enhancing cost-effectiveness and performance, making HES systems increasingly attractive to residential consumers.
Home Energy Storage Industry Market Size (In Billion)
Despite the positive trajectory, the HES market faces certain constraints. High upfront investment costs present a barrier for some potential adopters. Concerns regarding battery longevity, safety, and end-of-life management also influence adoption rates. Market growth exhibits regional disparities, with North America and Europe leading adoption, while other regions, particularly developing economies, experience slower uptake due to infrastructure limitations and economic factors. Nevertheless, the long-term outlook remains optimistic, supported by continuous technological advancements, favorable regulatory environments, and growing environmental awareness. Intensified competition among key players such as Hitachi Energy, Saft Groupe SA, Samsung SDI, LG Energy Solution, and Tesla is expected to accelerate innovation and price reductions, driving broader market penetration. Within technology segments, Lithium-ion batteries dominate due to their superior energy density and cycle life compared to lead-acid batteries, though "Other Technology Types" hold potential for future growth through ongoing research and development.
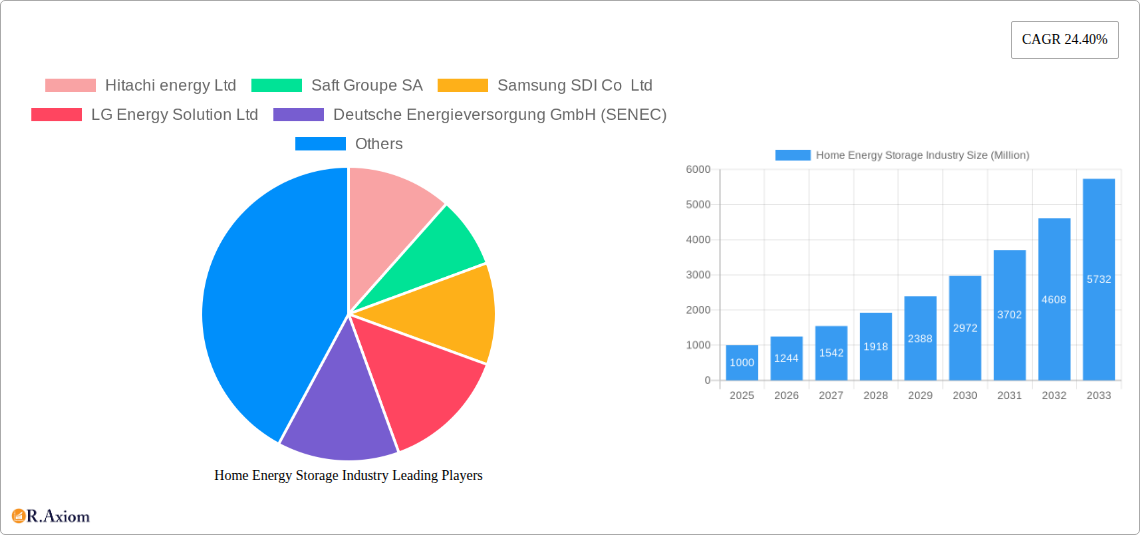
Home Energy Storage Industry Company Market Share
This comprehensive report analyzes the global Home Energy Storage industry, detailing market size, growth forecasts, competitive dynamics, technological progress, and critical trends from 2019 to 2033. The analysis covers historical data (2019-2024), the base year (2024), and the forecast period through 2033. This report is an indispensable resource for industry stakeholders, investors, and businesses seeking to understand and leverage opportunities in this dynamic sector. The market size was $61.5 billion in 2024 and is projected to reach substantial figures by 2033, driven by the aforementioned factors.
Home Energy Storage Industry Market Concentration & Innovation
The home energy storage industry is characterized by a moderately concentrated market with a few dominant players and a growing number of smaller, innovative companies. Market share is currently dominated by companies like Tesla Inc., LG Energy Solution Ltd., and Samsung SDI Co Ltd., each holding significant market share, though exact figures vary depending on the region and segment. However, the market is dynamic, with continuous mergers and acquisitions (M&A) activity reshaping the competitive landscape. M&A deal values have seen significant increases in recent years, with deals reaching xx Million in 2024.
Several factors drive innovation:
- Technological advancements: Continuous improvements in battery technology, specifically Lithium-ion, are lowering costs and improving performance.
- Stringent environmental regulations: Governments worldwide are implementing policies to promote renewable energy adoption, creating a favorable environment for home energy storage.
- Growing consumer demand: Rising electricity prices and increasing awareness of climate change are driving consumer adoption of home energy storage systems.
Product substitutes, while limited, include traditional backup generators, which are facing growing competition due to the rising cost of fossil fuels and their environmental impact. End-user trends indicate a shift toward smart home integration, with consumers seeking seamless connectivity and control over their energy systems.
Home Energy Storage Industry Industry Trends & Insights
The global home energy storage market is experiencing robust growth, driven by several key factors. The compound annual growth rate (CAGR) during the forecast period (2025-2033) is estimated to be xx%. This growth is fueled by several factors:
- Increasing electricity prices: Rising energy costs make home energy storage a more financially attractive proposition.
- Government incentives: Many countries offer subsidies and tax breaks to incentivize the adoption of renewable energy technologies, including home energy storage systems.
- Technological advancements: Improvements in battery technology are enhancing energy density, lifespan, and safety, driving down costs and expanding market appeal.
- Growing environmental awareness: Consumers are increasingly concerned about their carbon footprint, making sustainable energy solutions like home energy storage more desirable.
- Improved grid reliability: Home energy storage offers resilience against power outages, becoming increasingly important in regions with unreliable grids.
Market penetration remains relatively low compared to the total potential market, but rapid growth is anticipated, particularly in developed economies with strong government support. The competitive landscape is intensifying, with established players and new entrants vying for market share. This leads to price competition and increased innovation.
Dominant Markets & Segments in Home Energy Storage Industry
The North American and European markets are currently dominant in the home energy storage industry, driven by factors such as high electricity prices, supportive government policies, and a strong awareness of environmental sustainability. Within these regions, countries like the United States, Germany, and Australia are leading the charge.
- Key Drivers:
- Economic policies: Subsidies, tax credits, and feed-in tariffs incentivize adoption.
- Infrastructure development: Smart grid initiatives and supportive grid infrastructure facilitate seamless integration.
- Consumer awareness: Growing environmental awareness and concern about energy independence drive demand.
Technology Type Dominance:
Lithium-ion batteries currently dominate the market due to their high energy density, long lifespan, and relatively low cost compared to other options. Lead-acid batteries hold a smaller niche market, primarily in less demanding applications, while other technologies are still in the early stages of development. The dominance of Lithium-ion is expected to continue, although advancements in other technologies could shift market dynamics in the future.
Home Energy Storage Industry Product Developments
Recent product developments focus on increasing energy density, enhancing safety features, improving lifespan, and integrating smart home technology. Manufacturers are developing more compact and aesthetically pleasing systems that can seamlessly integrate with existing home infrastructure. Many systems incorporate advanced features like smart monitoring, remote control, and integration with renewable energy sources like solar PV. This focus on user-friendliness and enhanced capabilities expands market accessibility and appeal.
Report Scope & Segmentation Analysis
This report segments the home energy storage market based on technology type:
Lithium-ion Batteries: This segment is expected to experience significant growth, driven by its superior performance and decreasing costs. The market size is projected to be xx Million in 2025, expanding to xx Million by 2033. Competitive dynamics are intense, with numerous players vying for market share.
Lead-acid Batteries: This mature segment holds a smaller but stable market share, primarily serving less demanding applications. The market size is projected to be xx Million in 2025 and xx Million in 2033. Competition is relatively less intense in this segment.
Other Technology Types: This segment encompasses emerging technologies like flow batteries and solid-state batteries, which are still in the early stages of commercialization. Growth is expected to be significant but slower initially compared to Lithium-ion. The market size is estimated at xx Million in 2025, and xx Million in 2033.
Key Drivers of Home Energy Storage Industry Growth
Several factors propel the growth of the home energy storage industry:
- Technological advancements: Continuous improvements in battery technology lead to increased efficiency, reduced costs, and improved safety.
- Government support: Various government incentives, such as tax credits and subsidies, accelerate market adoption.
- Rising electricity prices and grid unreliability: Increased energy costs and frequent power outages drive the demand for reliable backup power.
- Increased environmental consciousness: Growing consumer awareness of climate change fuels interest in sustainable energy solutions.
Challenges in the Home Energy Storage Industry Sector
The home energy storage industry faces several challenges:
- High initial investment costs: The upfront cost of home energy storage systems can be a barrier to entry for some consumers.
- Battery lifespan and degradation: Battery performance degrades over time, requiring replacement, leading to increased long-term costs.
- Supply chain constraints: The availability of raw materials and components can impact production capacity and pricing.
- Regulatory hurdles and standardization: Lack of consistent regulations across different regions can create challenges for market expansion. These challenges could collectively impact the growth of the industry by approximately xx%.
Emerging Opportunities in Home Energy Storage Industry
Several emerging opportunities exist within the home energy storage industry:
- Integration with smart grids: Home energy storage systems can play a crucial role in stabilizing the electric grid and managing peak demand.
- Virtual power plants (VPPs): Aggregating numerous home energy storage systems can provide grid services and generate revenue for homeowners.
- Expansion into developing markets: Rapidly growing economies with increasing energy needs present significant untapped potential.
- New battery technologies: Advancements in battery technology will further reduce costs and improve performance, making home energy storage more accessible.
Leading Players in the Home Energy Storage Industry Market
- Hitachi Energy Ltd
- Saft Groupe SA
- Samsung SDI Co Ltd
- LG Energy Solution Ltd
- Deutsche Energieversorgung GmbH (SENEC)
- Sunverge Energy LLC
- Tesla Inc
- Sonnen GmbH
- Panasonic Corporation
Key Developments in Home Energy Storage Industry Industry
- May 2022: Mango Power launched the Mango Power M Series, a versatile home energy storage system compatible with solar PV, offering 10-20 kWh battery capacity and 8-14 kW output.
- June 2022: Toyota launched the O-Uchi Kyuden System, a residential battery storage system leveraging its EV battery technology, providing 5.5 kWh output and 8.7 kWh capacity.
Strategic Outlook for Home Energy Storage Industry Market
The future of the home energy storage industry is bright, driven by continued technological advancements, supportive government policies, and growing consumer demand. The market is poised for significant growth, with increased competition and innovation. Opportunities exist for companies to develop cost-effective, efficient, and user-friendly systems that cater to a widening range of consumer needs. The integration of home energy storage with smart grids and renewable energy sources will be key to unlocking the full potential of this rapidly expanding sector.
Home Energy Storage Industry Segmentation
-
1. Technology Type
- 1.1. Lithium-ion Batteries
- 1.2. Lead-acid Batteries
- 1.3. Other Technology Types
Home Energy Storage Industry Segmentation By Geography
- 1. North America
- 2. Asia Pacific
- 3. Europe
- 4. Middle East and Africa
- 5. South America
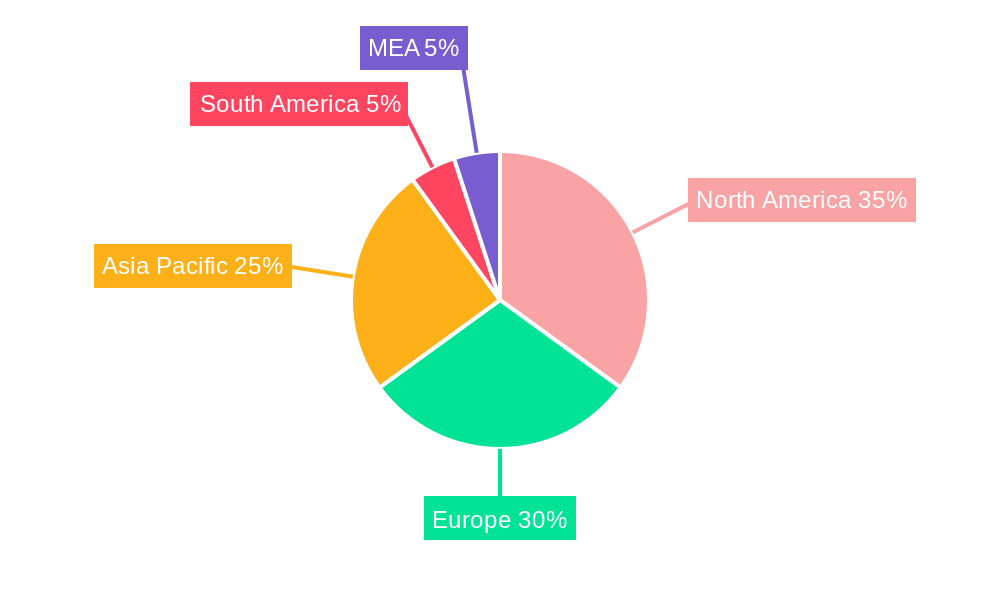
Home Energy Storage Industry Regional Market Share
Geographic Coverage of Home Energy Storage Industry
Home Energy Storage Industry REPORT HIGHLIGHTS
| Aspects | Details |
|---|---|
| Study Period | 2020-2034 |
| Base Year | 2025 |
| Estimated Year | 2026 |
| Forecast Period | 2026-2034 |
| Historical Period | 2020-2025 |
| Growth Rate | CAGR of 18.3% from 2020-2034 |
| Segmentation |
|
Table of Contents
- 1. Introduction
- 1.1. Research Scope
- 1.2. Market Segmentation
- 1.3. Research Objective
- 1.4. Definitions and Assumptions
- 2. Executive Summary
- 2.1. Market Snapshot
- 3. Market Dynamics
- 3.1. Market Drivers
- 3.2. Market Restrains
- 3.3. Market Trends
- 3.4. Market Opportunities
- 4. Market Factor Analysis
- 4.1. Porters Five Forces
- 4.1.1. Bargaining Power of Suppliers
- 4.1.2. Bargaining Power of Buyers
- 4.1.3. Threat of New Entrants
- 4.1.4. Threat of Substitutes
- 4.1.5. Competitive Rivalry
- 4.2. PESTEL analysis
- 4.3. BCG Analysis
- 4.3.1. Stars (High Growth, High Market Share)
- 4.3.2. Cash Cows (Low Growth, High Market Share)
- 4.3.3. Question Mark (High Growth, Low Market Share)
- 4.3.4. Dogs (Low Growth, Low Market Share)
- 4.4. Ansoff Matrix Analysis
- 4.5. Supply Chain Analysis
- 4.6. Regulatory Landscape
- 4.7. Current Market Potential and Opportunity Assessment (TAM–SAM–SOM Framework)
- 4.8. RAX Analyst Note
- 4.1. Porters Five Forces
- 5. Market Analysis, Insights and Forecast 2021-2033
- 5.1. Market Analysis, Insights and Forecast - by Technology Type
- 5.1.1. Lithium-ion Batteries
- 5.1.2. Lead-acid Batteries
- 5.1.3. Other Technology Types
- 5.2. Market Analysis, Insights and Forecast - by Region
- 5.2.1. North America
- 5.2.2. Asia Pacific
- 5.2.3. Europe
- 5.2.4. Middle East and Africa
- 5.2.5. South America
- 5.1. Market Analysis, Insights and Forecast - by Technology Type
- 6. Global Home Energy Storage Industry Analysis, Insights and Forecast, 2021-2033
- 6.1. Market Analysis, Insights and Forecast - by Technology Type
- 6.1.1. Lithium-ion Batteries
- 6.1.2. Lead-acid Batteries
- 6.1.3. Other Technology Types
- 6.1. Market Analysis, Insights and Forecast - by Technology Type
- 7. North America Home Energy Storage Industry Analysis, Insights and Forecast, 2020-2032
- 7.1. Market Analysis, Insights and Forecast - by Technology Type
- 7.1.1. Lithium-ion Batteries
- 7.1.2. Lead-acid Batteries
- 7.1.3. Other Technology Types
- 7.1. Market Analysis, Insights and Forecast - by Technology Type
- 8. Asia Pacific Home Energy Storage Industry Analysis, Insights and Forecast, 2020-2032
- 8.1. Market Analysis, Insights and Forecast - by Technology Type
- 8.1.1. Lithium-ion Batteries
- 8.1.2. Lead-acid Batteries
- 8.1.3. Other Technology Types
- 8.1. Market Analysis, Insights and Forecast - by Technology Type
- 9. Europe Home Energy Storage Industry Analysis, Insights and Forecast, 2020-2032
- 9.1. Market Analysis, Insights and Forecast - by Technology Type
- 9.1.1. Lithium-ion Batteries
- 9.1.2. Lead-acid Batteries
- 9.1.3. Other Technology Types
- 9.1. Market Analysis, Insights and Forecast - by Technology Type
- 10. Middle East and Africa Home Energy Storage Industry Analysis, Insights and Forecast, 2020-2032
- 10.1. Market Analysis, Insights and Forecast - by Technology Type
- 10.1.1. Lithium-ion Batteries
- 10.1.2. Lead-acid Batteries
- 10.1.3. Other Technology Types
- 10.1. Market Analysis, Insights and Forecast - by Technology Type
- 11. South America Home Energy Storage Industry Analysis, Insights and Forecast, 2020-2032
- 11.1. Market Analysis, Insights and Forecast - by Technology Type
- 11.1.1. Lithium-ion Batteries
- 11.1.2. Lead-acid Batteries
- 11.1.3. Other Technology Types
- 11.1. Market Analysis, Insights and Forecast - by Technology Type
- 12. Competitive Analysis
- 12.1. Company Profiles
- 12.1.1 Hitachi energy Ltd
- 12.1.1.1. Company Overview
- 12.1.1.2. Products
- 12.1.1.3. Company Financials
- 12.1.1.4. SWOT Analysis
- 12.1.2 Saft Groupe SA
- 12.1.2.1. Company Overview
- 12.1.2.2. Products
- 12.1.2.3. Company Financials
- 12.1.2.4. SWOT Analysis
- 12.1.3 Samsung SDI Co Ltd
- 12.1.3.1. Company Overview
- 12.1.3.2. Products
- 12.1.3.3. Company Financials
- 12.1.3.4. SWOT Analysis
- 12.1.4 LG Energy Solution Ltd
- 12.1.4.1. Company Overview
- 12.1.4.2. Products
- 12.1.4.3. Company Financials
- 12.1.4.4. SWOT Analysis
- 12.1.5 Deutsche Energieversorgung GmbH (SENEC)
- 12.1.5.1. Company Overview
- 12.1.5.2. Products
- 12.1.5.3. Company Financials
- 12.1.5.4. SWOT Analysis
- 12.1.6 Sunverge Energy LLC
- 12.1.6.1. Company Overview
- 12.1.6.2. Products
- 12.1.6.3. Company Financials
- 12.1.6.4. SWOT Analysis
- 12.1.7 Tesla Inc
- 12.1.7.1. Company Overview
- 12.1.7.2. Products
- 12.1.7.3. Company Financials
- 12.1.7.4. SWOT Analysis
- 12.1.8 Sonnen GmbH
- 12.1.8.1. Company Overview
- 12.1.8.2. Products
- 12.1.8.3. Company Financials
- 12.1.8.4. SWOT Analysis
- 12.1.9 Panasonic Corporation
- 12.1.9.1. Company Overview
- 12.1.9.2. Products
- 12.1.9.3. Company Financials
- 12.1.9.4. SWOT Analysis
- 12.1.1 Hitachi energy Ltd
- 12.2. Market Entropy
- 12.2.1 Company's Key Areas Served
- 12.2.2 Recent Developments
- 12.3. Company Market Share Analysis 2025
- 12.3.1 Top 5 Companies Market Share Analysis
- 12.3.2 Top 3 Companies Market Share Analysis
- 12.4. List of Potential Customers
- 13. Research Methodology
List of Figures
- Figure 1: Global Home Energy Storage Industry Revenue Breakdown (billion, %) by Region 2025 & 2033
- Figure 2: Global Home Energy Storage Industry Volume Breakdown (K Unit, %) by Region 2025 & 2033
- Figure 3: North America Home Energy Storage Industry Revenue (billion), by Technology Type 2025 & 2033
- Figure 4: North America Home Energy Storage Industry Volume (K Unit), by Technology Type 2025 & 2033
- Figure 5: North America Home Energy Storage Industry Revenue Share (%), by Technology Type 2025 & 2033
- Figure 6: North America Home Energy Storage Industry Volume Share (%), by Technology Type 2025 & 2033
- Figure 7: North America Home Energy Storage Industry Revenue (billion), by Country 2025 & 2033
- Figure 8: North America Home Energy Storage Industry Volume (K Unit), by Country 2025 & 2033
- Figure 9: North America Home Energy Storage Industry Revenue Share (%), by Country 2025 & 2033
- Figure 10: North America Home Energy Storage Industry Volume Share (%), by Country 2025 & 2033
- Figure 11: Asia Pacific Home Energy Storage Industry Revenue (billion), by Technology Type 2025 & 2033
- Figure 12: Asia Pacific Home Energy Storage Industry Volume (K Unit), by Technology Type 2025 & 2033
- Figure 13: Asia Pacific Home Energy Storage Industry Revenue Share (%), by Technology Type 2025 & 2033
- Figure 14: Asia Pacific Home Energy Storage Industry Volume Share (%), by Technology Type 2025 & 2033
- Figure 15: Asia Pacific Home Energy Storage Industry Revenue (billion), by Country 2025 & 2033
- Figure 16: Asia Pacific Home Energy Storage Industry Volume (K Unit), by Country 2025 & 2033
- Figure 17: Asia Pacific Home Energy Storage Industry Revenue Share (%), by Country 2025 & 2033
- Figure 18: Asia Pacific Home Energy Storage Industry Volume Share (%), by Country 2025 & 2033
- Figure 19: Europe Home Energy Storage Industry Revenue (billion), by Technology Type 2025 & 2033
- Figure 20: Europe Home Energy Storage Industry Volume (K Unit), by Technology Type 2025 & 2033
- Figure 21: Europe Home Energy Storage Industry Revenue Share (%), by Technology Type 2025 & 2033
- Figure 22: Europe Home Energy Storage Industry Volume Share (%), by Technology Type 2025 & 2033
- Figure 23: Europe Home Energy Storage Industry Revenue (billion), by Country 2025 & 2033
- Figure 24: Europe Home Energy Storage Industry Volume (K Unit), by Country 2025 & 2033
- Figure 25: Europe Home Energy Storage Industry Revenue Share (%), by Country 2025 & 2033
- Figure 26: Europe Home Energy Storage Industry Volume Share (%), by Country 2025 & 2033
- Figure 27: Middle East and Africa Home Energy Storage Industry Revenue (billion), by Technology Type 2025 & 2033
- Figure 28: Middle East and Africa Home Energy Storage Industry Volume (K Unit), by Technology Type 2025 & 2033
- Figure 29: Middle East and Africa Home Energy Storage Industry Revenue Share (%), by Technology Type 2025 & 2033
- Figure 30: Middle East and Africa Home Energy Storage Industry Volume Share (%), by Technology Type 2025 & 2033
- Figure 31: Middle East and Africa Home Energy Storage Industry Revenue (billion), by Country 2025 & 2033
- Figure 32: Middle East and Africa Home Energy Storage Industry Volume (K Unit), by Country 2025 & 2033
- Figure 33: Middle East and Africa Home Energy Storage Industry Revenue Share (%), by Country 2025 & 2033
- Figure 34: Middle East and Africa Home Energy Storage Industry Volume Share (%), by Country 2025 & 2033
- Figure 35: South America Home Energy Storage Industry Revenue (billion), by Technology Type 2025 & 2033
- Figure 36: South America Home Energy Storage Industry Volume (K Unit), by Technology Type 2025 & 2033
- Figure 37: South America Home Energy Storage Industry Revenue Share (%), by Technology Type 2025 & 2033
- Figure 38: South America Home Energy Storage Industry Volume Share (%), by Technology Type 2025 & 2033
- Figure 39: South America Home Energy Storage Industry Revenue (billion), by Country 2025 & 2033
- Figure 40: South America Home Energy Storage Industry Volume (K Unit), by Country 2025 & 2033
- Figure 41: South America Home Energy Storage Industry Revenue Share (%), by Country 2025 & 2033
- Figure 42: South America Home Energy Storage Industry Volume Share (%), by Country 2025 & 2033
List of Tables
- Table 1: Global Home Energy Storage Industry Revenue billion Forecast, by Technology Type 2020 & 2033
- Table 2: Global Home Energy Storage Industry Volume K Unit Forecast, by Technology Type 2020 & 2033
- Table 3: Global Home Energy Storage Industry Revenue billion Forecast, by Region 2020 & 2033
- Table 4: Global Home Energy Storage Industry Volume K Unit Forecast, by Region 2020 & 2033
- Table 5: Global Home Energy Storage Industry Revenue billion Forecast, by Technology Type 2020 & 2033
- Table 6: Global Home Energy Storage Industry Volume K Unit Forecast, by Technology Type 2020 & 2033
- Table 7: Global Home Energy Storage Industry Revenue billion Forecast, by Country 2020 & 2033
- Table 8: Global Home Energy Storage Industry Volume K Unit Forecast, by Country 2020 & 2033
- Table 9: Global Home Energy Storage Industry Revenue billion Forecast, by Technology Type 2020 & 2033
- Table 10: Global Home Energy Storage Industry Volume K Unit Forecast, by Technology Type 2020 & 2033
- Table 11: Global Home Energy Storage Industry Revenue billion Forecast, by Country 2020 & 2033
- Table 12: Global Home Energy Storage Industry Volume K Unit Forecast, by Country 2020 & 2033
- Table 13: Global Home Energy Storage Industry Revenue billion Forecast, by Technology Type 2020 & 2033
- Table 14: Global Home Energy Storage Industry Volume K Unit Forecast, by Technology Type 2020 & 2033
- Table 15: Global Home Energy Storage Industry Revenue billion Forecast, by Country 2020 & 2033
- Table 16: Global Home Energy Storage Industry Volume K Unit Forecast, by Country 2020 & 2033
- Table 17: Global Home Energy Storage Industry Revenue billion Forecast, by Technology Type 2020 & 2033
- Table 18: Global Home Energy Storage Industry Volume K Unit Forecast, by Technology Type 2020 & 2033
- Table 19: Global Home Energy Storage Industry Revenue billion Forecast, by Country 2020 & 2033
- Table 20: Global Home Energy Storage Industry Volume K Unit Forecast, by Country 2020 & 2033
- Table 21: Global Home Energy Storage Industry Revenue billion Forecast, by Technology Type 2020 & 2033
- Table 22: Global Home Energy Storage Industry Volume K Unit Forecast, by Technology Type 2020 & 2033
- Table 23: Global Home Energy Storage Industry Revenue billion Forecast, by Country 2020 & 2033
- Table 24: Global Home Energy Storage Industry Volume K Unit Forecast, by Country 2020 & 2033
Frequently Asked Questions
1. What is the projected Compound Annual Growth Rate (CAGR) of the Home Energy Storage Industry?
The projected CAGR is approximately 18.3%.
2. Which companies are prominent players in the Home Energy Storage Industry?
Key companies in the market include Hitachi energy Ltd, Saft Groupe SA, Samsung SDI Co Ltd, LG Energy Solution Ltd, Deutsche Energieversorgung GmbH (SENEC), Sunverge Energy LLC, Tesla Inc, Sonnen GmbH, Panasonic Corporation.
3. What are the main segments of the Home Energy Storage Industry?
The market segments include Technology Type.
4. Can you provide details about the market size?
The market size is estimated to be USD 61.5 billion as of 2022.
5. What are some drivers contributing to market growth?
4.; Increasing Investments in Offshore Oil and Gas Projects.
6. What are the notable trends driving market growth?
Lithium-Ion Battery Technology to Dominate the Market.
7. Are there any restraints impacting market growth?
4.; Increasing Penetration of Renewable Energy.
8. Can you provide examples of recent developments in the market?
In May 2022, Mango Power launched Mango Power M Series at the Intersolar Munich 2022. The system can be used with a solar PV, with a 10-20 kWh battery for daily and emergency use. The system supports single and triple-phase connections with 8-14 kW output capability. The system can be used in various applications, including a built-in inverter, backup gateway, and EV charger. The company launched different versions for the United States and Europe markets.
9. What pricing options are available for accessing the report?
Pricing options include single-user, multi-user, and enterprise licenses priced at USD 4750, USD 5250, and USD 8750 respectively.
10. Is the market size provided in terms of value or volume?
The market size is provided in terms of value, measured in billion and volume, measured in K Unit.
11. Are there any specific market keywords associated with the report?
Yes, the market keyword associated with the report is "Home Energy Storage Industry," which aids in identifying and referencing the specific market segment covered.
12. How do I determine which pricing option suits my needs best?
The pricing options vary based on user requirements and access needs. Individual users may opt for single-user licenses, while businesses requiring broader access may choose multi-user or enterprise licenses for cost-effective access to the report.
13. Are there any additional resources or data provided in the Home Energy Storage Industry report?
While the report offers comprehensive insights, it's advisable to review the specific contents or supplementary materials provided to ascertain if additional resources or data are available.
14. How can I stay updated on further developments or reports in the Home Energy Storage Industry?
To stay informed about further developments, trends, and reports in the Home Energy Storage Industry, consider subscribing to industry newsletters, following relevant companies and organizations, or regularly checking reputable industry news sources and publications.
Methodology
Step 1 - Identification of Relevant Samples Size from Population Database


Step 2 - Approaches for Defining Global Market Size (Value, Volume* & Price*)

Note*: In applicable scenarios
Step 3 - Data Sources
Primary Research
- Web Analytics
- Survey Reports
- Research Institute
- Latest Research Reports
- Opinion Leaders
Secondary Research
- Annual Reports
- White Paper
- Latest Press Release
- Industry Association
- Paid Database
- Investor Presentations

Step 4 - Data Triangulation
Involves using different sources of information in order to increase the validity of a study
These sources are likely to be stakeholders in a program - participants, other researchers, program staff, other community members, and so on.
Then we put all data in single framework & apply various statistical tools to find out the dynamic on the market.
During the analysis stage, feedback from the stakeholder groups would be compared to determine areas of agreement as well as areas of divergence