
Key Insights
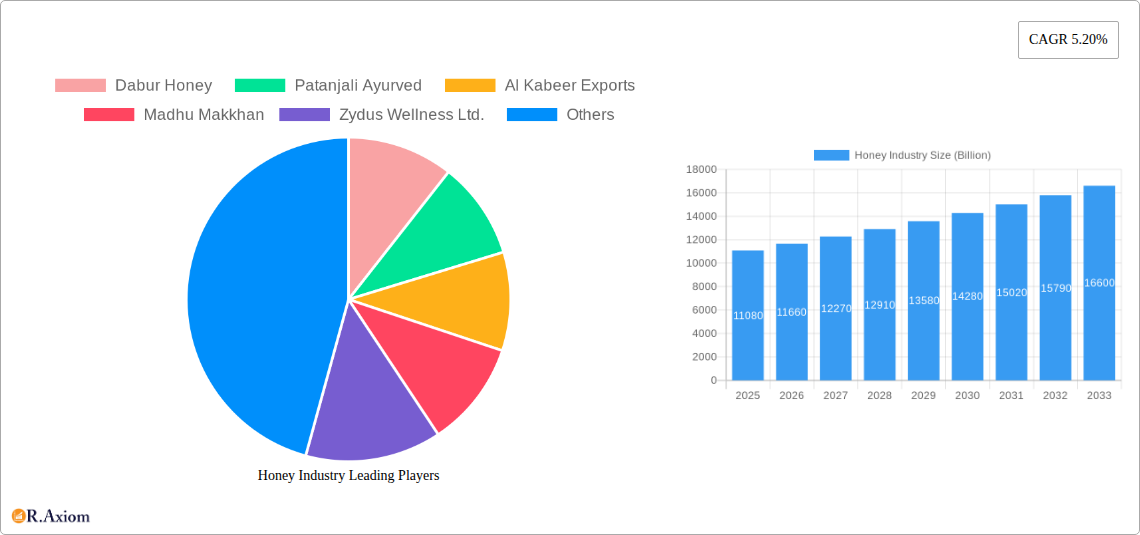
The global honey market, valued at $11.08 billion in 2025, is projected to experience robust growth, exhibiting a compound annual growth rate (CAGR) of 5.20% from 2025 to 2033. Several factors contribute to this positive outlook. Rising consumer awareness of honey's health benefits, including its antioxidant and antimicrobial properties, fuels demand for both raw and specialized honey varieties like Manuka honey. The increasing prevalence of health-conscious lifestyles and the growing preference for natural sweeteners over refined sugar further bolster market expansion. E-commerce platforms and online retail channels are playing a significant role in market accessibility and growth, alongside traditional retail outlets. Furthermore, the diversification of honey products through flavored varieties and the utilization of honey in food manufacturing and pharmaceutical applications are key drivers of market expansion. The burgeoning organic food sector also presents a lucrative opportunity for honey producers, further stimulating market growth. Geographic variations in honey production and consumption patterns will influence regional market shares; North America and Europe are expected to maintain substantial market positions due to established consumer preferences and robust retail networks, while Asia-Pacific is projected to show significant growth based on rising disposable incomes and increasing demand.
However, the honey market faces challenges. Fluctuations in honey production due to factors like climate change and bee colony health pose risks to supply chain stability and pricing. Counterfeit honey and adulteration remain significant concerns affecting consumer trust and impacting market growth. Stricter regulations and quality control measures are necessary to ensure the authenticity and safety of honey products. Moreover, competition from other sweeteners and price sensitivity among consumers in certain market segments present potential restraints. The industry's sustainability concerns, including the impact of beekeeping practices on the environment, need to be addressed proactively through sustainable farming and responsible harvesting techniques. Despite these challenges, the honey market’s positive growth trajectory is expected to continue, driven by increasing consumer demand and ongoing product innovation.
Honey Industry: A Comprehensive Market Report (2019-2033)
This detailed report provides a comprehensive analysis of the global honey industry, projecting a market size exceeding $XX Billion by 2033. It delves into market dynamics, competitive landscapes, and future growth potential, offering valuable insights for industry stakeholders, investors, and businesses. The study period covers 2019-2033, with 2025 as the base and estimated year. The report utilizes a robust methodology, incorporating both historical data (2019-2024) and future projections (2025-2033).
Honey Industry Market Concentration & Innovation
The global honey market exhibits a moderately concentrated structure, with a few major players commanding significant market share. Dabur Honey, Patanjali Ayurved, and Al Kabeer Exports are among the leading companies, collectively accounting for an estimated xx% of the market in 2025. However, the presence of numerous smaller regional and local producers contributes to a competitive landscape.
Innovation in the honey industry centers around product diversification, including flavored honey, organic honey, and Manuka honey, catering to evolving consumer preferences. Technological advancements in beekeeping practices and honey processing enhance efficiency and product quality. Regulatory frameworks related to food safety and labeling play a significant role, influencing market dynamics. The industry is witnessing increased M&A activity, with deal values reaching $XX Billion in recent years, driven by the desire for market consolidation and expansion. Product substitutes, such as artificial sweeteners, pose a challenge, but the growing awareness of honey's health benefits continues to support market growth. End-user trends indicate increasing demand from the household sector, coupled with growing applications in the food manufacturing and pharmaceutical industries.
Honey Industry Industry Trends & Insights
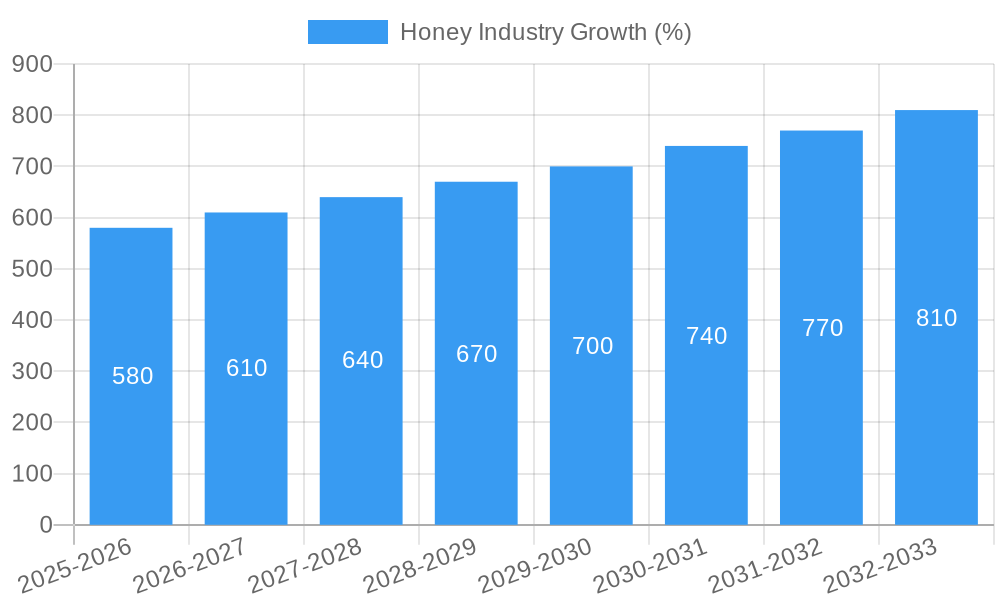
The honey industry is experiencing robust growth, driven by rising consumer demand for natural sweeteners and health-conscious products. The market exhibits a Compound Annual Growth Rate (CAGR) of xx% during the forecast period (2025-2033). Increased awareness of honey's nutritional and therapeutic benefits fuels this growth. Technological advancements in beekeeping, such as improved hive management techniques and disease control methods, enhance honey production efficiency. Changing consumer preferences towards organic and sustainably sourced food products drive demand for organic honey and Manuka honey, leading to premium pricing and higher margins. Competitive dynamics are characterized by both established players expanding their product lines and the emergence of new players, particularly in the organic and specialty honey segments. The market penetration of online retail channels continues to grow, offering new opportunities for honey producers.
Dominant Markets & Segments in Honey Industry
- Leading Region: Asia-Pacific region is projected to dominate the market in 2025, driven by high honey consumption and production in countries like India and China. North America and Europe also hold significant market shares.
- Dominant Type: Raw honey retains the largest market share, followed by filtered honey. The demand for organic honey and Manuka honey is rapidly increasing, fueled by premium pricing and health benefits.
- Primary Distribution Channel: Retail channels dominate distribution. However, online sales are growing rapidly, offering direct access to consumers and expanding market reach.
- Largest End-User: Households remain the largest end-user segment, with consistent and expanding demand for honey as a natural sweetener and food ingredient. The food manufacturing and pharmaceutical industries also represent significant consumer segments.
The dominance of these segments is driven by several factors, including favorable economic policies promoting beekeeping, well-established infrastructure supporting efficient honey production and distribution networks, and established consumer preferences in these regions and segments.
Honey Industry Product Developments
Recent product innovations include the introduction of honey-based functional foods and beverages, incorporating honey into cosmetics and personal care products, and the development of value-added honey products like honey-infused teas and spreads. These innovations cater to specific consumer preferences and tap into new market segments, providing manufacturers with competitive advantages.
Report Scope & Segmentation Analysis
The report segments the honey market by type (Raw honey, filtered honey, flavored honey, organic honey, Manuka honey), distribution channel (Retail, online, bulk), and end-user (Household, food manufacturers, pharmaceutical industry). Each segment is analyzed in detail, providing projections for market size and growth, highlighting competitive dynamics, and identifying key market drivers and challenges.
- By Type: The organic honey segment is expected to show the fastest growth due to increasing health consciousness.
- By Distribution Channel: Online sales are projected to experience significant growth due to increasing e-commerce penetration.
- By End-User: The food manufacturing sector is expected to witness substantial growth, driven by the incorporation of honey into various processed foods.
Key Drivers of Honey Industry Growth
The key growth drivers include increasing consumer awareness of honey's health benefits, rising demand for natural sweeteners, growing adoption of beekeeping practices, and government initiatives supporting the honey industry. Technological advancements in beekeeping, improved honey processing techniques, and increasing health consciousness are contributing to market expansion.
Challenges in the Honey Industry Sector
Challenges include fluctuating honey production due to weather conditions, the threat of honey bee diseases, and the competition from artificial sweeteners. Supply chain disruptions and regulatory hurdles related to honey authenticity and labeling also pose significant challenges. These factors negatively impact profitability and market growth.
Emerging Opportunities in Honey Industry
Emerging opportunities include expanding into new geographical markets, developing innovative honey-based products, and tapping into the growing demand for organic and specialty honeys. The application of honey in cosmetics and pharmaceuticals also presents exciting opportunities for growth.
Leading Players in the Honey Industry Market
- Dabur Honey
- Patanjali Ayurved
- Al Kabeer Exports
- Madhu Makkhan
- Zydus Wellness Ltd.
Key Developments in Honey Industry Industry
- August 2022: APEDA's launch of a project under AtmaNirbhar Bharat, allocating INR 500 crore (USD 60.5 million) for the NBHM, significantly boosted honey production and encouraged farmer participation.
- May 2024: The Canadian government's increased funding of USD 1 million to the Honey Bee Health Initiative enhanced beekeeper resilience and competitiveness, positively impacting honey production in Ontario.
Strategic Outlook for Honey Industry Market
The honey industry is poised for continued growth, driven by strong consumer demand, technological advancements, and supportive government policies. Exploiting emerging market segments, embracing innovation, and ensuring sustainable beekeeping practices will be key to maximizing future market potential. The market is projected to surpass $XX Billion by 2033, offering significant opportunities for established players and new entrants alike.
Honey Industry Segmentation
- 1. Production Analysis
- 2. Consumption Analysis
- 3. Import Market Analysis (Value & Volume)
- 4. Export Market Analysis (Value & Volume)
- 5. Price Trend Analysis
Honey Industry Segmentation By Geography
-
1. North America
- 1.1. United States
- 1.2. Canada
- 1.3. Mexico
-
2. Europe
- 2.1. Spain
- 2.2. Ukraine
- 2.3. Poland
- 2.4. Germany
-
3. Asia Pacific
- 3.1. China
- 3.2. India
- 3.3. Japan
- 3.4. New Zealand
-
4. South America
- 4.1. Argentina
- 4.2. Brazil
-
5. Middle East and Africa
- 5.1. Turkey
- 5.2. Iran

Honey Industry REPORT HIGHLIGHTS
| Aspects | Details |
|---|---|
| Study Period | 2019-2033 |
| Base Year | 2024 |
| Estimated Year | 2025 |
| Forecast Period | 2025-2033 |
| Historical Period | 2019-2024 |
| Growth Rate | CAGR of 5.20% from 2019-2033 |
| Segmentation |
|
Table of Contents
- 1. Introduction
- 1.1. Research Scope
- 1.2. Market Segmentation
- 1.3. Research Methodology
- 1.4. Definitions and Assumptions
- 2. Executive Summary
- 2.1. Introduction
- 3. Market Dynamics
- 3.1. Introduction
- 3.2. Market Drivers
- 3.2.1. Increasing Demand for Garlic Due to Various Uses in Industries; Rising Demad of Organic Garlic; Increasing Government Initiatives
- 3.3. Market Restrains
- 3.3.1. Lack of Technical Knowledge of Farmers; Price Fluctuations
- 3.4. Market Trends
- 3.4.1. Increasing Demand for Natural Sweeteners with Health Benefits of Natural Honey
- 4. Market Factor Analysis
- 4.1. Porters Five Forces
- 4.2. Supply/Value Chain
- 4.3. PESTEL analysis
- 4.4. Market Entropy
- 4.5. Patent/Trademark Analysis
- 5. Global Honey Industry Analysis, Insights and Forecast, 2019-2031
- 5.1. Market Analysis, Insights and Forecast - by Production Analysis
- 5.2. Market Analysis, Insights and Forecast - by Consumption Analysis
- 5.3. Market Analysis, Insights and Forecast - by Import Market Analysis (Value & Volume)
- 5.4. Market Analysis, Insights and Forecast - by Export Market Analysis (Value & Volume)
- 5.5. Market Analysis, Insights and Forecast - by Price Trend Analysis
- 5.6. Market Analysis, Insights and Forecast - by Region
- 5.6.1. North America
- 5.6.2. Europe
- 5.6.3. Asia Pacific
- 5.6.4. South America
- 5.6.5. Middle East and Africa
- 5.1. Market Analysis, Insights and Forecast - by Production Analysis
- 6. North America Honey Industry Analysis, Insights and Forecast, 2019-2031
- 6.1. Market Analysis, Insights and Forecast - by Production Analysis
- 6.2. Market Analysis, Insights and Forecast - by Consumption Analysis
- 6.3. Market Analysis, Insights and Forecast - by Import Market Analysis (Value & Volume)
- 6.4. Market Analysis, Insights and Forecast - by Export Market Analysis (Value & Volume)
- 6.5. Market Analysis, Insights and Forecast - by Price Trend Analysis
- 6.1. Market Analysis, Insights and Forecast - by Production Analysis
- 7. Europe Honey Industry Analysis, Insights and Forecast, 2019-2031
- 7.1. Market Analysis, Insights and Forecast - by Production Analysis
- 7.2. Market Analysis, Insights and Forecast - by Consumption Analysis
- 7.3. Market Analysis, Insights and Forecast - by Import Market Analysis (Value & Volume)
- 7.4. Market Analysis, Insights and Forecast - by Export Market Analysis (Value & Volume)
- 7.5. Market Analysis, Insights and Forecast - by Price Trend Analysis
- 7.1. Market Analysis, Insights and Forecast - by Production Analysis
- 8. Asia Pacific Honey Industry Analysis, Insights and Forecast, 2019-2031
- 8.1. Market Analysis, Insights and Forecast - by Production Analysis
- 8.2. Market Analysis, Insights and Forecast - by Consumption Analysis
- 8.3. Market Analysis, Insights and Forecast - by Import Market Analysis (Value & Volume)
- 8.4. Market Analysis, Insights and Forecast - by Export Market Analysis (Value & Volume)
- 8.5. Market Analysis, Insights and Forecast - by Price Trend Analysis
- 8.1. Market Analysis, Insights and Forecast - by Production Analysis
- 9. South America Honey Industry Analysis, Insights and Forecast, 2019-2031
- 9.1. Market Analysis, Insights and Forecast - by Production Analysis
- 9.2. Market Analysis, Insights and Forecast - by Consumption Analysis
- 9.3. Market Analysis, Insights and Forecast - by Import Market Analysis (Value & Volume)
- 9.4. Market Analysis, Insights and Forecast - by Export Market Analysis (Value & Volume)
- 9.5. Market Analysis, Insights and Forecast - by Price Trend Analysis
- 9.1. Market Analysis, Insights and Forecast - by Production Analysis
- 10. Middle East and Africa Honey Industry Analysis, Insights and Forecast, 2019-2031
- 10.1. Market Analysis, Insights and Forecast - by Production Analysis
- 10.2. Market Analysis, Insights and Forecast - by Consumption Analysis
- 10.3. Market Analysis, Insights and Forecast - by Import Market Analysis (Value & Volume)
- 10.4. Market Analysis, Insights and Forecast - by Export Market Analysis (Value & Volume)
- 10.5. Market Analysis, Insights and Forecast - by Price Trend Analysis
- 10.1. Market Analysis, Insights and Forecast - by Production Analysis
- 11. North America Honey Industry Analysis, Insights and Forecast, 2019-2031
- 11.1. Market Analysis, Insights and Forecast - By Country/Sub-region
- 11.1.1 United States
- 11.1.2 Canada
- 11.1.3 Mexico
- 12. Europe Honey Industry Analysis, Insights and Forecast, 2019-2031
- 12.1. Market Analysis, Insights and Forecast - By Country/Sub-region
- 12.1.1 Germany
- 12.1.2 United Kingdom
- 12.1.3 France
- 12.1.4 Spain
- 12.1.5 Italy
- 12.1.6 Spain
- 12.1.7 Belgium
- 12.1.8 Netherland
- 12.1.9 Nordics
- 12.1.10 Rest of Europe
- 13. Asia Pacific Honey Industry Analysis, Insights and Forecast, 2019-2031
- 13.1. Market Analysis, Insights and Forecast - By Country/Sub-region
- 13.1.1 China
- 13.1.2 Japan
- 13.1.3 India
- 13.1.4 South Korea
- 13.1.5 Southeast Asia
- 13.1.6 Australia
- 13.1.7 Indonesia
- 13.1.8 Phillipes
- 13.1.9 Singapore
- 13.1.10 Thailandc
- 13.1.11 Rest of Asia Pacific
- 14. South America Honey Industry Analysis, Insights and Forecast, 2019-2031
- 14.1. Market Analysis, Insights and Forecast - By Country/Sub-region
- 14.1.1 Brazil
- 14.1.2 Argentina
- 14.1.3 Peru
- 14.1.4 Chile
- 14.1.5 Colombia
- 14.1.6 Ecuador
- 14.1.7 Venezuela
- 14.1.8 Rest of South America
- 15. MEA Honey Industry Analysis, Insights and Forecast, 2019-2031
- 15.1. Market Analysis, Insights and Forecast - By Country/Sub-region
- 15.1.1 United Arab Emirates
- 15.1.2 Saudi Arabia
- 15.1.3 South Africa
- 15.1.4 Rest of Middle East and Africa
- 16. Competitive Analysis
- 16.1. Global Market Share Analysis 2024
- 16.2. Company Profiles
- 16.2.1 Dabur Honey
- 16.2.1.1. Overview
- 16.2.1.2. Products
- 16.2.1.3. SWOT Analysis
- 16.2.1.4. Recent Developments
- 16.2.1.5. Financials (Based on Availability)
- 16.2.2 Patanjali Ayurved
- 16.2.2.1. Overview
- 16.2.2.2. Products
- 16.2.2.3. SWOT Analysis
- 16.2.2.4. Recent Developments
- 16.2.2.5. Financials (Based on Availability)
- 16.2.3 Al Kabeer Exports
- 16.2.3.1. Overview
- 16.2.3.2. Products
- 16.2.3.3. SWOT Analysis
- 16.2.3.4. Recent Developments
- 16.2.3.5. Financials (Based on Availability)
- 16.2.4 Madhu Makkhan
- 16.2.4.1. Overview
- 16.2.4.2. Products
- 16.2.4.3. SWOT Analysis
- 16.2.4.4. Recent Developments
- 16.2.4.5. Financials (Based on Availability)
- 16.2.5 Zydus Wellness Ltd.
- 16.2.5.1. Overview
- 16.2.5.2. Products
- 16.2.5.3. SWOT Analysis
- 16.2.5.4. Recent Developments
- 16.2.5.5. Financials (Based on Availability)
- 16.2.1 Dabur Honey
List of Figures
- Figure 1: Global Honey Industry Revenue Breakdown (Billion, %) by Region 2024 & 2032
- Figure 2: North America Honey Industry Revenue (Billion), by Country 2024 & 2032
- Figure 3: North America Honey Industry Revenue Share (%), by Country 2024 & 2032
- Figure 4: Europe Honey Industry Revenue (Billion), by Country 2024 & 2032
- Figure 5: Europe Honey Industry Revenue Share (%), by Country 2024 & 2032
- Figure 6: Asia Pacific Honey Industry Revenue (Billion), by Country 2024 & 2032
- Figure 7: Asia Pacific Honey Industry Revenue Share (%), by Country 2024 & 2032
- Figure 8: South America Honey Industry Revenue (Billion), by Country 2024 & 2032
- Figure 9: South America Honey Industry Revenue Share (%), by Country 2024 & 2032
- Figure 10: MEA Honey Industry Revenue (Billion), by Country 2024 & 2032
- Figure 11: MEA Honey Industry Revenue Share (%), by Country 2024 & 2032
- Figure 12: North America Honey Industry Revenue (Billion), by Production Analysis 2024 & 2032
- Figure 13: North America Honey Industry Revenue Share (%), by Production Analysis 2024 & 2032
- Figure 14: North America Honey Industry Revenue (Billion), by Consumption Analysis 2024 & 2032
- Figure 15: North America Honey Industry Revenue Share (%), by Consumption Analysis 2024 & 2032
- Figure 16: North America Honey Industry Revenue (Billion), by Import Market Analysis (Value & Volume) 2024 & 2032
- Figure 17: North America Honey Industry Revenue Share (%), by Import Market Analysis (Value & Volume) 2024 & 2032
- Figure 18: North America Honey Industry Revenue (Billion), by Export Market Analysis (Value & Volume) 2024 & 2032
- Figure 19: North America Honey Industry Revenue Share (%), by Export Market Analysis (Value & Volume) 2024 & 2032
- Figure 20: North America Honey Industry Revenue (Billion), by Price Trend Analysis 2024 & 2032
- Figure 21: North America Honey Industry Revenue Share (%), by Price Trend Analysis 2024 & 2032
- Figure 22: North America Honey Industry Revenue (Billion), by Country 2024 & 2032
- Figure 23: North America Honey Industry Revenue Share (%), by Country 2024 & 2032
- Figure 24: Europe Honey Industry Revenue (Billion), by Production Analysis 2024 & 2032
- Figure 25: Europe Honey Industry Revenue Share (%), by Production Analysis 2024 & 2032
- Figure 26: Europe Honey Industry Revenue (Billion), by Consumption Analysis 2024 & 2032
- Figure 27: Europe Honey Industry Revenue Share (%), by Consumption Analysis 2024 & 2032
- Figure 28: Europe Honey Industry Revenue (Billion), by Import Market Analysis (Value & Volume) 2024 & 2032
- Figure 29: Europe Honey Industry Revenue Share (%), by Import Market Analysis (Value & Volume) 2024 & 2032
- Figure 30: Europe Honey Industry Revenue (Billion), by Export Market Analysis (Value & Volume) 2024 & 2032
- Figure 31: Europe Honey Industry Revenue Share (%), by Export Market Analysis (Value & Volume) 2024 & 2032
- Figure 32: Europe Honey Industry Revenue (Billion), by Price Trend Analysis 2024 & 2032
- Figure 33: Europe Honey Industry Revenue Share (%), by Price Trend Analysis 2024 & 2032
- Figure 34: Europe Honey Industry Revenue (Billion), by Country 2024 & 2032
- Figure 35: Europe Honey Industry Revenue Share (%), by Country 2024 & 2032
- Figure 36: Asia Pacific Honey Industry Revenue (Billion), by Production Analysis 2024 & 2032
- Figure 37: Asia Pacific Honey Industry Revenue Share (%), by Production Analysis 2024 & 2032
- Figure 38: Asia Pacific Honey Industry Revenue (Billion), by Consumption Analysis 2024 & 2032
- Figure 39: Asia Pacific Honey Industry Revenue Share (%), by Consumption Analysis 2024 & 2032
- Figure 40: Asia Pacific Honey Industry Revenue (Billion), by Import Market Analysis (Value & Volume) 2024 & 2032
- Figure 41: Asia Pacific Honey Industry Revenue Share (%), by Import Market Analysis (Value & Volume) 2024 & 2032
- Figure 42: Asia Pacific Honey Industry Revenue (Billion), by Export Market Analysis (Value & Volume) 2024 & 2032
- Figure 43: Asia Pacific Honey Industry Revenue Share (%), by Export Market Analysis (Value & Volume) 2024 & 2032
- Figure 44: Asia Pacific Honey Industry Revenue (Billion), by Price Trend Analysis 2024 & 2032
- Figure 45: Asia Pacific Honey Industry Revenue Share (%), by Price Trend Analysis 2024 & 2032
- Figure 46: Asia Pacific Honey Industry Revenue (Billion), by Country 2024 & 2032
- Figure 47: Asia Pacific Honey Industry Revenue Share (%), by Country 2024 & 2032
- Figure 48: South America Honey Industry Revenue (Billion), by Production Analysis 2024 & 2032
- Figure 49: South America Honey Industry Revenue Share (%), by Production Analysis 2024 & 2032
- Figure 50: South America Honey Industry Revenue (Billion), by Consumption Analysis 2024 & 2032
- Figure 51: South America Honey Industry Revenue Share (%), by Consumption Analysis 2024 & 2032
- Figure 52: South America Honey Industry Revenue (Billion), by Import Market Analysis (Value & Volume) 2024 & 2032
- Figure 53: South America Honey Industry Revenue Share (%), by Import Market Analysis (Value & Volume) 2024 & 2032
- Figure 54: South America Honey Industry Revenue (Billion), by Export Market Analysis (Value & Volume) 2024 & 2032
- Figure 55: South America Honey Industry Revenue Share (%), by Export Market Analysis (Value & Volume) 2024 & 2032
- Figure 56: South America Honey Industry Revenue (Billion), by Price Trend Analysis 2024 & 2032
- Figure 57: South America Honey Industry Revenue Share (%), by Price Trend Analysis 2024 & 2032
- Figure 58: South America Honey Industry Revenue (Billion), by Country 2024 & 2032
- Figure 59: South America Honey Industry Revenue Share (%), by Country 2024 & 2032
- Figure 60: Middle East and Africa Honey Industry Revenue (Billion), by Production Analysis 2024 & 2032
- Figure 61: Middle East and Africa Honey Industry Revenue Share (%), by Production Analysis 2024 & 2032
- Figure 62: Middle East and Africa Honey Industry Revenue (Billion), by Consumption Analysis 2024 & 2032
- Figure 63: Middle East and Africa Honey Industry Revenue Share (%), by Consumption Analysis 2024 & 2032
- Figure 64: Middle East and Africa Honey Industry Revenue (Billion), by Import Market Analysis (Value & Volume) 2024 & 2032
- Figure 65: Middle East and Africa Honey Industry Revenue Share (%), by Import Market Analysis (Value & Volume) 2024 & 2032
- Figure 66: Middle East and Africa Honey Industry Revenue (Billion), by Export Market Analysis (Value & Volume) 2024 & 2032
- Figure 67: Middle East and Africa Honey Industry Revenue Share (%), by Export Market Analysis (Value & Volume) 2024 & 2032
- Figure 68: Middle East and Africa Honey Industry Revenue (Billion), by Price Trend Analysis 2024 & 2032
- Figure 69: Middle East and Africa Honey Industry Revenue Share (%), by Price Trend Analysis 2024 & 2032
- Figure 70: Middle East and Africa Honey Industry Revenue (Billion), by Country 2024 & 2032
- Figure 71: Middle East and Africa Honey Industry Revenue Share (%), by Country 2024 & 2032
List of Tables
- Table 1: Global Honey Industry Revenue Billion Forecast, by Region 2019 & 2032
- Table 2: Global Honey Industry Revenue Billion Forecast, by Production Analysis 2019 & 2032
- Table 3: Global Honey Industry Revenue Billion Forecast, by Consumption Analysis 2019 & 2032
- Table 4: Global Honey Industry Revenue Billion Forecast, by Import Market Analysis (Value & Volume) 2019 & 2032
- Table 5: Global Honey Industry Revenue Billion Forecast, by Export Market Analysis (Value & Volume) 2019 & 2032
- Table 6: Global Honey Industry Revenue Billion Forecast, by Price Trend Analysis 2019 & 2032
- Table 7: Global Honey Industry Revenue Billion Forecast, by Region 2019 & 2032
- Table 8: Global Honey Industry Revenue Billion Forecast, by Country 2019 & 2032
- Table 9: United States Honey Industry Revenue (Billion) Forecast, by Application 2019 & 2032
- Table 10: Canada Honey Industry Revenue (Billion) Forecast, by Application 2019 & 2032
- Table 11: Mexico Honey Industry Revenue (Billion) Forecast, by Application 2019 & 2032
- Table 12: Global Honey Industry Revenue Billion Forecast, by Country 2019 & 2032
- Table 13: Germany Honey Industry Revenue (Billion) Forecast, by Application 2019 & 2032
- Table 14: United Kingdom Honey Industry Revenue (Billion) Forecast, by Application 2019 & 2032
- Table 15: France Honey Industry Revenue (Billion) Forecast, by Application 2019 & 2032
- Table 16: Spain Honey Industry Revenue (Billion) Forecast, by Application 2019 & 2032
- Table 17: Italy Honey Industry Revenue (Billion) Forecast, by Application 2019 & 2032
- Table 18: Spain Honey Industry Revenue (Billion) Forecast, by Application 2019 & 2032
- Table 19: Belgium Honey Industry Revenue (Billion) Forecast, by Application 2019 & 2032
- Table 20: Netherland Honey Industry Revenue (Billion) Forecast, by Application 2019 & 2032
- Table 21: Nordics Honey Industry Revenue (Billion) Forecast, by Application 2019 & 2032
- Table 22: Rest of Europe Honey Industry Revenue (Billion) Forecast, by Application 2019 & 2032
- Table 23: Global Honey Industry Revenue Billion Forecast, by Country 2019 & 2032
- Table 24: China Honey Industry Revenue (Billion) Forecast, by Application 2019 & 2032
- Table 25: Japan Honey Industry Revenue (Billion) Forecast, by Application 2019 & 2032
- Table 26: India Honey Industry Revenue (Billion) Forecast, by Application 2019 & 2032
- Table 27: South Korea Honey Industry Revenue (Billion) Forecast, by Application 2019 & 2032
- Table 28: Southeast Asia Honey Industry Revenue (Billion) Forecast, by Application 2019 & 2032
- Table 29: Australia Honey Industry Revenue (Billion) Forecast, by Application 2019 & 2032
- Table 30: Indonesia Honey Industry Revenue (Billion) Forecast, by Application 2019 & 2032
- Table 31: Phillipes Honey Industry Revenue (Billion) Forecast, by Application 2019 & 2032
- Table 32: Singapore Honey Industry Revenue (Billion) Forecast, by Application 2019 & 2032
- Table 33: Thailandc Honey Industry Revenue (Billion) Forecast, by Application 2019 & 2032
- Table 34: Rest of Asia Pacific Honey Industry Revenue (Billion) Forecast, by Application 2019 & 2032
- Table 35: Global Honey Industry Revenue Billion Forecast, by Country 2019 & 2032
- Table 36: Brazil Honey Industry Revenue (Billion) Forecast, by Application 2019 & 2032
- Table 37: Argentina Honey Industry Revenue (Billion) Forecast, by Application 2019 & 2032
- Table 38: Peru Honey Industry Revenue (Billion) Forecast, by Application 2019 & 2032
- Table 39: Chile Honey Industry Revenue (Billion) Forecast, by Application 2019 & 2032
- Table 40: Colombia Honey Industry Revenue (Billion) Forecast, by Application 2019 & 2032
- Table 41: Ecuador Honey Industry Revenue (Billion) Forecast, by Application 2019 & 2032
- Table 42: Venezuela Honey Industry Revenue (Billion) Forecast, by Application 2019 & 2032
- Table 43: Rest of South America Honey Industry Revenue (Billion) Forecast, by Application 2019 & 2032
- Table 44: Global Honey Industry Revenue Billion Forecast, by Country 2019 & 2032
- Table 45: United Arab Emirates Honey Industry Revenue (Billion) Forecast, by Application 2019 & 2032
- Table 46: Saudi Arabia Honey Industry Revenue (Billion) Forecast, by Application 2019 & 2032
- Table 47: South Africa Honey Industry Revenue (Billion) Forecast, by Application 2019 & 2032
- Table 48: Rest of Middle East and Africa Honey Industry Revenue (Billion) Forecast, by Application 2019 & 2032
- Table 49: Global Honey Industry Revenue Billion Forecast, by Production Analysis 2019 & 2032
- Table 50: Global Honey Industry Revenue Billion Forecast, by Consumption Analysis 2019 & 2032
- Table 51: Global Honey Industry Revenue Billion Forecast, by Import Market Analysis (Value & Volume) 2019 & 2032
- Table 52: Global Honey Industry Revenue Billion Forecast, by Export Market Analysis (Value & Volume) 2019 & 2032
- Table 53: Global Honey Industry Revenue Billion Forecast, by Price Trend Analysis 2019 & 2032
- Table 54: Global Honey Industry Revenue Billion Forecast, by Country 2019 & 2032
- Table 55: United States Honey Industry Revenue (Billion) Forecast, by Application 2019 & 2032
- Table 56: Canada Honey Industry Revenue (Billion) Forecast, by Application 2019 & 2032
- Table 57: Mexico Honey Industry Revenue (Billion) Forecast, by Application 2019 & 2032
- Table 58: Global Honey Industry Revenue Billion Forecast, by Production Analysis 2019 & 2032
- Table 59: Global Honey Industry Revenue Billion Forecast, by Consumption Analysis 2019 & 2032
- Table 60: Global Honey Industry Revenue Billion Forecast, by Import Market Analysis (Value & Volume) 2019 & 2032
- Table 61: Global Honey Industry Revenue Billion Forecast, by Export Market Analysis (Value & Volume) 2019 & 2032
- Table 62: Global Honey Industry Revenue Billion Forecast, by Price Trend Analysis 2019 & 2032
- Table 63: Global Honey Industry Revenue Billion Forecast, by Country 2019 & 2032
- Table 64: Spain Honey Industry Revenue (Billion) Forecast, by Application 2019 & 2032
- Table 65: Ukraine Honey Industry Revenue (Billion) Forecast, by Application 2019 & 2032
- Table 66: Poland Honey Industry Revenue (Billion) Forecast, by Application 2019 & 2032
- Table 67: Germany Honey Industry Revenue (Billion) Forecast, by Application 2019 & 2032
- Table 68: Global Honey Industry Revenue Billion Forecast, by Production Analysis 2019 & 2032
- Table 69: Global Honey Industry Revenue Billion Forecast, by Consumption Analysis 2019 & 2032
- Table 70: Global Honey Industry Revenue Billion Forecast, by Import Market Analysis (Value & Volume) 2019 & 2032
- Table 71: Global Honey Industry Revenue Billion Forecast, by Export Market Analysis (Value & Volume) 2019 & 2032
- Table 72: Global Honey Industry Revenue Billion Forecast, by Price Trend Analysis 2019 & 2032
- Table 73: Global Honey Industry Revenue Billion Forecast, by Country 2019 & 2032
- Table 74: China Honey Industry Revenue (Billion) Forecast, by Application 2019 & 2032
- Table 75: India Honey Industry Revenue (Billion) Forecast, by Application 2019 & 2032
- Table 76: Japan Honey Industry Revenue (Billion) Forecast, by Application 2019 & 2032
- Table 77: New Zealand Honey Industry Revenue (Billion) Forecast, by Application 2019 & 2032
- Table 78: Global Honey Industry Revenue Billion Forecast, by Production Analysis 2019 & 2032
- Table 79: Global Honey Industry Revenue Billion Forecast, by Consumption Analysis 2019 & 2032
- Table 80: Global Honey Industry Revenue Billion Forecast, by Import Market Analysis (Value & Volume) 2019 & 2032
- Table 81: Global Honey Industry Revenue Billion Forecast, by Export Market Analysis (Value & Volume) 2019 & 2032
- Table 82: Global Honey Industry Revenue Billion Forecast, by Price Trend Analysis 2019 & 2032
- Table 83: Global Honey Industry Revenue Billion Forecast, by Country 2019 & 2032
- Table 84: Argentina Honey Industry Revenue (Billion) Forecast, by Application 2019 & 2032
- Table 85: Brazil Honey Industry Revenue (Billion) Forecast, by Application 2019 & 2032
- Table 86: Global Honey Industry Revenue Billion Forecast, by Production Analysis 2019 & 2032
- Table 87: Global Honey Industry Revenue Billion Forecast, by Consumption Analysis 2019 & 2032
- Table 88: Global Honey Industry Revenue Billion Forecast, by Import Market Analysis (Value & Volume) 2019 & 2032
- Table 89: Global Honey Industry Revenue Billion Forecast, by Export Market Analysis (Value & Volume) 2019 & 2032
- Table 90: Global Honey Industry Revenue Billion Forecast, by Price Trend Analysis 2019 & 2032
- Table 91: Global Honey Industry Revenue Billion Forecast, by Country 2019 & 2032
- Table 92: Turkey Honey Industry Revenue (Billion) Forecast, by Application 2019 & 2032
- Table 93: Iran Honey Industry Revenue (Billion) Forecast, by Application 2019 & 2032
Frequently Asked Questions
1. What is the projected Compound Annual Growth Rate (CAGR) of the Honey Industry?
The projected CAGR is approximately 5.20%.
2. Which companies are prominent players in the Honey Industry?
Key companies in the market include Dabur Honey , Patanjali Ayurved , Al Kabeer Exports , Madhu Makkhan, Zydus Wellness Ltd. .
3. What are the main segments of the Honey Industry?
The market segments include Production Analysis, Consumption Analysis, Import Market Analysis (Value & Volume), Export Market Analysis (Value & Volume), Price Trend Analysis.
4. Can you provide details about the market size?
The market size is estimated to be USD 11.08 Billion as of 2022.
5. What are some drivers contributing to market growth?
Increasing Demand for Garlic Due to Various Uses in Industries; Rising Demad of Organic Garlic; Increasing Government Initiatives.
6. What are the notable trends driving market growth?
Increasing Demand for Natural Sweeteners with Health Benefits of Natural Honey.
7. Are there any restraints impacting market growth?
Lack of Technical Knowledge of Farmers; Price Fluctuations.
8. Can you provide examples of recent developments in the market?
May 2024: The government of Canada is increasing funding to the Honey Bee Health Initiative by up to USD 1 million to help improve the resiliency and competitiveness of beekeeper operations in Ontario. The additional funding will help more Ontario beekeepers better protect their colonies over the winter and protect against invasive pests such as varroa mites which pose a serious threat to honeybee health.
9. What pricing options are available for accessing the report?
Pricing options include single-user, multi-user, and enterprise licenses priced at USD 4750, USD 5250, and USD 8750 respectively.
10. Is the market size provided in terms of value or volume?
The market size is provided in terms of value, measured in Billion.
11. Are there any specific market keywords associated with the report?
Yes, the market keyword associated with the report is "Honey Industry," which aids in identifying and referencing the specific market segment covered.
12. How do I determine which pricing option suits my needs best?
The pricing options vary based on user requirements and access needs. Individual users may opt for single-user licenses, while businesses requiring broader access may choose multi-user or enterprise licenses for cost-effective access to the report.
13. Are there any additional resources or data provided in the Honey Industry report?
While the report offers comprehensive insights, it's advisable to review the specific contents or supplementary materials provided to ascertain if additional resources or data are available.
14. How can I stay updated on further developments or reports in the Honey Industry?
To stay informed about further developments, trends, and reports in the Honey Industry, consider subscribing to industry newsletters, following relevant companies and organizations, or regularly checking reputable industry news sources and publications.
Methodology
Step 1 - Identification of Relevant Samples Size from Population Database


Step 2 - Approaches for Defining Global Market Size (Value, Volume* & Price*)

Note*: In applicable scenarios
Step 3 - Data Sources
Primary Research
- Web Analytics
- Survey Reports
- Research Institute
- Latest Research Reports
- Opinion Leaders
Secondary Research
- Annual Reports
- White Paper
- Latest Press Release
- Industry Association
- Paid Database
- Investor Presentations

Step 4 - Data Triangulation
Involves using different sources of information in order to increase the validity of a study
These sources are likely to be stakeholders in a program - participants, other researchers, program staff, other community members, and so on.
Then we put all data in single framework & apply various statistical tools to find out the dynamic on the market.
During the analysis stage, feedback from the stakeholder groups would be compared to determine areas of agreement as well as areas of divergence


