Key Insights
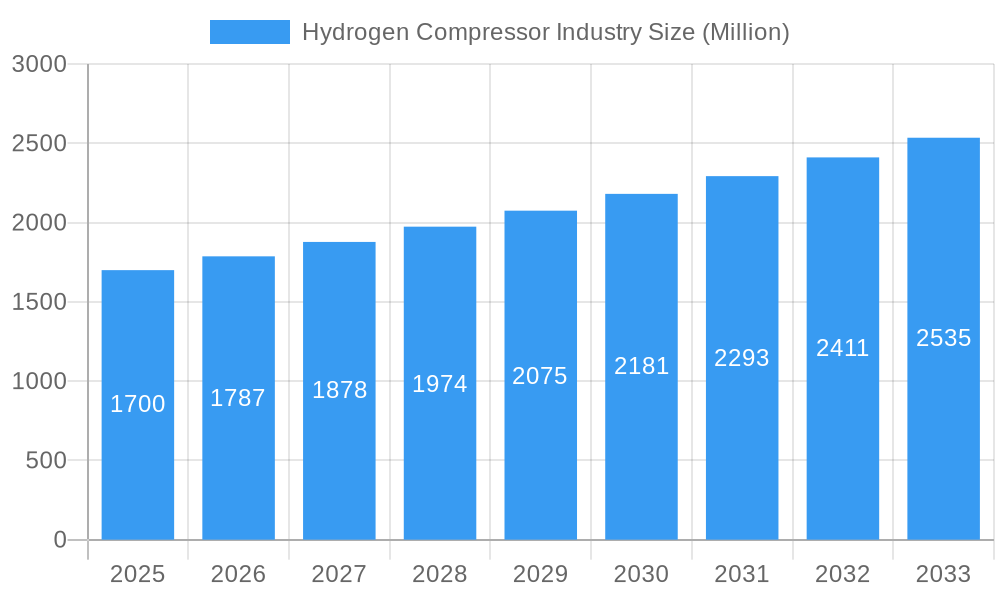
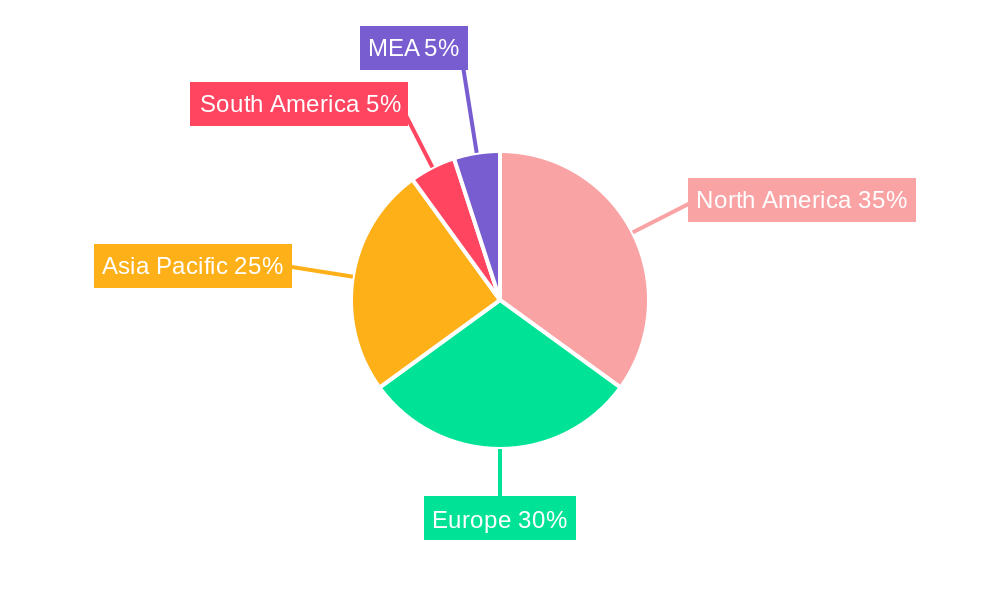
The global hydrogen compressor market, valued at $1.7 billion in 2025, is projected to experience robust growth, driven by the burgeoning green hydrogen sector and increasing demand for efficient hydrogen transportation and storage solutions. A compound annual growth rate (CAGR) of 5.20% from 2025 to 2033 indicates a significant expansion, reaching an estimated market value exceeding $2.7 billion by 2033. Key drivers include the global push towards decarbonization, increasing investments in renewable energy infrastructure, and the rising adoption of fuel cell electric vehicles (FCEVs) and hydrogen-based power generation. Technological advancements in compressor design, leading to improved efficiency and reduced operational costs, further fuel market growth. The market is segmented by technology (single-stage and multi-stage), type (oil-based and oil-free), and end-user industry (chemical, oil and gas, and others). While the oil and gas sector currently represents a significant portion of the market, the chemical and other end-user industries are expected to experience faster growth due to increasing hydrogen utilization in ammonia production and other industrial processes. Geographical distribution shows strong market presence in North America and Europe, with Asia-Pacific emerging as a key growth region due to substantial investments in renewable energy projects and government support for hydrogen initiatives. Competitive rivalry among established players like Haug Kompressoren AG, Corken Inc., and Ariel Corporation, alongside the emergence of new entrants, will shape the market landscape in the coming years.
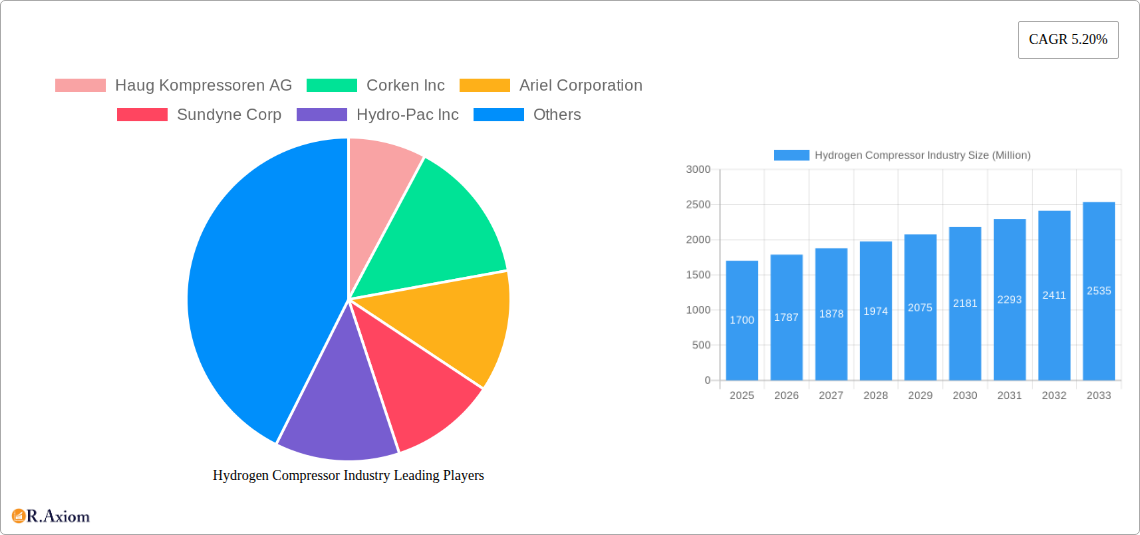
Hydrogen Compressor Industry Market Size (In Billion)
The market's growth trajectory is, however, subject to certain constraints. High initial capital expenditure for hydrogen compressor installation and maintenance remains a significant barrier to entry, particularly for smaller players. Furthermore, the availability of skilled labor for operation and maintenance of these specialized compressors may present challenges. The fluctuating prices of raw materials and the ongoing development of alternative hydrogen production and storage technologies could also impact the market's growth rate. Nevertheless, the long-term outlook for the hydrogen compressor market remains optimistic, with sustained growth anticipated throughout the forecast period driven by the global imperative for sustainable energy solutions and the growing importance of hydrogen in a low-carbon economy.
Hydrogen Compressor Industry Company Market Share
Hydrogen Compressor Industry Market Report: 2019-2033
This comprehensive report provides a detailed analysis of the global hydrogen compressor industry, encompassing market size, segmentation, key players, technological advancements, and future growth prospects. The study period covers 2019-2033, with 2025 as the base and estimated year. This report is crucial for industry stakeholders, investors, and researchers seeking actionable insights into this rapidly evolving sector. The global market value is projected to reach xx Million by 2033.
Hydrogen Compressor Industry Market Concentration & Innovation
This section analyzes the competitive landscape of the hydrogen compressor market, examining market concentration, innovation drivers, regulatory frameworks, and mergers & acquisitions (M&A) activities. The industry displays a moderately concentrated structure, with key players holding significant market share. However, emerging companies and technological advancements are fostering increased competition.
Market Concentration: The top 6 players, including Haug Kompressoren AG, Corken Inc, Ariel Corporation, Sundyne Corp, Hydro-Pac Inc, and Ingersoll Rand Inc, hold an estimated xx% market share in 2025. Other significant players include Indian Compressors Ltd, Burckhardt Compression AG, Howden Group Ltd, and Atlas Copco Group. Further analysis reveals a 4/6 market ranking/share (%) analysis, with xx% market concentration among the top 4 players.
Innovation Drivers: The growing demand for clean energy, stringent environmental regulations, and advancements in hydrogen production technologies are driving innovation in hydrogen compressor design and efficiency.
Regulatory Frameworks: Government policies promoting hydrogen as a clean fuel source, along with subsidies and incentives for hydrogen infrastructure development, are significantly impacting market growth. Varying regulations across different regions present both opportunities and challenges.
Product Substitutes: Currently, limited direct substitutes exist for hydrogen compressors in their core applications. However, technological advancements could lead to alternative compression methods in the future.
End-User Trends: The increasing adoption of hydrogen fuel cell vehicles and the expansion of hydrogen production and distribution infrastructure are key end-user trends driving market demand.
M&A Activities: The hydrogen compressor market has witnessed several M&A activities in recent years, though exact deal values remain undisclosed (xx Million estimated). These activities are driven by a desire to expand market reach, acquire technological expertise, and consolidate market share.
Hydrogen Compressor Industry Industry Trends & Insights
The hydrogen compressor market is experiencing robust growth, driven by the global transition towards cleaner energy sources. Several factors contribute to this expansion:
Market Growth Drivers: The increasing demand for hydrogen in various sectors, such as transportation, energy storage, and industrial applications, is a significant driver. Government policies promoting hydrogen adoption and investments in hydrogen infrastructure are further fueling market growth.
Technological Disruptions: Advancements in compressor technologies, such as the development of more efficient and reliable oil-free compressors, are improving the overall performance and reducing the cost of hydrogen compression. The emergence of novel compressor designs will continue to shape the market landscape.
Consumer Preferences: Growing awareness of environmental issues and the need to reduce carbon emissions is leading to increased consumer preference for hydrogen-based technologies, directly impacting demand.
Competitive Dynamics: The market is characterized by a mix of established players and new entrants. Competition is intensifying with companies focusing on product innovation, cost optimization, and expanding market reach. The CAGR is projected at xx% during the forecast period (2025-2033), with market penetration increasing from xx% to xx% by 2033.
Dominant Markets & Segments in Hydrogen Compressor Industry
This section identifies the leading regions, countries, and market segments within the hydrogen compressor industry.
Leading Regions/Countries: [Insert leading region/country here, e.g., North America/Europe/Asia-Pacific], owing to supportive government policies, a well-established industrial base, and increasing hydrogen adoption in various sectors, are currently dominant. Key drivers include robust economic policies promoting renewable energy, significant investments in hydrogen infrastructure, and a large potential consumer base.
Dominant Segments:
- Technology: Multistage compressors hold a significant market share due to their higher compression ratios suitable for high-pressure applications. However, single-stage compressors are witnessing growth in lower-pressure applications.
- Type: Oil-free compressors are gaining traction due to their environmental benefits and suitability for hydrogen purity requirements. Oil-based compressors, however, retain a considerable market share due to their cost-effectiveness.
- End-user Industry: The oil and gas sector is a major end-user, followed by the chemical industry. Other end-user industries, including transportation and power generation, are also exhibiting substantial growth potential.
Hydrogen Compressor Industry Product Developments
Recent advancements include the introduction of high-flow hydrogen compressors by MITSUI E&S Co. Ltd, designed for hydrogen stations and production equipment, and Sundyne's new standard PPI diaphragm compressor packages, offering improved efficiency and cost-effectiveness. The Southwest Research Institute's new hydrogen compressor design aims to enhance efficiency and reliability for fuel cell electric vehicle refueling. These developments reflect a clear trend toward higher efficiency, lower costs, and improved reliability within the industry.
Report Scope & Segmentation Analysis
This report segments the hydrogen compressor market based on technology (single-stage, multistage), type (oil-based, oil-free), and end-user industry (chemical, oil and gas, other). Each segment's growth projection, market size, and competitive dynamics are comprehensively analyzed. For example, the oil-free segment is projected to experience rapid growth due to increasing environmental concerns, while the multistage segment will dominate due to its ability to handle high-pressure applications.
Key Drivers of Hydrogen Compressor Industry Growth
Several factors contribute to the growth of the hydrogen compressor market. These include technological advancements leading to more efficient and reliable compressors, supportive government policies and incentives, and increasing demand from various sectors like transportation, energy storage, and industrial applications. Economic factors, including decreasing production costs and increasing energy security concerns, also play a vital role.
Challenges in the Hydrogen Compressor Industry Sector
The hydrogen compressor industry faces certain challenges including the high initial investment cost for compressor installations, the need for specialized materials resistant to hydrogen embrittlement, and the potential for supply chain disruptions impacting component availability. Regulatory hurdles related to safety standards and emission regulations in various regions also impose constraints on market growth. These factors lead to a xx% reduction in predicted market growth.
Emerging Opportunities in Hydrogen Compressor Industry
The industry presents promising opportunities in emerging markets with supportive government policies, the development of innovative compressor technologies (e.g., membrane compressors), and the expansion into new applications (e.g., hydrogen pipelines). Increased focus on the production of green hydrogen will further broaden the market opportunities for hydrogen compressors.
Leading Players in the Hydrogen Compressor Industry Market
- Haug Kompressoren AG
- Corken Inc
- Ariel Corporation
- Sundyne Corp
- Hydro-Pac Inc
- Ingersoll Rand Inc
- Indian Compressors Ltd
- Burckhardt Compression AG
- Howden Group Ltd
- Atlas Copco Group
Key Developments in Hydrogen Compressor Industry Industry
April 2024: MITSUI E&S Co. Ltd launched high-flow hydrogen compressors for hydrogen stations and production equipment (up to 50 MPa, 95 kg/h flow rate). This significantly expands the potential market.
August 2023: Sundyne announced four new standard PPI diaphragm compressor packages, improving cost-effectiveness and ease of deployment. This boosts market accessibility.
March 2023: The Southwest Research Institute developed a new hydrogen compressor enhancing efficiency and reliability for fuel-cell electric vehicle refueling, improving market adoption in the transport sector.
Strategic Outlook for Hydrogen Compressor Industry Market
The hydrogen compressor market is poised for significant growth, driven by the global energy transition and increasing adoption of hydrogen as a clean fuel source. Further technological advancements, expanding applications across various sectors, and supportive government policies create substantial growth opportunities. The market is expected to witness a sustained growth trajectory in the coming years, presented with challenges in handling high pressures.
Hydrogen Compressor Industry Segmentation
-
1. Technology
- 1.1. Single-stage
- 1.2. Multistage
-
2. Type
- 2.1. Oil-based
- 2.2. Oil-free
-
3. End-user Industry
- 3.1. Chemical
- 3.2. Oil and Gas
- 3.3. Other End-user Industries
Hydrogen Compressor Industry Segmentation By Geography
-
1. North America
- 1.1. United States
- 1.2. Canada
- 1.3. Rest of North America
-
2. Europe
- 2.1. Germany
- 2.2. United Kingdom
- 2.3. France
- 2.4. Italy
- 2.5. Russia
- 2.6. NORDIC
- 2.7. Spain
- 2.8. Rest of Europe
-
3. Asia Pacific
- 3.1. India
- 3.2. China
- 3.3. Japan
- 3.4. Australia
- 3.5. Malaysia
- 3.6. Indonesia
- 3.7. Thailand
- 3.8. Rest of Asia Pacific
-
4. Middle East and Africa
- 4.1. Saudi Arabia
- 4.2. South Africa
- 4.3. Qatar
- 4.4. United Arab Emirates
- 4.5. Nigeria
- 4.6. Egypt
- 4.7. Rest of Middle East and Africa
-
5. South America
- 5.1. Brazil
- 5.2. Argentina
- 5.3. Colombia
- 5.4. Rest of South America
Hydrogen Compressor Industry Regional Market Share
Geographic Coverage of Hydrogen Compressor Industry
Hydrogen Compressor Industry REPORT HIGHLIGHTS
| Aspects | Details |
|---|---|
| Study Period | 2020-2034 |
| Base Year | 2025 |
| Estimated Year | 2026 |
| Forecast Period | 2026-2034 |
| Historical Period | 2020-2025 |
| Growth Rate | CAGR of 5.20% from 2020-2034 |
| Segmentation |
|
Table of Contents
- 1. Introduction
- 1.1. Research Scope
- 1.2. Market Segmentation
- 1.3. Research Objective
- 1.4. Definitions and Assumptions
- 2. Executive Summary
- 2.1. Market Snapshot
- 3. Market Dynamics
- 3.1. Market Drivers
- 3.2. Market Restrains
- 3.3. Market Trends
- 3.4. Market Opportunities
- 4. Market Factor Analysis
- 4.1. Porters Five Forces
- 4.1.1. Bargaining Power of Suppliers
- 4.1.2. Bargaining Power of Buyers
- 4.1.3. Threat of New Entrants
- 4.1.4. Threat of Substitutes
- 4.1.5. Competitive Rivalry
- 4.2. PESTEL analysis
- 4.3. BCG Analysis
- 4.3.1. Stars (High Growth, High Market Share)
- 4.3.2. Cash Cows (Low Growth, High Market Share)
- 4.3.3. Question Mark (High Growth, Low Market Share)
- 4.3.4. Dogs (Low Growth, Low Market Share)
- 4.4. Ansoff Matrix Analysis
- 4.5. Supply Chain Analysis
- 4.6. Regulatory Landscape
- 4.7. Current Market Potential and Opportunity Assessment (TAM–SAM–SOM Framework)
- 4.8. RAX Analyst Note
- 4.1. Porters Five Forces
- 5. Market Analysis, Insights and Forecast 2021-2033
- 5.1. Market Analysis, Insights and Forecast - by Technology
- 5.1.1. Single-stage
- 5.1.2. Multistage
- 5.2. Market Analysis, Insights and Forecast - by Type
- 5.2.1. Oil-based
- 5.2.2. Oil-free
- 5.3. Market Analysis, Insights and Forecast - by End-user Industry
- 5.3.1. Chemical
- 5.3.2. Oil and Gas
- 5.3.3. Other End-user Industries
- 5.4. Market Analysis, Insights and Forecast - by Region
- 5.4.1. North America
- 5.4.2. Europe
- 5.4.3. Asia Pacific
- 5.4.4. Middle East and Africa
- 5.4.5. South America
- 5.1. Market Analysis, Insights and Forecast - by Technology
- 6. Global Hydrogen Compressor Industry Analysis, Insights and Forecast, 2021-2033
- 6.1. Market Analysis, Insights and Forecast - by Technology
- 6.1.1. Single-stage
- 6.1.2. Multistage
- 6.2. Market Analysis, Insights and Forecast - by Type
- 6.2.1. Oil-based
- 6.2.2. Oil-free
- 6.3. Market Analysis, Insights and Forecast - by End-user Industry
- 6.3.1. Chemical
- 6.3.2. Oil and Gas
- 6.3.3. Other End-user Industries
- 6.1. Market Analysis, Insights and Forecast - by Technology
- 7. North America Hydrogen Compressor Industry Analysis, Insights and Forecast, 2020-2032
- 7.1. Market Analysis, Insights and Forecast - by Technology
- 7.1.1. Single-stage
- 7.1.2. Multistage
- 7.2. Market Analysis, Insights and Forecast - by Type
- 7.2.1. Oil-based
- 7.2.2. Oil-free
- 7.3. Market Analysis, Insights and Forecast - by End-user Industry
- 7.3.1. Chemical
- 7.3.2. Oil and Gas
- 7.3.3. Other End-user Industries
- 7.1. Market Analysis, Insights and Forecast - by Technology
- 8. Europe Hydrogen Compressor Industry Analysis, Insights and Forecast, 2020-2032
- 8.1. Market Analysis, Insights and Forecast - by Technology
- 8.1.1. Single-stage
- 8.1.2. Multistage
- 8.2. Market Analysis, Insights and Forecast - by Type
- 8.2.1. Oil-based
- 8.2.2. Oil-free
- 8.3. Market Analysis, Insights and Forecast - by End-user Industry
- 8.3.1. Chemical
- 8.3.2. Oil and Gas
- 8.3.3. Other End-user Industries
- 8.1. Market Analysis, Insights and Forecast - by Technology
- 9. Asia Pacific Hydrogen Compressor Industry Analysis, Insights and Forecast, 2020-2032
- 9.1. Market Analysis, Insights and Forecast - by Technology
- 9.1.1. Single-stage
- 9.1.2. Multistage
- 9.2. Market Analysis, Insights and Forecast - by Type
- 9.2.1. Oil-based
- 9.2.2. Oil-free
- 9.3. Market Analysis, Insights and Forecast - by End-user Industry
- 9.3.1. Chemical
- 9.3.2. Oil and Gas
- 9.3.3. Other End-user Industries
- 9.1. Market Analysis, Insights and Forecast - by Technology
- 10. Middle East and Africa Hydrogen Compressor Industry Analysis, Insights and Forecast, 2020-2032
- 10.1. Market Analysis, Insights and Forecast - by Technology
- 10.1.1. Single-stage
- 10.1.2. Multistage
- 10.2. Market Analysis, Insights and Forecast - by Type
- 10.2.1. Oil-based
- 10.2.2. Oil-free
- 10.3. Market Analysis, Insights and Forecast - by End-user Industry
- 10.3.1. Chemical
- 10.3.2. Oil and Gas
- 10.3.3. Other End-user Industries
- 10.1. Market Analysis, Insights and Forecast - by Technology
- 11. South America Hydrogen Compressor Industry Analysis, Insights and Forecast, 2020-2032
- 11.1. Market Analysis, Insights and Forecast - by Technology
- 11.1.1. Single-stage
- 11.1.2. Multistage
- 11.2. Market Analysis, Insights and Forecast - by Type
- 11.2.1. Oil-based
- 11.2.2. Oil-free
- 11.3. Market Analysis, Insights and Forecast - by End-user Industry
- 11.3.1. Chemical
- 11.3.2. Oil and Gas
- 11.3.3. Other End-user Industries
- 11.1. Market Analysis, Insights and Forecast - by Technology
- 12. Competitive Analysis
- 12.1. Company Profiles
- 12.1.1 Haug Kompressoren AG
- 12.1.1.1. Company Overview
- 12.1.1.2. Products
- 12.1.1.3. Company Financials
- 12.1.1.4. SWOT Analysis
- 12.1.2 Corken Inc
- 12.1.2.1. Company Overview
- 12.1.2.2. Products
- 12.1.2.3. Company Financials
- 12.1.2.4. SWOT Analysis
- 12.1.3 Ariel Corporation
- 12.1.3.1. Company Overview
- 12.1.3.2. Products
- 12.1.3.3. Company Financials
- 12.1.3.4. SWOT Analysis
- 12.1.4 Sundyne Corp
- 12.1.4.1. Company Overview
- 12.1.4.2. Products
- 12.1.4.3. Company Financials
- 12.1.4.4. SWOT Analysis
- 12.1.5 Hydro-Pac Inc
- 12.1.5.1. Company Overview
- 12.1.5.2. Products
- 12.1.5.3. Company Financials
- 12.1.5.4. SWOT Analysis
- 12.1.6 Ingersoll Rand Inc *List Not Exhaustive 6 4 Market Ranking/Share (%) Analysi
- 12.1.6.1. Company Overview
- 12.1.6.2. Products
- 12.1.6.3. Company Financials
- 12.1.6.4. SWOT Analysis
- 12.1.7 Indian Compressors Ltd
- 12.1.7.1. Company Overview
- 12.1.7.2. Products
- 12.1.7.3. Company Financials
- 12.1.7.4. SWOT Analysis
- 12.1.8 Burckhardt Compression AG
- 12.1.8.1. Company Overview
- 12.1.8.2. Products
- 12.1.8.3. Company Financials
- 12.1.8.4. SWOT Analysis
- 12.1.9 Howden Group Ltd
- 12.1.9.1. Company Overview
- 12.1.9.2. Products
- 12.1.9.3. Company Financials
- 12.1.9.4. SWOT Analysis
- 12.1.10 Atlas Copco Group
- 12.1.10.1. Company Overview
- 12.1.10.2. Products
- 12.1.10.3. Company Financials
- 12.1.10.4. SWOT Analysis
- 12.1.1 Haug Kompressoren AG
- 12.2. Market Entropy
- 12.2.1 Company's Key Areas Served
- 12.2.2 Recent Developments
- 12.3. Company Market Share Analysis 2025
- 12.3.1 Top 5 Companies Market Share Analysis
- 12.3.2 Top 3 Companies Market Share Analysis
- 12.4. List of Potential Customers
- 13. Research Methodology
List of Figures
- Figure 1: Global Hydrogen Compressor Industry Revenue Breakdown (Million, %) by Region 2025 & 2033
- Figure 2: Global Hydrogen Compressor Industry Volume Breakdown (K Tons, %) by Region 2025 & 2033
- Figure 3: North America Hydrogen Compressor Industry Revenue (Million), by Technology 2025 & 2033
- Figure 4: North America Hydrogen Compressor Industry Volume (K Tons), by Technology 2025 & 2033
- Figure 5: North America Hydrogen Compressor Industry Revenue Share (%), by Technology 2025 & 2033
- Figure 6: North America Hydrogen Compressor Industry Volume Share (%), by Technology 2025 & 2033
- Figure 7: North America Hydrogen Compressor Industry Revenue (Million), by Type 2025 & 2033
- Figure 8: North America Hydrogen Compressor Industry Volume (K Tons), by Type 2025 & 2033
- Figure 9: North America Hydrogen Compressor Industry Revenue Share (%), by Type 2025 & 2033
- Figure 10: North America Hydrogen Compressor Industry Volume Share (%), by Type 2025 & 2033
- Figure 11: North America Hydrogen Compressor Industry Revenue (Million), by End-user Industry 2025 & 2033
- Figure 12: North America Hydrogen Compressor Industry Volume (K Tons), by End-user Industry 2025 & 2033
- Figure 13: North America Hydrogen Compressor Industry Revenue Share (%), by End-user Industry 2025 & 2033
- Figure 14: North America Hydrogen Compressor Industry Volume Share (%), by End-user Industry 2025 & 2033
- Figure 15: North America Hydrogen Compressor Industry Revenue (Million), by Country 2025 & 2033
- Figure 16: North America Hydrogen Compressor Industry Volume (K Tons), by Country 2025 & 2033
- Figure 17: North America Hydrogen Compressor Industry Revenue Share (%), by Country 2025 & 2033
- Figure 18: North America Hydrogen Compressor Industry Volume Share (%), by Country 2025 & 2033
- Figure 19: Europe Hydrogen Compressor Industry Revenue (Million), by Technology 2025 & 2033
- Figure 20: Europe Hydrogen Compressor Industry Volume (K Tons), by Technology 2025 & 2033
- Figure 21: Europe Hydrogen Compressor Industry Revenue Share (%), by Technology 2025 & 2033
- Figure 22: Europe Hydrogen Compressor Industry Volume Share (%), by Technology 2025 & 2033
- Figure 23: Europe Hydrogen Compressor Industry Revenue (Million), by Type 2025 & 2033
- Figure 24: Europe Hydrogen Compressor Industry Volume (K Tons), by Type 2025 & 2033
- Figure 25: Europe Hydrogen Compressor Industry Revenue Share (%), by Type 2025 & 2033
- Figure 26: Europe Hydrogen Compressor Industry Volume Share (%), by Type 2025 & 2033
- Figure 27: Europe Hydrogen Compressor Industry Revenue (Million), by End-user Industry 2025 & 2033
- Figure 28: Europe Hydrogen Compressor Industry Volume (K Tons), by End-user Industry 2025 & 2033
- Figure 29: Europe Hydrogen Compressor Industry Revenue Share (%), by End-user Industry 2025 & 2033
- Figure 30: Europe Hydrogen Compressor Industry Volume Share (%), by End-user Industry 2025 & 2033
- Figure 31: Europe Hydrogen Compressor Industry Revenue (Million), by Country 2025 & 2033
- Figure 32: Europe Hydrogen Compressor Industry Volume (K Tons), by Country 2025 & 2033
- Figure 33: Europe Hydrogen Compressor Industry Revenue Share (%), by Country 2025 & 2033
- Figure 34: Europe Hydrogen Compressor Industry Volume Share (%), by Country 2025 & 2033
- Figure 35: Asia Pacific Hydrogen Compressor Industry Revenue (Million), by Technology 2025 & 2033
- Figure 36: Asia Pacific Hydrogen Compressor Industry Volume (K Tons), by Technology 2025 & 2033
- Figure 37: Asia Pacific Hydrogen Compressor Industry Revenue Share (%), by Technology 2025 & 2033
- Figure 38: Asia Pacific Hydrogen Compressor Industry Volume Share (%), by Technology 2025 & 2033
- Figure 39: Asia Pacific Hydrogen Compressor Industry Revenue (Million), by Type 2025 & 2033
- Figure 40: Asia Pacific Hydrogen Compressor Industry Volume (K Tons), by Type 2025 & 2033
- Figure 41: Asia Pacific Hydrogen Compressor Industry Revenue Share (%), by Type 2025 & 2033
- Figure 42: Asia Pacific Hydrogen Compressor Industry Volume Share (%), by Type 2025 & 2033
- Figure 43: Asia Pacific Hydrogen Compressor Industry Revenue (Million), by End-user Industry 2025 & 2033
- Figure 44: Asia Pacific Hydrogen Compressor Industry Volume (K Tons), by End-user Industry 2025 & 2033
- Figure 45: Asia Pacific Hydrogen Compressor Industry Revenue Share (%), by End-user Industry 2025 & 2033
- Figure 46: Asia Pacific Hydrogen Compressor Industry Volume Share (%), by End-user Industry 2025 & 2033
- Figure 47: Asia Pacific Hydrogen Compressor Industry Revenue (Million), by Country 2025 & 2033
- Figure 48: Asia Pacific Hydrogen Compressor Industry Volume (K Tons), by Country 2025 & 2033
- Figure 49: Asia Pacific Hydrogen Compressor Industry Revenue Share (%), by Country 2025 & 2033
- Figure 50: Asia Pacific Hydrogen Compressor Industry Volume Share (%), by Country 2025 & 2033
- Figure 51: Middle East and Africa Hydrogen Compressor Industry Revenue (Million), by Technology 2025 & 2033
- Figure 52: Middle East and Africa Hydrogen Compressor Industry Volume (K Tons), by Technology 2025 & 2033
- Figure 53: Middle East and Africa Hydrogen Compressor Industry Revenue Share (%), by Technology 2025 & 2033
- Figure 54: Middle East and Africa Hydrogen Compressor Industry Volume Share (%), by Technology 2025 & 2033
- Figure 55: Middle East and Africa Hydrogen Compressor Industry Revenue (Million), by Type 2025 & 2033
- Figure 56: Middle East and Africa Hydrogen Compressor Industry Volume (K Tons), by Type 2025 & 2033
- Figure 57: Middle East and Africa Hydrogen Compressor Industry Revenue Share (%), by Type 2025 & 2033
- Figure 58: Middle East and Africa Hydrogen Compressor Industry Volume Share (%), by Type 2025 & 2033
- Figure 59: Middle East and Africa Hydrogen Compressor Industry Revenue (Million), by End-user Industry 2025 & 2033
- Figure 60: Middle East and Africa Hydrogen Compressor Industry Volume (K Tons), by End-user Industry 2025 & 2033
- Figure 61: Middle East and Africa Hydrogen Compressor Industry Revenue Share (%), by End-user Industry 2025 & 2033
- Figure 62: Middle East and Africa Hydrogen Compressor Industry Volume Share (%), by End-user Industry 2025 & 2033
- Figure 63: Middle East and Africa Hydrogen Compressor Industry Revenue (Million), by Country 2025 & 2033
- Figure 64: Middle East and Africa Hydrogen Compressor Industry Volume (K Tons), by Country 2025 & 2033
- Figure 65: Middle East and Africa Hydrogen Compressor Industry Revenue Share (%), by Country 2025 & 2033
- Figure 66: Middle East and Africa Hydrogen Compressor Industry Volume Share (%), by Country 2025 & 2033
- Figure 67: South America Hydrogen Compressor Industry Revenue (Million), by Technology 2025 & 2033
- Figure 68: South America Hydrogen Compressor Industry Volume (K Tons), by Technology 2025 & 2033
- Figure 69: South America Hydrogen Compressor Industry Revenue Share (%), by Technology 2025 & 2033
- Figure 70: South America Hydrogen Compressor Industry Volume Share (%), by Technology 2025 & 2033
- Figure 71: South America Hydrogen Compressor Industry Revenue (Million), by Type 2025 & 2033
- Figure 72: South America Hydrogen Compressor Industry Volume (K Tons), by Type 2025 & 2033
- Figure 73: South America Hydrogen Compressor Industry Revenue Share (%), by Type 2025 & 2033
- Figure 74: South America Hydrogen Compressor Industry Volume Share (%), by Type 2025 & 2033
- Figure 75: South America Hydrogen Compressor Industry Revenue (Million), by End-user Industry 2025 & 2033
- Figure 76: South America Hydrogen Compressor Industry Volume (K Tons), by End-user Industry 2025 & 2033
- Figure 77: South America Hydrogen Compressor Industry Revenue Share (%), by End-user Industry 2025 & 2033
- Figure 78: South America Hydrogen Compressor Industry Volume Share (%), by End-user Industry 2025 & 2033
- Figure 79: South America Hydrogen Compressor Industry Revenue (Million), by Country 2025 & 2033
- Figure 80: South America Hydrogen Compressor Industry Volume (K Tons), by Country 2025 & 2033
- Figure 81: South America Hydrogen Compressor Industry Revenue Share (%), by Country 2025 & 2033
- Figure 82: South America Hydrogen Compressor Industry Volume Share (%), by Country 2025 & 2033
List of Tables
- Table 1: Global Hydrogen Compressor Industry Revenue Million Forecast, by Technology 2020 & 2033
- Table 2: Global Hydrogen Compressor Industry Volume K Tons Forecast, by Technology 2020 & 2033
- Table 3: Global Hydrogen Compressor Industry Revenue Million Forecast, by Type 2020 & 2033
- Table 4: Global Hydrogen Compressor Industry Volume K Tons Forecast, by Type 2020 & 2033
- Table 5: Global Hydrogen Compressor Industry Revenue Million Forecast, by End-user Industry 2020 & 2033
- Table 6: Global Hydrogen Compressor Industry Volume K Tons Forecast, by End-user Industry 2020 & 2033
- Table 7: Global Hydrogen Compressor Industry Revenue Million Forecast, by Region 2020 & 2033
- Table 8: Global Hydrogen Compressor Industry Volume K Tons Forecast, by Region 2020 & 2033
- Table 9: Global Hydrogen Compressor Industry Revenue Million Forecast, by Technology 2020 & 2033
- Table 10: Global Hydrogen Compressor Industry Volume K Tons Forecast, by Technology 2020 & 2033
- Table 11: Global Hydrogen Compressor Industry Revenue Million Forecast, by Type 2020 & 2033
- Table 12: Global Hydrogen Compressor Industry Volume K Tons Forecast, by Type 2020 & 2033
- Table 13: Global Hydrogen Compressor Industry Revenue Million Forecast, by End-user Industry 2020 & 2033
- Table 14: Global Hydrogen Compressor Industry Volume K Tons Forecast, by End-user Industry 2020 & 2033
- Table 15: Global Hydrogen Compressor Industry Revenue Million Forecast, by Country 2020 & 2033
- Table 16: Global Hydrogen Compressor Industry Volume K Tons Forecast, by Country 2020 & 2033
- Table 17: United States Hydrogen Compressor Industry Revenue (Million) Forecast, by Application 2020 & 2033
- Table 18: United States Hydrogen Compressor Industry Volume (K Tons) Forecast, by Application 2020 & 2033
- Table 19: Canada Hydrogen Compressor Industry Revenue (Million) Forecast, by Application 2020 & 2033
- Table 20: Canada Hydrogen Compressor Industry Volume (K Tons) Forecast, by Application 2020 & 2033
- Table 21: Rest of North America Hydrogen Compressor Industry Revenue (Million) Forecast, by Application 2020 & 2033
- Table 22: Rest of North America Hydrogen Compressor Industry Volume (K Tons) Forecast, by Application 2020 & 2033
- Table 23: Global Hydrogen Compressor Industry Revenue Million Forecast, by Technology 2020 & 2033
- Table 24: Global Hydrogen Compressor Industry Volume K Tons Forecast, by Technology 2020 & 2033
- Table 25: Global Hydrogen Compressor Industry Revenue Million Forecast, by Type 2020 & 2033
- Table 26: Global Hydrogen Compressor Industry Volume K Tons Forecast, by Type 2020 & 2033
- Table 27: Global Hydrogen Compressor Industry Revenue Million Forecast, by End-user Industry 2020 & 2033
- Table 28: Global Hydrogen Compressor Industry Volume K Tons Forecast, by End-user Industry 2020 & 2033
- Table 29: Global Hydrogen Compressor Industry Revenue Million Forecast, by Country 2020 & 2033
- Table 30: Global Hydrogen Compressor Industry Volume K Tons Forecast, by Country 2020 & 2033
- Table 31: Germany Hydrogen Compressor Industry Revenue (Million) Forecast, by Application 2020 & 2033
- Table 32: Germany Hydrogen Compressor Industry Volume (K Tons) Forecast, by Application 2020 & 2033
- Table 33: United Kingdom Hydrogen Compressor Industry Revenue (Million) Forecast, by Application 2020 & 2033
- Table 34: United Kingdom Hydrogen Compressor Industry Volume (K Tons) Forecast, by Application 2020 & 2033
- Table 35: France Hydrogen Compressor Industry Revenue (Million) Forecast, by Application 2020 & 2033
- Table 36: France Hydrogen Compressor Industry Volume (K Tons) Forecast, by Application 2020 & 2033
- Table 37: Italy Hydrogen Compressor Industry Revenue (Million) Forecast, by Application 2020 & 2033
- Table 38: Italy Hydrogen Compressor Industry Volume (K Tons) Forecast, by Application 2020 & 2033
- Table 39: Russia Hydrogen Compressor Industry Revenue (Million) Forecast, by Application 2020 & 2033
- Table 40: Russia Hydrogen Compressor Industry Volume (K Tons) Forecast, by Application 2020 & 2033
- Table 41: NORDIC Hydrogen Compressor Industry Revenue (Million) Forecast, by Application 2020 & 2033
- Table 42: NORDIC Hydrogen Compressor Industry Volume (K Tons) Forecast, by Application 2020 & 2033
- Table 43: Spain Hydrogen Compressor Industry Revenue (Million) Forecast, by Application 2020 & 2033
- Table 44: Spain Hydrogen Compressor Industry Volume (K Tons) Forecast, by Application 2020 & 2033
- Table 45: Rest of Europe Hydrogen Compressor Industry Revenue (Million) Forecast, by Application 2020 & 2033
- Table 46: Rest of Europe Hydrogen Compressor Industry Volume (K Tons) Forecast, by Application 2020 & 2033
- Table 47: Global Hydrogen Compressor Industry Revenue Million Forecast, by Technology 2020 & 2033
- Table 48: Global Hydrogen Compressor Industry Volume K Tons Forecast, by Technology 2020 & 2033
- Table 49: Global Hydrogen Compressor Industry Revenue Million Forecast, by Type 2020 & 2033
- Table 50: Global Hydrogen Compressor Industry Volume K Tons Forecast, by Type 2020 & 2033
- Table 51: Global Hydrogen Compressor Industry Revenue Million Forecast, by End-user Industry 2020 & 2033
- Table 52: Global Hydrogen Compressor Industry Volume K Tons Forecast, by End-user Industry 2020 & 2033
- Table 53: Global Hydrogen Compressor Industry Revenue Million Forecast, by Country 2020 & 2033
- Table 54: Global Hydrogen Compressor Industry Volume K Tons Forecast, by Country 2020 & 2033
- Table 55: India Hydrogen Compressor Industry Revenue (Million) Forecast, by Application 2020 & 2033
- Table 56: India Hydrogen Compressor Industry Volume (K Tons) Forecast, by Application 2020 & 2033
- Table 57: China Hydrogen Compressor Industry Revenue (Million) Forecast, by Application 2020 & 2033
- Table 58: China Hydrogen Compressor Industry Volume (K Tons) Forecast, by Application 2020 & 2033
- Table 59: Japan Hydrogen Compressor Industry Revenue (Million) Forecast, by Application 2020 & 2033
- Table 60: Japan Hydrogen Compressor Industry Volume (K Tons) Forecast, by Application 2020 & 2033
- Table 61: Australia Hydrogen Compressor Industry Revenue (Million) Forecast, by Application 2020 & 2033
- Table 62: Australia Hydrogen Compressor Industry Volume (K Tons) Forecast, by Application 2020 & 2033
- Table 63: Malaysia Hydrogen Compressor Industry Revenue (Million) Forecast, by Application 2020 & 2033
- Table 64: Malaysia Hydrogen Compressor Industry Volume (K Tons) Forecast, by Application 2020 & 2033
- Table 65: Indonesia Hydrogen Compressor Industry Revenue (Million) Forecast, by Application 2020 & 2033
- Table 66: Indonesia Hydrogen Compressor Industry Volume (K Tons) Forecast, by Application 2020 & 2033
- Table 67: Thailand Hydrogen Compressor Industry Revenue (Million) Forecast, by Application 2020 & 2033
- Table 68: Thailand Hydrogen Compressor Industry Volume (K Tons) Forecast, by Application 2020 & 2033
- Table 69: Rest of Asia Pacific Hydrogen Compressor Industry Revenue (Million) Forecast, by Application 2020 & 2033
- Table 70: Rest of Asia Pacific Hydrogen Compressor Industry Volume (K Tons) Forecast, by Application 2020 & 2033
- Table 71: Global Hydrogen Compressor Industry Revenue Million Forecast, by Technology 2020 & 2033
- Table 72: Global Hydrogen Compressor Industry Volume K Tons Forecast, by Technology 2020 & 2033
- Table 73: Global Hydrogen Compressor Industry Revenue Million Forecast, by Type 2020 & 2033
- Table 74: Global Hydrogen Compressor Industry Volume K Tons Forecast, by Type 2020 & 2033
- Table 75: Global Hydrogen Compressor Industry Revenue Million Forecast, by End-user Industry 2020 & 2033
- Table 76: Global Hydrogen Compressor Industry Volume K Tons Forecast, by End-user Industry 2020 & 2033
- Table 77: Global Hydrogen Compressor Industry Revenue Million Forecast, by Country 2020 & 2033
- Table 78: Global Hydrogen Compressor Industry Volume K Tons Forecast, by Country 2020 & 2033
- Table 79: Saudi Arabia Hydrogen Compressor Industry Revenue (Million) Forecast, by Application 2020 & 2033
- Table 80: Saudi Arabia Hydrogen Compressor Industry Volume (K Tons) Forecast, by Application 2020 & 2033
- Table 81: South Africa Hydrogen Compressor Industry Revenue (Million) Forecast, by Application 2020 & 2033
- Table 82: South Africa Hydrogen Compressor Industry Volume (K Tons) Forecast, by Application 2020 & 2033
- Table 83: Qatar Hydrogen Compressor Industry Revenue (Million) Forecast, by Application 2020 & 2033
- Table 84: Qatar Hydrogen Compressor Industry Volume (K Tons) Forecast, by Application 2020 & 2033
- Table 85: United Arab Emirates Hydrogen Compressor Industry Revenue (Million) Forecast, by Application 2020 & 2033
- Table 86: United Arab Emirates Hydrogen Compressor Industry Volume (K Tons) Forecast, by Application 2020 & 2033
- Table 87: Nigeria Hydrogen Compressor Industry Revenue (Million) Forecast, by Application 2020 & 2033
- Table 88: Nigeria Hydrogen Compressor Industry Volume (K Tons) Forecast, by Application 2020 & 2033
- Table 89: Egypt Hydrogen Compressor Industry Revenue (Million) Forecast, by Application 2020 & 2033
- Table 90: Egypt Hydrogen Compressor Industry Volume (K Tons) Forecast, by Application 2020 & 2033
- Table 91: Rest of Middle East and Africa Hydrogen Compressor Industry Revenue (Million) Forecast, by Application 2020 & 2033
- Table 92: Rest of Middle East and Africa Hydrogen Compressor Industry Volume (K Tons) Forecast, by Application 2020 & 2033
- Table 93: Global Hydrogen Compressor Industry Revenue Million Forecast, by Technology 2020 & 2033
- Table 94: Global Hydrogen Compressor Industry Volume K Tons Forecast, by Technology 2020 & 2033
- Table 95: Global Hydrogen Compressor Industry Revenue Million Forecast, by Type 2020 & 2033
- Table 96: Global Hydrogen Compressor Industry Volume K Tons Forecast, by Type 2020 & 2033
- Table 97: Global Hydrogen Compressor Industry Revenue Million Forecast, by End-user Industry 2020 & 2033
- Table 98: Global Hydrogen Compressor Industry Volume K Tons Forecast, by End-user Industry 2020 & 2033
- Table 99: Global Hydrogen Compressor Industry Revenue Million Forecast, by Country 2020 & 2033
- Table 100: Global Hydrogen Compressor Industry Volume K Tons Forecast, by Country 2020 & 2033
- Table 101: Brazil Hydrogen Compressor Industry Revenue (Million) Forecast, by Application 2020 & 2033
- Table 102: Brazil Hydrogen Compressor Industry Volume (K Tons) Forecast, by Application 2020 & 2033
- Table 103: Argentina Hydrogen Compressor Industry Revenue (Million) Forecast, by Application 2020 & 2033
- Table 104: Argentina Hydrogen Compressor Industry Volume (K Tons) Forecast, by Application 2020 & 2033
- Table 105: Colombia Hydrogen Compressor Industry Revenue (Million) Forecast, by Application 2020 & 2033
- Table 106: Colombia Hydrogen Compressor Industry Volume (K Tons) Forecast, by Application 2020 & 2033
- Table 107: Rest of South America Hydrogen Compressor Industry Revenue (Million) Forecast, by Application 2020 & 2033
- Table 108: Rest of South America Hydrogen Compressor Industry Volume (K Tons) Forecast, by Application 2020 & 2033
Frequently Asked Questions
1. What is the projected Compound Annual Growth Rate (CAGR) of the Hydrogen Compressor Industry?
The projected CAGR is approximately 5.20%.
2. Which companies are prominent players in the Hydrogen Compressor Industry?
Key companies in the market include Haug Kompressoren AG, Corken Inc, Ariel Corporation, Sundyne Corp, Hydro-Pac Inc, Ingersoll Rand Inc *List Not Exhaustive 6 4 Market Ranking/Share (%) Analysi, Indian Compressors Ltd, Burckhardt Compression AG, Howden Group Ltd, Atlas Copco Group.
3. What are the main segments of the Hydrogen Compressor Industry?
The market segments include Technology, Type, End-user Industry.
4. Can you provide details about the market size?
The market size is estimated to be USD 1.7 Million as of 2022.
5. What are some drivers contributing to market growth?
4.; Increase in Demand for Hydrogen from End-user Industries4.; Increasing Deployment of Hydrogen Pipeline Infrastructure for Transportation.
6. What are the notable trends driving market growth?
Oil-based Segment Expected to Dominate the Market.
7. Are there any restraints impacting market growth?
4.; The Slowdown in Industrial and Economic Activities Due to a Sharp Decline in Manufacturing Activity and Global Trade.
8. Can you provide examples of recent developments in the market?
April 2024: MITSUI E&S Co. Ltd announced the beginning of the sale of high-flow hydrogen compressors tailored for hydrogen station facilities and hydrogen production equipment. The compressor can compress hydrogen to up to 50 MPa at a flow rate of 95 kg/h
9. What pricing options are available for accessing the report?
Pricing options include single-user, multi-user, and enterprise licenses priced at USD 4750, USD 5250, and USD 8750 respectively.
10. Is the market size provided in terms of value or volume?
The market size is provided in terms of value, measured in Million and volume, measured in K Tons.
11. Are there any specific market keywords associated with the report?
Yes, the market keyword associated with the report is "Hydrogen Compressor Industry," which aids in identifying and referencing the specific market segment covered.
12. How do I determine which pricing option suits my needs best?
The pricing options vary based on user requirements and access needs. Individual users may opt for single-user licenses, while businesses requiring broader access may choose multi-user or enterprise licenses for cost-effective access to the report.
13. Are there any additional resources or data provided in the Hydrogen Compressor Industry report?
While the report offers comprehensive insights, it's advisable to review the specific contents or supplementary materials provided to ascertain if additional resources or data are available.
14. How can I stay updated on further developments or reports in the Hydrogen Compressor Industry?
To stay informed about further developments, trends, and reports in the Hydrogen Compressor Industry, consider subscribing to industry newsletters, following relevant companies and organizations, or regularly checking reputable industry news sources and publications.
Methodology
Step 1 - Identification of Relevant Samples Size from Population Database


Step 2 - Approaches for Defining Global Market Size (Value, Volume* & Price*)

Note*: In applicable scenarios
Step 3 - Data Sources
Primary Research
- Web Analytics
- Survey Reports
- Research Institute
- Latest Research Reports
- Opinion Leaders
Secondary Research
- Annual Reports
- White Paper
- Latest Press Release
- Industry Association
- Paid Database
- Investor Presentations

Step 4 - Data Triangulation
Involves using different sources of information in order to increase the validity of a study
These sources are likely to be stakeholders in a program - participants, other researchers, program staff, other community members, and so on.
Then we put all data in single framework & apply various statistical tools to find out the dynamic on the market.
During the analysis stage, feedback from the stakeholder groups would be compared to determine areas of agreement as well as areas of divergence

