Key Insights
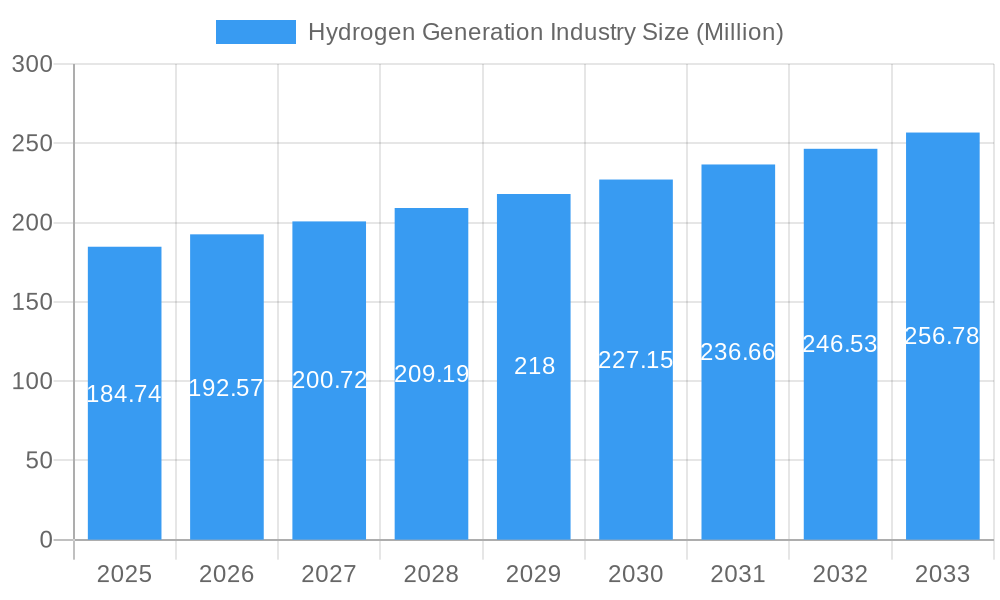
The global hydrogen generation market, valued at $184.74 million in 2025, is projected to experience robust growth, driven by increasing demand across diverse sectors and supportive government policies promoting clean energy transition. A compound annual growth rate (CAGR) of 4.23% from 2025 to 2033 indicates a significant expansion of the market. Key drivers include the growing need for cleaner energy sources in transportation, industrial processes (such as oil refining and steel production), and the burgeoning fuel cell technology sector. The shift towards renewable energy sources is fueling the adoption of green hydrogen, produced through electrolysis using renewable electricity, while blue hydrogen, produced from natural gas with carbon capture, offers a transitional solution. Technological advancements in steam methane reforming (SMR) and other hydrogen production methods are continuously improving efficiency and reducing costs, further accelerating market growth. However, the high initial investment costs associated with hydrogen generation facilities and the challenges related to hydrogen storage and transportation remain key restraints. The market is segmented by hydrogen color (blue, green, grey), production technology (SMR, coal gasification, others), and application (oil refining, chemical processing, iron & steel production, others). North America and Europe currently hold significant market shares, but the Asia-Pacific region is anticipated to witness rapid growth due to substantial investments in renewable energy infrastructure and industrial expansion.
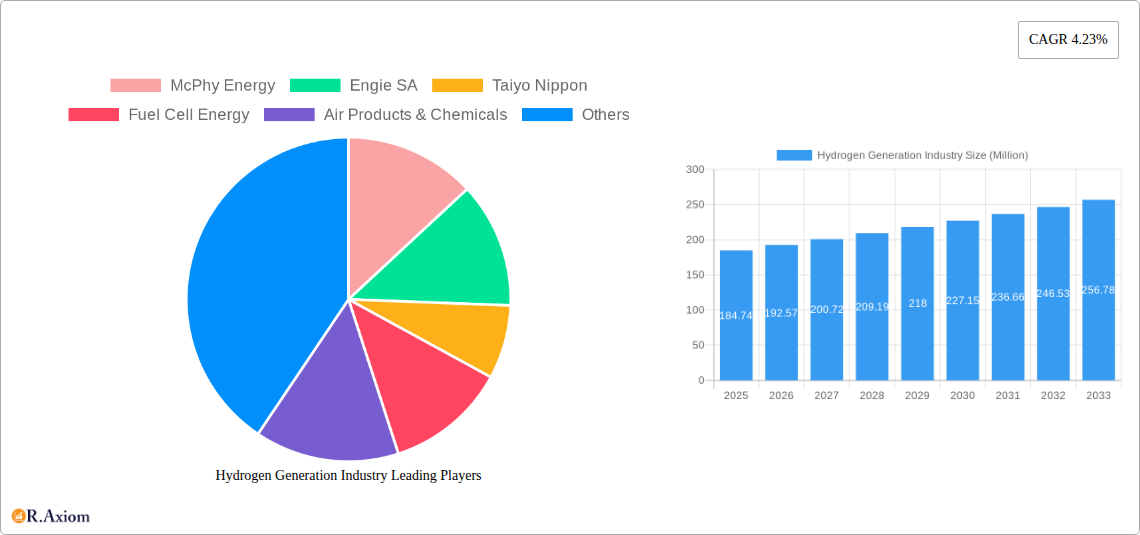
Hydrogen Generation Industry Market Size (In Million)
The competitive landscape is dynamic, featuring both established players like Air Products & Chemicals, Linde plc, and Air Liquide, and emerging companies such as ITM Power plc and Enapter. These companies are actively engaged in research and development, strategic partnerships, and capacity expansion to capitalize on the expanding market opportunities. The forecast period (2025-2033) anticipates a significant surge in demand, particularly for green hydrogen, as the world moves towards decarbonization targets. This will necessitate substantial investments in infrastructure and technology to ensure a reliable and cost-effective hydrogen supply chain. Successful market players will need to navigate the complexities of technological advancements, regulatory frameworks, and supply chain optimization to secure market share in this rapidly evolving sector.
Hydrogen Generation Industry Company Market Share
Hydrogen Generation Industry: A Comprehensive Market Report (2019-2033)
This in-depth report provides a comprehensive analysis of the global hydrogen generation industry, offering valuable insights for stakeholders across the value chain. The report covers the period from 2019 to 2033, with a focus on the forecast period of 2025-2033 and a base year of 2025. Market sizes are expressed in Millions.
Hydrogen Generation Industry Market Concentration & Innovation
The hydrogen generation industry is characterized by a mix of established players and emerging companies, leading to a moderately concentrated market. While giants like Air Products & Chemicals and Linde plc hold significant market share, a growing number of innovative startups are entering the fray. This competition is driving technological advancements and fostering innovation in hydrogen production methods. The market share of the top 5 players in 2025 is estimated at xx%. Mergers and acquisitions (M&A) are frequent, reflecting the industry's rapid consolidation. Recent M&A activity includes deals worth an estimated xx Million, primarily focused on acquiring companies with specialized technologies or expanding geographic reach.
- Market Concentration: Moderately concentrated, with top 5 players holding xx% market share in 2025.
- Innovation Drivers: Government incentives, rising demand for clean energy, technological breakthroughs in electrolysis.
- Regulatory Frameworks: Vary significantly across regions, impacting investment decisions and technology adoption.
- Product Substitutes: Limited direct substitutes, but competition exists from other clean energy sources like solar and wind.
- End-User Trends: Growing demand from industrial sectors like oil refining, chemical processing, and steel production.
- M&A Activity: Significant M&A activity in recent years, with deal values totaling xx Million in 2024.
Hydrogen Generation Industry Industry Trends & Insights
The hydrogen generation industry is experiencing explosive growth, driven by increasing concerns about climate change and the need for decarbonization. The global market is projected to reach xx Million by 2033, exhibiting a CAGR of xx% during the forecast period. This surge is fueled by supportive government policies, substantial investments in renewable energy infrastructure, and technological advancements leading to cost reductions in hydrogen production. The market penetration of green hydrogen is expected to increase significantly, surpassing xx% by 2033, driven by falling costs and improving efficiency of electrolyzer technologies. The competitive landscape is highly dynamic, with both established players and new entrants vying for market share through technological innovation, strategic partnerships, and geographic expansion. Consumer preferences are shifting towards sustainable and environmentally friendly hydrogen sources, creating a strong demand for green hydrogen.
Dominant Markets & Segments in Hydrogen Generation Industry
The hydrogen generation market is geographically diverse, with significant growth anticipated across multiple regions. However, certain regions and segments are currently dominating the market.
- Leading Region: Europe is currently a leading region due to strong government support and early adoption of hydrogen technologies. Asia-Pacific is poised for significant growth.
- Leading Country: Germany is a leading country driven by strong policy support and industrial demand. Other leading countries include the United States, Japan, and China.
- Dominant Source Segment: Grey hydrogen currently holds the largest market share due to its established infrastructure and lower cost. However, green hydrogen is rapidly gaining traction due to environmental concerns.
- Dominant Technology Segment: Steam Methane Reforming (SMR) remains the dominant technology due to its maturity and scalability, but electrolysis is quickly gaining prominence with technological advancements.
- Dominant Application Segment: Oil refining and chemical processing are major consumers of hydrogen, but demand is growing across various sectors, including iron & steel production.
Key Drivers:
- Economic policies: Government subsidies and tax incentives are crucial for boosting investment.
- Infrastructure development: Significant investment in pipelines and storage facilities is essential for market expansion.
Hydrogen Generation Industry Product Developments
Recent advancements in electrolysis technologies, particularly proton exchange membrane (PEM) electrolysis, are driving down production costs and improving efficiency. This, coupled with innovations in storage and transportation technologies, is expanding the applications of hydrogen across various sectors, including transportation, energy storage, and industrial processes. The focus is on developing cost-effective, scalable, and environmentally friendly hydrogen production methods, promoting the wider adoption of green hydrogen.
Report Scope & Segmentation Analysis
This report provides a detailed segmentation analysis of the hydrogen generation industry, encompassing various sources (blue, green, grey hydrogen), technologies (SMR, coal gasification, other technologies), and applications (oil refining, chemical processing, iron & steel production, other applications). Growth projections, market sizes, and competitive dynamics are provided for each segment, offering a comprehensive understanding of the market landscape. For example, the green hydrogen segment is projected to grow at a CAGR of xx% during the forecast period, driven by increasing environmental concerns and government policies.
Key Drivers of Hydrogen Generation Industry Growth
Several factors are driving the growth of the hydrogen generation industry. These include stringent environmental regulations aimed at reducing carbon emissions, increasing demand for clean energy, technological advancements leading to cost reductions in hydrogen production, and significant investments from governments and private companies. Government support through subsidies, tax incentives, and policy frameworks is creating a favorable investment climate, while technological advancements in electrolysis are significantly lowering production costs.
Challenges in the Hydrogen Generation Industry Sector
Despite its promising future, the hydrogen generation industry faces several challenges. High initial investment costs for green hydrogen production facilities remain a barrier to widespread adoption. Furthermore, the lack of adequate infrastructure for hydrogen storage, transportation, and distribution hinders broader market penetration. The intermittency of renewable energy sources used in green hydrogen production also presents a challenge. These factors, along with competition from other energy sources, create significant hurdles for industry growth.
Emerging Opportunities in Hydrogen Generation Industry
The hydrogen generation industry presents several emerging opportunities. The development of new and efficient electrolysis technologies, along with advancements in hydrogen storage and transportation, will open new markets and applications. Growing demand from various sectors, including transportation and energy storage, presents significant opportunities for expansion. Furthermore, opportunities exist in developing robust and efficient hydrogen supply chains. The use of hydrogen as a decarbonization solution in heavy industry sectors is expected to drive significant growth.
Leading Players in the Hydrogen Generation Industry Market
- McPhy Energy
- Engie SA
- Taiyo Nippon Sanso Corporation
- FuelCell Energy
- Air Products & Chemicals
- Linde plc
- Cummins Inc.
- Messer Group GmbH
- Air Liquide
- ITM Power plc
- Enapter
Key Developments in Hydrogen Generation Industry Industry
- October 2023: H2B2 unveils a green hydrogen plant (SoHyCal) in Fresno, California, using PEM technology.
- October 2023: Hygenco Green Energies announces plans for a green H2 gas plant in Maharashtra, India, supplying Sterlite Technologies.
- May 2023: RWE and Westfalen Group plan to develop up to 70 hydrogen stations in Germany by 2030.
Strategic Outlook for Hydrogen Generation Industry Market
The hydrogen generation industry is poised for significant growth, driven by increasing demand for clean energy and supportive government policies. The continuous improvement in electrolysis technology and the development of cost-effective green hydrogen production methods will be key catalysts for market expansion. Further investments in infrastructure and strategic partnerships are vital to unlock the full potential of this market, paving the way for a sustainable energy future.
Hydrogen Generation Industry Segmentation
-
1. Source
- 1.1. Blue hydrogen
- 1.2. Green hydrogen
- 1.3. Grey Hydrogen
-
2. Technology
- 2.1. Steam Methane Reforming (SMR)
- 2.2. Coal Gasification
- 2.3. Other Technologies
-
3. Application
- 3.1. Oil Refining
- 3.2. Chemical Processing
- 3.3. Iron & Steel Production
- 3.4. Other Applications
Hydrogen Generation Industry Segmentation By Geography
-
1. North America
- 1.1. United States
- 1.2. Canada
- 1.3. Rest of North America
-
2. Europe
- 2.1. Germany
- 2.2. France
- 2.3. Italy
- 2.4. United Kingdom
- 2.5. Russian Federation
- 2.6. Rest of Europe
- 3. Middle East
-
4. Saudi Arabia
- 4.1. United Arab Emirates
- 4.2. South Africa
- 4.3. Rest of Middle East and Africa
-
5. Asia Pacific
- 5.1. China
- 5.2. India
- 5.3. Japan
- 5.4. South Korea
- 5.5. Rest of Asia Pacific
-
6. South America
- 6.1. Brazil
- 6.2. Argentina
- 6.3. Rest of South America
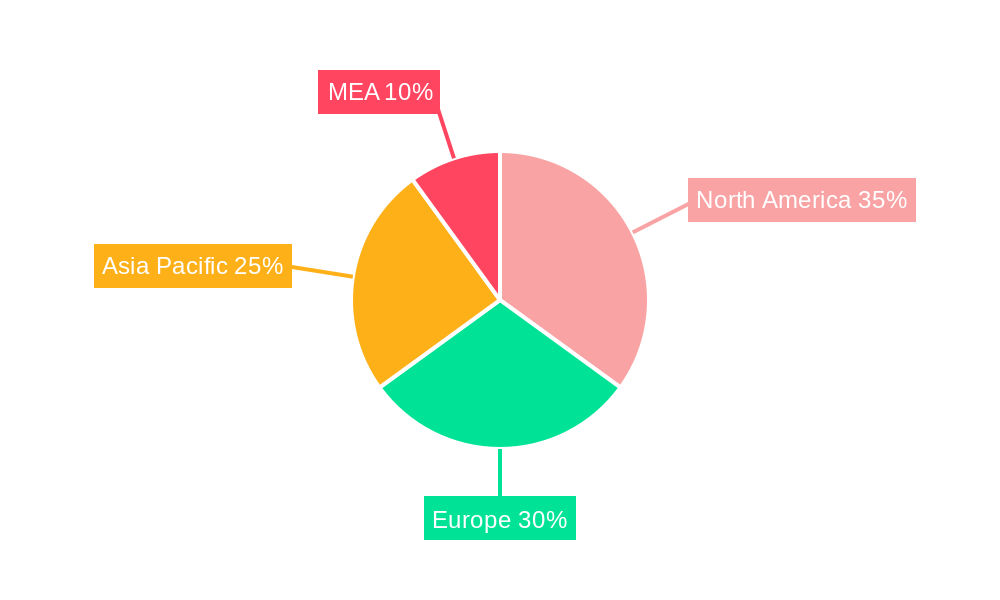
Hydrogen Generation Industry Regional Market Share
Geographic Coverage of Hydrogen Generation Industry
Hydrogen Generation Industry REPORT HIGHLIGHTS
| Aspects | Details |
|---|---|
| Study Period | 2020-2034 |
| Base Year | 2025 |
| Estimated Year | 2026 |
| Forecast Period | 2026-2034 |
| Historical Period | 2020-2025 |
| Growth Rate | CAGR of 4.23% from 2020-2034 |
| Segmentation |
|
Table of Contents
- 1. Introduction
- 1.1. Research Scope
- 1.2. Market Segmentation
- 1.3. Research Objective
- 1.4. Definitions and Assumptions
- 2. Executive Summary
- 2.1. Market Snapshot
- 3. Market Dynamics
- 3.1. Market Drivers
- 3.2. Market Restrains
- 3.3. Market Trends
- 3.4. Market Opportunities
- 4. Market Factor Analysis
- 4.1. Porters Five Forces
- 4.1.1. Bargaining Power of Suppliers
- 4.1.2. Bargaining Power of Buyers
- 4.1.3. Threat of New Entrants
- 4.1.4. Threat of Substitutes
- 4.1.5. Competitive Rivalry
- 4.2. PESTEL analysis
- 4.3. BCG Analysis
- 4.3.1. Stars (High Growth, High Market Share)
- 4.3.2. Cash Cows (Low Growth, High Market Share)
- 4.3.3. Question Mark (High Growth, Low Market Share)
- 4.3.4. Dogs (Low Growth, Low Market Share)
- 4.4. Ansoff Matrix Analysis
- 4.5. Supply Chain Analysis
- 4.6. Regulatory Landscape
- 4.7. Current Market Potential and Opportunity Assessment (TAM–SAM–SOM Framework)
- 4.8. RAX Analyst Note
- 4.1. Porters Five Forces
- 5. Market Analysis, Insights and Forecast 2021-2033
- 5.1. Market Analysis, Insights and Forecast - by Source
- 5.1.1. Blue hydrogen
- 5.1.2. Green hydrogen
- 5.1.3. Grey Hydrogen
- 5.2. Market Analysis, Insights and Forecast - by Technology
- 5.2.1. Steam Methane Reforming (SMR)
- 5.2.2. Coal Gasification
- 5.2.3. Other Technologies
- 5.3. Market Analysis, Insights and Forecast - by Application
- 5.3.1. Oil Refining
- 5.3.2. Chemical Processing
- 5.3.3. Iron & Steel Production
- 5.3.4. Other Applications
- 5.4. Market Analysis, Insights and Forecast - by Region
- 5.4.1. North America
- 5.4.2. Europe
- 5.4.3. Middle East
- 5.4.4. Saudi Arabia
- 5.4.5. Asia Pacific
- 5.4.6. South America
- 5.1. Market Analysis, Insights and Forecast - by Source
- 6. Global Hydrogen Generation Industry Analysis, Insights and Forecast, 2021-2033
- 6.1. Market Analysis, Insights and Forecast - by Source
- 6.1.1. Blue hydrogen
- 6.1.2. Green hydrogen
- 6.1.3. Grey Hydrogen
- 6.2. Market Analysis, Insights and Forecast - by Technology
- 6.2.1. Steam Methane Reforming (SMR)
- 6.2.2. Coal Gasification
- 6.2.3. Other Technologies
- 6.3. Market Analysis, Insights and Forecast - by Application
- 6.3.1. Oil Refining
- 6.3.2. Chemical Processing
- 6.3.3. Iron & Steel Production
- 6.3.4. Other Applications
- 6.1. Market Analysis, Insights and Forecast - by Source
- 7. North America Hydrogen Generation Industry Analysis, Insights and Forecast, 2020-2032
- 7.1. Market Analysis, Insights and Forecast - by Source
- 7.1.1. Blue hydrogen
- 7.1.2. Green hydrogen
- 7.1.3. Grey Hydrogen
- 7.2. Market Analysis, Insights and Forecast - by Technology
- 7.2.1. Steam Methane Reforming (SMR)
- 7.2.2. Coal Gasification
- 7.2.3. Other Technologies
- 7.3. Market Analysis, Insights and Forecast - by Application
- 7.3.1. Oil Refining
- 7.3.2. Chemical Processing
- 7.3.3. Iron & Steel Production
- 7.3.4. Other Applications
- 7.1. Market Analysis, Insights and Forecast - by Source
- 8. Europe Hydrogen Generation Industry Analysis, Insights and Forecast, 2020-2032
- 8.1. Market Analysis, Insights and Forecast - by Source
- 8.1.1. Blue hydrogen
- 8.1.2. Green hydrogen
- 8.1.3. Grey Hydrogen
- 8.2. Market Analysis, Insights and Forecast - by Technology
- 8.2.1. Steam Methane Reforming (SMR)
- 8.2.2. Coal Gasification
- 8.2.3. Other Technologies
- 8.3. Market Analysis, Insights and Forecast - by Application
- 8.3.1. Oil Refining
- 8.3.2. Chemical Processing
- 8.3.3. Iron & Steel Production
- 8.3.4. Other Applications
- 8.1. Market Analysis, Insights and Forecast - by Source
- 9. Middle East Hydrogen Generation Industry Analysis, Insights and Forecast, 2020-2032
- 9.1. Market Analysis, Insights and Forecast - by Source
- 9.1.1. Blue hydrogen
- 9.1.2. Green hydrogen
- 9.1.3. Grey Hydrogen
- 9.2. Market Analysis, Insights and Forecast - by Technology
- 9.2.1. Steam Methane Reforming (SMR)
- 9.2.2. Coal Gasification
- 9.2.3. Other Technologies
- 9.3. Market Analysis, Insights and Forecast - by Application
- 9.3.1. Oil Refining
- 9.3.2. Chemical Processing
- 9.3.3. Iron & Steel Production
- 9.3.4. Other Applications
- 9.1. Market Analysis, Insights and Forecast - by Source
- 10. Saudi Arabia Hydrogen Generation Industry Analysis, Insights and Forecast, 2020-2032
- 10.1. Market Analysis, Insights and Forecast - by Source
- 10.1.1. Blue hydrogen
- 10.1.2. Green hydrogen
- 10.1.3. Grey Hydrogen
- 10.2. Market Analysis, Insights and Forecast - by Technology
- 10.2.1. Steam Methane Reforming (SMR)
- 10.2.2. Coal Gasification
- 10.2.3. Other Technologies
- 10.3. Market Analysis, Insights and Forecast - by Application
- 10.3.1. Oil Refining
- 10.3.2. Chemical Processing
- 10.3.3. Iron & Steel Production
- 10.3.4. Other Applications
- 10.1. Market Analysis, Insights and Forecast - by Source
- 11. Asia Pacific Hydrogen Generation Industry Analysis, Insights and Forecast, 2020-2032
- 11.1. Market Analysis, Insights and Forecast - by Source
- 11.1.1. Blue hydrogen
- 11.1.2. Green hydrogen
- 11.1.3. Grey Hydrogen
- 11.2. Market Analysis, Insights and Forecast - by Technology
- 11.2.1. Steam Methane Reforming (SMR)
- 11.2.2. Coal Gasification
- 11.2.3. Other Technologies
- 11.3. Market Analysis, Insights and Forecast - by Application
- 11.3.1. Oil Refining
- 11.3.2. Chemical Processing
- 11.3.3. Iron & Steel Production
- 11.3.4. Other Applications
- 11.1. Market Analysis, Insights and Forecast - by Source
- 12. South America Hydrogen Generation Industry Analysis, Insights and Forecast, 2020-2032
- 12.1. Market Analysis, Insights and Forecast - by Source
- 12.1.1. Blue hydrogen
- 12.1.2. Green hydrogen
- 12.1.3. Grey Hydrogen
- 12.2. Market Analysis, Insights and Forecast - by Technology
- 12.2.1. Steam Methane Reforming (SMR)
- 12.2.2. Coal Gasification
- 12.2.3. Other Technologies
- 12.3. Market Analysis, Insights and Forecast - by Application
- 12.3.1. Oil Refining
- 12.3.2. Chemical Processing
- 12.3.3. Iron & Steel Production
- 12.3.4. Other Applications
- 12.1. Market Analysis, Insights and Forecast - by Source
- 13. Competitive Analysis
- 13.1. Company Profiles
- 13.1.1 McPhy Energy
- 13.1.1.1. Company Overview
- 13.1.1.2. Products
- 13.1.1.3. Company Financials
- 13.1.1.4. SWOT Analysis
- 13.1.2 Engie SA
- 13.1.2.1. Company Overview
- 13.1.2.2. Products
- 13.1.2.3. Company Financials
- 13.1.2.4. SWOT Analysis
- 13.1.3 Taiyo Nippon
- 13.1.3.1. Company Overview
- 13.1.3.2. Products
- 13.1.3.3. Company Financials
- 13.1.3.4. SWOT Analysis
- 13.1.4 Fuel Cell Energy
- 13.1.4.1. Company Overview
- 13.1.4.2. Products
- 13.1.4.3. Company Financials
- 13.1.4.4. SWOT Analysis
- 13.1.5 Air Products & Chemicals
- 13.1.5.1. Company Overview
- 13.1.5.2. Products
- 13.1.5.3. Company Financials
- 13.1.5.4. SWOT Analysis
- 13.1.6 Linde plc
- 13.1.6.1. Company Overview
- 13.1.6.2. Products
- 13.1.6.3. Company Financials
- 13.1.6.4. SWOT Analysis
- 13.1.7 Cummins
- 13.1.7.1. Company Overview
- 13.1.7.2. Products
- 13.1.7.3. Company Financials
- 13.1.7.4. SWOT Analysis
- 13.1.8 Messer Group GmbH
- 13.1.8.1. Company Overview
- 13.1.8.2. Products
- 13.1.8.3. Company Financials
- 13.1.8.4. SWOT Analysis
- 13.1.9 Air Liquide
- 13.1.9.1. Company Overview
- 13.1.9.2. Products
- 13.1.9.3. Company Financials
- 13.1.9.4. SWOT Analysis
- 13.1.10 ITM Power plc
- 13.1.10.1. Company Overview
- 13.1.10.2. Products
- 13.1.10.3. Company Financials
- 13.1.10.4. SWOT Analysis
- 13.1.11 Enapter
- 13.1.11.1. Company Overview
- 13.1.11.2. Products
- 13.1.11.3. Company Financials
- 13.1.11.4. SWOT Analysis
- 13.1.1 McPhy Energy
- 13.2. Market Entropy
- 13.2.1 Company's Key Areas Served
- 13.2.2 Recent Developments
- 13.3. Company Market Share Analysis 2025
- 13.3.1 Top 5 Companies Market Share Analysis
- 13.3.2 Top 3 Companies Market Share Analysis
- 13.4. List of Potential Customers
- 14. Research Methodology
List of Figures
- Figure 1: Global Hydrogen Generation Industry Revenue Breakdown (Million, %) by Region 2025 & 2033
- Figure 2: North America Hydrogen Generation Industry Revenue (Million), by Source 2025 & 2033
- Figure 3: North America Hydrogen Generation Industry Revenue Share (%), by Source 2025 & 2033
- Figure 4: North America Hydrogen Generation Industry Revenue (Million), by Technology 2025 & 2033
- Figure 5: North America Hydrogen Generation Industry Revenue Share (%), by Technology 2025 & 2033
- Figure 6: North America Hydrogen Generation Industry Revenue (Million), by Application 2025 & 2033
- Figure 7: North America Hydrogen Generation Industry Revenue Share (%), by Application 2025 & 2033
- Figure 8: North America Hydrogen Generation Industry Revenue (Million), by Country 2025 & 2033
- Figure 9: North America Hydrogen Generation Industry Revenue Share (%), by Country 2025 & 2033
- Figure 10: Europe Hydrogen Generation Industry Revenue (Million), by Source 2025 & 2033
- Figure 11: Europe Hydrogen Generation Industry Revenue Share (%), by Source 2025 & 2033
- Figure 12: Europe Hydrogen Generation Industry Revenue (Million), by Technology 2025 & 2033
- Figure 13: Europe Hydrogen Generation Industry Revenue Share (%), by Technology 2025 & 2033
- Figure 14: Europe Hydrogen Generation Industry Revenue (Million), by Application 2025 & 2033
- Figure 15: Europe Hydrogen Generation Industry Revenue Share (%), by Application 2025 & 2033
- Figure 16: Europe Hydrogen Generation Industry Revenue (Million), by Country 2025 & 2033
- Figure 17: Europe Hydrogen Generation Industry Revenue Share (%), by Country 2025 & 2033
- Figure 18: Middle East Hydrogen Generation Industry Revenue (Million), by Source 2025 & 2033
- Figure 19: Middle East Hydrogen Generation Industry Revenue Share (%), by Source 2025 & 2033
- Figure 20: Middle East Hydrogen Generation Industry Revenue (Million), by Technology 2025 & 2033
- Figure 21: Middle East Hydrogen Generation Industry Revenue Share (%), by Technology 2025 & 2033
- Figure 22: Middle East Hydrogen Generation Industry Revenue (Million), by Application 2025 & 2033
- Figure 23: Middle East Hydrogen Generation Industry Revenue Share (%), by Application 2025 & 2033
- Figure 24: Middle East Hydrogen Generation Industry Revenue (Million), by Country 2025 & 2033
- Figure 25: Middle East Hydrogen Generation Industry Revenue Share (%), by Country 2025 & 2033
- Figure 26: Saudi Arabia Hydrogen Generation Industry Revenue (Million), by Source 2025 & 2033
- Figure 27: Saudi Arabia Hydrogen Generation Industry Revenue Share (%), by Source 2025 & 2033
- Figure 28: Saudi Arabia Hydrogen Generation Industry Revenue (Million), by Technology 2025 & 2033
- Figure 29: Saudi Arabia Hydrogen Generation Industry Revenue Share (%), by Technology 2025 & 2033
- Figure 30: Saudi Arabia Hydrogen Generation Industry Revenue (Million), by Application 2025 & 2033
- Figure 31: Saudi Arabia Hydrogen Generation Industry Revenue Share (%), by Application 2025 & 2033
- Figure 32: Saudi Arabia Hydrogen Generation Industry Revenue (Million), by Country 2025 & 2033
- Figure 33: Saudi Arabia Hydrogen Generation Industry Revenue Share (%), by Country 2025 & 2033
- Figure 34: Asia Pacific Hydrogen Generation Industry Revenue (Million), by Source 2025 & 2033
- Figure 35: Asia Pacific Hydrogen Generation Industry Revenue Share (%), by Source 2025 & 2033
- Figure 36: Asia Pacific Hydrogen Generation Industry Revenue (Million), by Technology 2025 & 2033
- Figure 37: Asia Pacific Hydrogen Generation Industry Revenue Share (%), by Technology 2025 & 2033
- Figure 38: Asia Pacific Hydrogen Generation Industry Revenue (Million), by Application 2025 & 2033
- Figure 39: Asia Pacific Hydrogen Generation Industry Revenue Share (%), by Application 2025 & 2033
- Figure 40: Asia Pacific Hydrogen Generation Industry Revenue (Million), by Country 2025 & 2033
- Figure 41: Asia Pacific Hydrogen Generation Industry Revenue Share (%), by Country 2025 & 2033
- Figure 42: South America Hydrogen Generation Industry Revenue (Million), by Source 2025 & 2033
- Figure 43: South America Hydrogen Generation Industry Revenue Share (%), by Source 2025 & 2033
- Figure 44: South America Hydrogen Generation Industry Revenue (Million), by Technology 2025 & 2033
- Figure 45: South America Hydrogen Generation Industry Revenue Share (%), by Technology 2025 & 2033
- Figure 46: South America Hydrogen Generation Industry Revenue (Million), by Application 2025 & 2033
- Figure 47: South America Hydrogen Generation Industry Revenue Share (%), by Application 2025 & 2033
- Figure 48: South America Hydrogen Generation Industry Revenue (Million), by Country 2025 & 2033
- Figure 49: South America Hydrogen Generation Industry Revenue Share (%), by Country 2025 & 2033
List of Tables
- Table 1: Global Hydrogen Generation Industry Revenue Million Forecast, by Source 2020 & 2033
- Table 2: Global Hydrogen Generation Industry Revenue Million Forecast, by Technology 2020 & 2033
- Table 3: Global Hydrogen Generation Industry Revenue Million Forecast, by Application 2020 & 2033
- Table 4: Global Hydrogen Generation Industry Revenue Million Forecast, by Region 2020 & 2033
- Table 5: Global Hydrogen Generation Industry Revenue Million Forecast, by Source 2020 & 2033
- Table 6: Global Hydrogen Generation Industry Revenue Million Forecast, by Technology 2020 & 2033
- Table 7: Global Hydrogen Generation Industry Revenue Million Forecast, by Application 2020 & 2033
- Table 8: Global Hydrogen Generation Industry Revenue Million Forecast, by Country 2020 & 2033
- Table 9: United States Hydrogen Generation Industry Revenue (Million) Forecast, by Application 2020 & 2033
- Table 10: Canada Hydrogen Generation Industry Revenue (Million) Forecast, by Application 2020 & 2033
- Table 11: Rest of North America Hydrogen Generation Industry Revenue (Million) Forecast, by Application 2020 & 2033
- Table 12: Global Hydrogen Generation Industry Revenue Million Forecast, by Source 2020 & 2033
- Table 13: Global Hydrogen Generation Industry Revenue Million Forecast, by Technology 2020 & 2033
- Table 14: Global Hydrogen Generation Industry Revenue Million Forecast, by Application 2020 & 2033
- Table 15: Global Hydrogen Generation Industry Revenue Million Forecast, by Country 2020 & 2033
- Table 16: Germany Hydrogen Generation Industry Revenue (Million) Forecast, by Application 2020 & 2033
- Table 17: France Hydrogen Generation Industry Revenue (Million) Forecast, by Application 2020 & 2033
- Table 18: Italy Hydrogen Generation Industry Revenue (Million) Forecast, by Application 2020 & 2033
- Table 19: United Kingdom Hydrogen Generation Industry Revenue (Million) Forecast, by Application 2020 & 2033
- Table 20: Russian Federation Hydrogen Generation Industry Revenue (Million) Forecast, by Application 2020 & 2033
- Table 21: Rest of Europe Hydrogen Generation Industry Revenue (Million) Forecast, by Application 2020 & 2033
- Table 22: Global Hydrogen Generation Industry Revenue Million Forecast, by Source 2020 & 2033
- Table 23: Global Hydrogen Generation Industry Revenue Million Forecast, by Technology 2020 & 2033
- Table 24: Global Hydrogen Generation Industry Revenue Million Forecast, by Application 2020 & 2033
- Table 25: Global Hydrogen Generation Industry Revenue Million Forecast, by Country 2020 & 2033
- Table 26: Global Hydrogen Generation Industry Revenue Million Forecast, by Source 2020 & 2033
- Table 27: Global Hydrogen Generation Industry Revenue Million Forecast, by Technology 2020 & 2033
- Table 28: Global Hydrogen Generation Industry Revenue Million Forecast, by Application 2020 & 2033
- Table 29: Global Hydrogen Generation Industry Revenue Million Forecast, by Country 2020 & 2033
- Table 30: United Arab Emirates Hydrogen Generation Industry Revenue (Million) Forecast, by Application 2020 & 2033
- Table 31: South Africa Hydrogen Generation Industry Revenue (Million) Forecast, by Application 2020 & 2033
- Table 32: Rest of Middle East and Africa Hydrogen Generation Industry Revenue (Million) Forecast, by Application 2020 & 2033
- Table 33: Global Hydrogen Generation Industry Revenue Million Forecast, by Source 2020 & 2033
- Table 34: Global Hydrogen Generation Industry Revenue Million Forecast, by Technology 2020 & 2033
- Table 35: Global Hydrogen Generation Industry Revenue Million Forecast, by Application 2020 & 2033
- Table 36: Global Hydrogen Generation Industry Revenue Million Forecast, by Country 2020 & 2033
- Table 37: China Hydrogen Generation Industry Revenue (Million) Forecast, by Application 2020 & 2033
- Table 38: India Hydrogen Generation Industry Revenue (Million) Forecast, by Application 2020 & 2033
- Table 39: Japan Hydrogen Generation Industry Revenue (Million) Forecast, by Application 2020 & 2033
- Table 40: South Korea Hydrogen Generation Industry Revenue (Million) Forecast, by Application 2020 & 2033
- Table 41: Rest of Asia Pacific Hydrogen Generation Industry Revenue (Million) Forecast, by Application 2020 & 2033
- Table 42: Global Hydrogen Generation Industry Revenue Million Forecast, by Source 2020 & 2033
- Table 43: Global Hydrogen Generation Industry Revenue Million Forecast, by Technology 2020 & 2033
- Table 44: Global Hydrogen Generation Industry Revenue Million Forecast, by Application 2020 & 2033
- Table 45: Global Hydrogen Generation Industry Revenue Million Forecast, by Country 2020 & 2033
- Table 46: Brazil Hydrogen Generation Industry Revenue (Million) Forecast, by Application 2020 & 2033
- Table 47: Argentina Hydrogen Generation Industry Revenue (Million) Forecast, by Application 2020 & 2033
- Table 48: Rest of South America Hydrogen Generation Industry Revenue (Million) Forecast, by Application 2020 & 2033
Frequently Asked Questions
1. What is the projected Compound Annual Growth Rate (CAGR) of the Hydrogen Generation Industry?
The projected CAGR is approximately 4.23%.
2. Which companies are prominent players in the Hydrogen Generation Industry?
Key companies in the market include McPhy Energy, Engie SA, Taiyo Nippon, Fuel Cell Energy, Air Products & Chemicals, Linde plc, Cummins, Messer Group GmbH, Air Liquide, ITM Power plc, Enapter.
3. What are the main segments of the Hydrogen Generation Industry?
The market segments include Source, Technology, Application.
4. Can you provide details about the market size?
The market size is estimated to be USD 184.74 Million as of 2022.
5. What are some drivers contributing to market growth?
4.; Favorable Government Policies4.; Increasing Demand From Refinery and Industrial Sector.
6. What are the notable trends driving market growth?
Oil Refining Segment Expected to Dominate the Market.
7. Are there any restraints impacting market growth?
4.; Higher Production Cost.
8. Can you provide examples of recent developments in the market?
October 2023: H2B2, a technology company with a portfolio in Hydrogen production systems, unveiled the green hydrogen plant, which is expected to become operational in North America, the SoHyCal facility located in Fresno, California, United States. The project envisages 100 percent clean hydrogen production using PEM technology.
9. What pricing options are available for accessing the report?
Pricing options include single-user, multi-user, and enterprise licenses priced at USD 4750, USD 5250, and USD 8750 respectively.
10. Is the market size provided in terms of value or volume?
The market size is provided in terms of value, measured in Million.
11. Are there any specific market keywords associated with the report?
Yes, the market keyword associated with the report is "Hydrogen Generation Industry," which aids in identifying and referencing the specific market segment covered.
12. How do I determine which pricing option suits my needs best?
The pricing options vary based on user requirements and access needs. Individual users may opt for single-user licenses, while businesses requiring broader access may choose multi-user or enterprise licenses for cost-effective access to the report.
13. Are there any additional resources or data provided in the Hydrogen Generation Industry report?
While the report offers comprehensive insights, it's advisable to review the specific contents or supplementary materials provided to ascertain if additional resources or data are available.
14. How can I stay updated on further developments or reports in the Hydrogen Generation Industry?
To stay informed about further developments, trends, and reports in the Hydrogen Generation Industry, consider subscribing to industry newsletters, following relevant companies and organizations, or regularly checking reputable industry news sources and publications.
Methodology
Step 1 - Identification of Relevant Samples Size from Population Database


Step 2 - Approaches for Defining Global Market Size (Value, Volume* & Price*)

Note*: In applicable scenarios
Step 3 - Data Sources
Primary Research
- Web Analytics
- Survey Reports
- Research Institute
- Latest Research Reports
- Opinion Leaders
Secondary Research
- Annual Reports
- White Paper
- Latest Press Release
- Industry Association
- Paid Database
- Investor Presentations

Step 4 - Data Triangulation
Involves using different sources of information in order to increase the validity of a study
These sources are likely to be stakeholders in a program - participants, other researchers, program staff, other community members, and so on.
Then we put all data in single framework & apply various statistical tools to find out the dynamic on the market.
During the analysis stage, feedback from the stakeholder groups would be compared to determine areas of agreement as well as areas of divergence

