

Key Insights
The global Hydropower Generation Market is set for sustained expansion, fueled by increasing demand for clean, renewable energy. With a current market size of $116.09 billion and a Compound Annual Growth Rate (CAGR) of 0.99%, the market is projected to reach approximately $116.09 billion by 2025. This stable growth underscores hydropower's vital role in the global energy mix, providing reliable and dispatchable renewable power. Key growth drivers include government initiatives supporting sustainable energy, the imperative to diversify energy sources away from fossil fuels, and the inherent efficiency and longevity of hydropower facilities. The market comprises various segments, with Large Hydropower (over 100 MW) leading due to its substantial generation capacity. Small Hydropower (under 10 MW) is also gaining traction, particularly in areas with ample smaller water resources and a focus on decentralized energy solutions. The "Other Sizes (10-100 MW)" segment represents a significant portion of capacity.
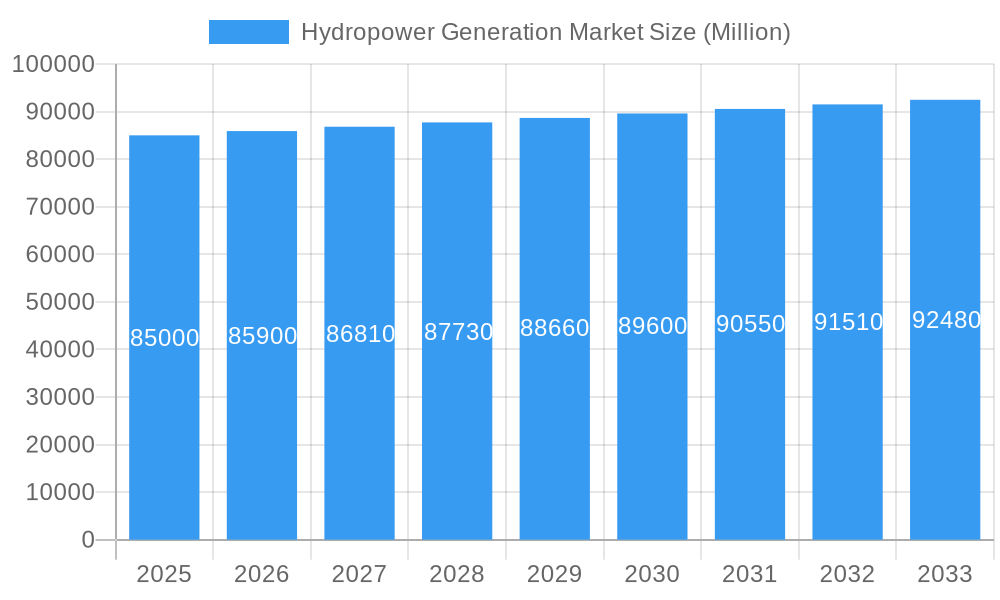
Hydropower Generation Market Market Size (In Billion)
Key industry players include Iberdrola SA, China Yangtze Power Co Ltd, Voith GmbH & Co KGaA, PJSC RusHydro, Siemens Energy AG, GE Renewable Energy, Andritz AG, and Électricité de France SA (EDF). These companies are actively engaged in hydropower project development, operation, and technological innovation. Market trends include substantial investments in upgrading existing infrastructure for improved efficiency and environmental performance, the development of pumped-storage hydropower for grid stability and energy storage, and a growing emphasis on integrating hydropower with other renewables like solar and wind. Market restraints encompass high initial capital costs for new projects, environmental concerns related to dam construction and river ecosystems, and geographical limitations for suitable sites. Regionally, Asia Pacific, led by China and India, is anticipated to be a major growth driver due to escalating energy demand and significant investments in renewable infrastructure. North America and Europe remain key markets, focusing on modernizing existing facilities and exploring pumped-storage solutions.
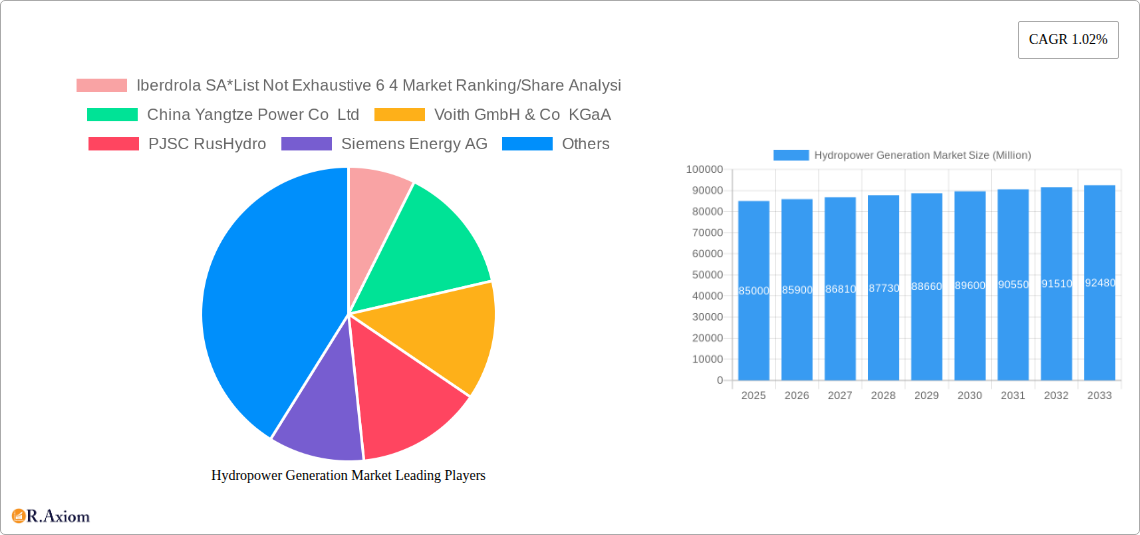
Hydropower Generation Market Company Market Share
Hydropower Generation Market: Comprehensive Market Analysis and Future Outlook (2019–2033)
This in-depth report provides a strategic analysis of the global Hydropower Generation Market, covering market size, segmentation, trends, drivers, challenges, and competitive landscape from 2019–2024 (historical) to 2025–2033 (forecast), with 2025 as the base and estimated year. Leveraging high-traffic keywords like "hydropower market," "renewable energy," "hydroelectric power," and "clean energy generation," this report is optimized for search engines and designed to deliver actionable insights for industry stakeholders. We cover critical segments including Large Hydropower (> 100 MW), Small Hydropower (< 10 MW), and Other Sizes (10-100 MW), and analyze the impact of key players such as Iberdrola SA, China Yangtze Power Co Ltd, Voith GmbH & Co KGaA, PJSC RusHydro, Siemens Energy AG, GE Renewable Energy, Andritz AG, and Électricité de France SA (EDF).
Hydropower Generation Market Market Concentration & Innovation
The Hydropower Generation Market is characterized by a moderate level of concentration, with several large, established players holding significant market share. For instance, in 2025, the combined market share of the top 6 companies is estimated to be 64%. Innovation is a key driver, fueled by advancements in turbine technology, dam construction techniques, and digital solutions for operational efficiency and grid integration. Regulatory frameworks play a crucial role, with government incentives, environmental regulations, and international climate agreements shaping investment and development. Product substitutes, primarily from solar and wind power, are becoming increasingly competitive, though hydropower's inherent advantages in grid stability and baseload power provision remain significant. End-user trends indicate a growing demand for reliable and clean energy sources, with a particular focus on reducing carbon footprints. Mergers and acquisitions (M&A) activity is anticipated to continue, with deal values in the range of hundreds of millions, as companies seek to consolidate their market position and expand their renewable energy portfolios.
- Market Share Analysis (2025 Estimate):
- Top 6 Companies: 64%
- Key Competitors: Iberdrola SA, China Yangtze Power Co Ltd, Voith GmbH & Co KGaA, PJSC RusHydro, Siemens Energy AG, GE Renewable Energy, Andritz AG, Électricité de France SA (EDF).
- Innovation Focus Areas:
- Improved turbine efficiency and durability.
- Advanced dam safety and monitoring systems.
- Integration of smart grid technologies.
- Solutions for pumped-storage hydropower.
- Regulatory Impact:
- Supportive policies for renewable energy deployment.
- Stricter environmental impact assessments.
- International agreements promoting decarbonization.
Hydropower Generation Market Industry Trends & Insights
The Hydropower Generation Market is experiencing robust growth, driven by the global imperative for sustainable energy solutions and the increasing demand for reliable, baseload renewable power. The Compound Annual Growth Rate (CAGR) for the forecast period (2025–2033) is projected to be approximately 5.2%, reflecting a strong market penetration of hydropower as a critical component of diverse energy portfolios. Technological advancements continue to reshape the industry, with innovations in turbine design, materials science, and digital monitoring enhancing efficiency and reducing operational costs. For example, advancements in variable-speed turbines and digital twins are optimizing power output and predictive maintenance. Consumer preferences are increasingly leaning towards clean energy, pushing utilities and governments to invest in low-carbon generation sources, where hydropower excels. Competitive dynamics are intensifying, not only among traditional hydropower developers but also with emerging players in the broader renewable energy sector, including advanced battery storage solutions that can complement intermittent sources. The market penetration of hydropower is expected to grow as nations seek to achieve their renewable energy targets and energy independence.
- Growth Catalysts:
- Increasing global electricity demand.
- Government mandates and incentives for renewable energy.
- Declining costs of renewable energy technologies.
- Energy security concerns driving diversified energy mixes.
- Technological Disruptions:
- Development of more efficient and eco-friendly turbine designs.
- Advanced digital solutions for plant management and grid integration.
- Innovations in small-scale and micro-hydropower solutions.
- Growth in pumped-storage hydropower for grid stabilization.
- Consumer Preferences:
- Growing demand for clean and sustainable energy.
- Preference for reliable and consistent power supply.
- Increased awareness of climate change and its impact.
- Competitive Dynamics:
- Intensified competition among established hydropower players.
- Emergence of new players in renewable energy integration.
- Competition from other renewable sources like solar and wind.
- Strategic partnerships and collaborations to leverage expertise.
Dominant Markets & Segments in Hydropower Generation Market
The Large Hydropower (Greater Than 100 MW) segment is poised to maintain its dominance in the Hydropower Generation Market, accounting for an estimated 65% of the total market size in 2025. This is primarily driven by the sheer scale of energy generation and the significant economic impact of these projects. Key drivers for this segment's dominance include substantial government investments in large-scale infrastructure projects, favorable economic policies promoting industrial development, and the critical role of large hydropower in ensuring grid stability and meeting baseload power demands in many developing and developed nations. Regions with abundant water resources and a strong focus on energy security, such as Asia-Pacific and North America, are leading the charge in large hydropower development.
The Other Sizes (10-100 MW) segment is also expected to exhibit steady growth, driven by the need for distributed energy generation and the development of medium-sized projects that offer a balance between scale and flexibility. These projects are often supported by regional development initiatives and are crucial for electrifying rural areas and supporting industrial zones.
The Small Hydropower (Smaller Than 10 MW) segment, while representing a smaller portion of the overall market share, is experiencing significant growth due to its potential for decentralized power generation, environmental friendliness, and quicker project development cycles. This segment is crucial for remote communities and small-scale industrial applications, often benefiting from supportive policies for micro-energy initiatives.
- Dominant Segment Drivers (Large Hydropower):
- Massive electricity generation capacity to meet industrial and urban demand.
- Grid stability and baseload power provision capabilities.
- Economies of scale in construction and operation.
- Government support for national energy security and infrastructure development.
- Abundant water resources in key regions like Asia-Pacific.
- Growth Drivers (Other Sizes):
- Balanced power output and operational flexibility.
- Support for regional economic development and industrial parks.
- Adaptability to varying topographical and hydrological conditions.
- Expansion Drivers (Small Hydropower):
- Decentralized energy solutions for rural and remote areas.
- Environmental sustainability and minimal ecological footprint.
- Faster project implementation and lower initial investment.
- Supportive policies for renewable energy at the community level.
Hydropower Generation Market Product Developments
Product developments in the Hydropower Generation Market are largely focused on enhancing efficiency, reducing environmental impact, and extending the lifespan of existing infrastructure. Innovations in turbine technology, such as the development of Francis, Kaplan, and Pelton turbines with improved hydraulic designs and materials, are crucial. Furthermore, advancements in digital technologies, including artificial intelligence (AI) and the Internet of Things (IoT) for predictive maintenance and operational optimization, are providing significant competitive advantages. The trend towards modular and scalable hydropower solutions, particularly for small and micro-hydropower, is also gaining traction. These developments enable hydropower plants to adapt to changing water flows and contribute more effectively to grid stability, offering cleaner and more reliable energy generation.
Report Scope & Segmentation Analysis
This report offers a comprehensive analysis of the Hydropower Generation Market, meticulously segmenting it by installed capacity to provide granular insights into specific market dynamics. The segmentation includes Large Hydropower (Greater Than 100 MW), which dominates the market due to its significant energy output and role in baseload power. This segment is projected to grow at a CAGR of approximately 4.8% from 2025–2033. The Other Sizes (10-100 MW) segment, representing medium-scale projects, is expected to witness a CAGR of around 5.5%, driven by its flexibility and applicability in various industrial and regional energy needs. Finally, the Small Hydropower (Smaller Than 10 MW) segment, focusing on decentralized and community-based power generation, is anticipated to experience the highest growth rate, with a CAGR of approximately 6.0%, fueled by supportive policies and demand for localized clean energy solutions.
Key Drivers of Hydropower Generation Market Growth
The Hydropower Generation Market growth is propelled by a confluence of critical factors. Foremost among these is the global push for decarbonization and the urgent need to transition away from fossil fuels, making hydropower a vital component of renewable energy portfolios. Supportive government policies, including tax incentives, feed-in tariffs, and renewable energy mandates, are instrumental in stimulating investment and project development. Technological advancements, such as more efficient turbine designs and advanced grid integration solutions, are reducing costs and enhancing the viability of hydropower projects. Furthermore, increasing global energy demand, coupled with a focus on energy security and independence, drives the demand for reliable and domestically sourced power, where hydropower excels.
- Technological Advancements: Improved turbine efficiency and reliability, smart grid integration, and digital monitoring systems.
- Economic Factors: Growing demand for renewable energy, supportive investment frameworks, and declining levelized cost of electricity.
- Regulatory Frameworks: Government subsidies, renewable energy targets, and favorable permitting processes.
- Environmental Concerns: The urgent need to reduce greenhouse gas emissions and combat climate change.
Challenges in the Hydropower Generation Market Sector
Despite its significant advantages, the Hydropower Generation Market faces several challenges. Environmental concerns, including the impact on aquatic ecosystems, fish migration, and sediment flow, necessitate stringent environmental impact assessments and mitigation strategies, which can increase project costs and timelines. Regulatory hurdles and complex permitting processes in certain regions can also impede project development. High upfront capital investment for large-scale projects, coupled with long gestation periods, can be a deterrent for investors. Furthermore, increasing competition from other renewable energy sources like solar and wind, which have seen significant cost reductions, presents a competitive pressure. Climate change itself, leading to altered precipitation patterns and water availability, poses a long-term risk to hydropower generation reliability.
- Environmental Impact: Habitat disruption, changes in river flows, and potential impacts on biodiversity.
- Regulatory Complexities: Lengthy approval processes and stringent environmental regulations.
- High Capital Costs: Significant initial investment required for construction.
- Competition from Other Renewables: Declining costs of solar and wind power.
- Climate Change Variability: Uncertainty in water availability due to changing weather patterns.
Emerging Opportunities in Hydropower Generation Market
Emerging opportunities in the Hydropower Generation Market lie in the modernization of existing infrastructure, the development of pumped-storage hydropower, and the expansion of small and micro-hydropower solutions. Upgrading older hydropower plants with advanced technologies can significantly boost their efficiency and output, providing a cost-effective way to increase renewable energy generation. Pumped-storage hydropower presents a significant opportunity for grid stabilization and energy storage, especially as intermittent renewable sources like solar and wind become more prevalent. The increasing demand for decentralized energy solutions in developing regions and for niche applications offers substantial growth potential for small and micro-hydropower projects. Innovations in fish-friendly turbines and ecologically sensitive dam designs are also opening up new avenues for sustainable hydropower development.
- Modernization of Existing Assets: Upgrading aging infrastructure for increased efficiency and output.
- Pumped-Storage Hydropower: Enhancing grid stability and energy storage capacity.
- Small and Micro-Hydropower: Providing decentralized energy solutions for remote and underserved areas.
- Ecologically Sensitive Technologies: Development of fish-friendly turbines and reduced environmental impact designs.
Leading Players in the Hydropower Generation Market Market
- Iberdrola SA
- China Yangtze Power Co Ltd
- Voith GmbH & Co KGaA
- PJSC RusHydro
- Siemens Energy AG
- GE Renewable Energy
- Andritz AG
- Électricité de France SA (EDF)
Key Developments in Hydropower Generation Market Industry
- May 2023: Satluj Jal Vidyut Nigam (SJVN) of India has been granted permission by Nepal to develop a second hydropower project in the country. Currently, the firm is developing a 900-MW Arun-III hydroelectric project located on the Arun River in Eastern Nepal. This project is scheduled to be completed in 2024. Investment Board Nepal (IBN) has approved to build of the 669 MW Lower Arun hydropower project in eastern Nepal.
- December 2022: China announced the completion of its second-largest hydropower facility, the Baihetan hydropower plant, on the upstream branch of the Yangtze River. This facility will be equipped with 16 one-GW turbines.
Strategic Outlook for Hydropower Generation Market Market
The strategic outlook for the Hydropower Generation Market remains positive, driven by the persistent global demand for clean and reliable energy. Future growth will be significantly influenced by investments in modernizing existing facilities, expanding pumped-storage hydropower capacity for grid flexibility, and leveraging technological innovations to enhance efficiency and reduce environmental impact. Governments worldwide are expected to continue their support through policy frameworks and incentives, recognizing hydropower's crucial role in achieving renewable energy targets and ensuring energy security. The market will likely witness strategic collaborations and M&A activities as companies seek to consolidate their positions and expand their renewable energy portfolios. The increasing focus on sustainability and climate action will further bolster the demand for hydropower as a key pillar of the global energy transition, presenting substantial opportunities for continued market expansion and innovation.
Hydropower Generation Market Segmentation
-
1. Size
- 1.1. Large Hydropower (Greater Than 100 MW)
- 1.2. Small Hydropower (Smaller Than 10 MW)
- 1.3. Other Sizes (10-100 MW)
Hydropower Generation Market Segmentation By Geography
-
1. North America
- 1.1. United States
- 1.2. Canada
- 1.3. Rest of North America
-
2. Europe
- 2.1. Germany
- 2.2. France
- 2.3. United Kingdom
- 2.4. Rest of Europe
-
3. Asia Pacific
- 3.1. China
- 3.2. India
- 3.3. Japan
- 3.4. South Korea
- 3.5. Rest of Asia Pacific
-
4. South America
- 4.1. Brazil
- 4.2. Argentina
- 4.3. Rest of South America
-
5. Middle East and Africa
- 5.1. Saudi Arabia
- 5.2. United Arab Emirates
- 5.3. South Africa
- 5.4. Rest of Middle East and Africa
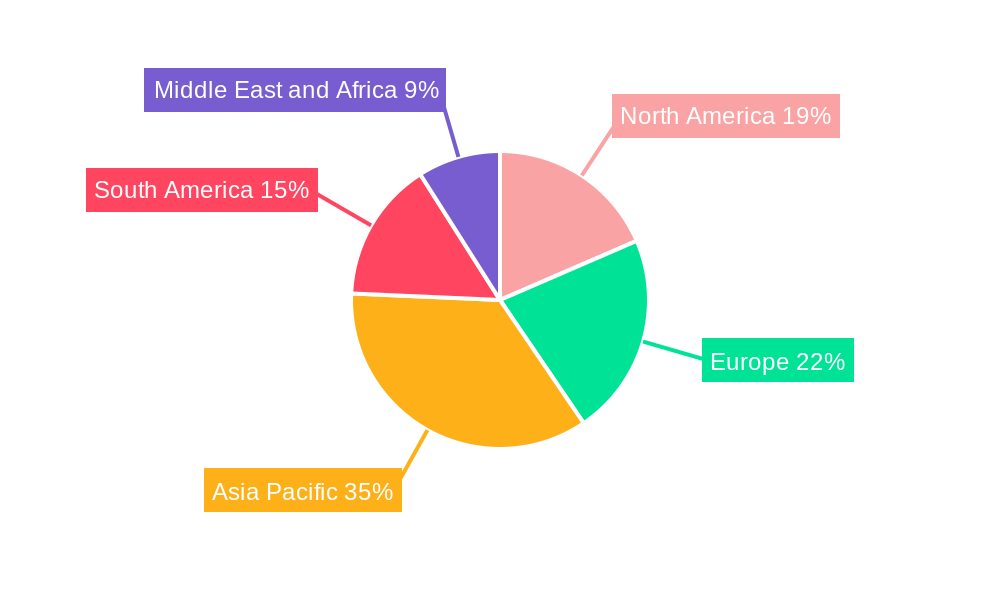
Hydropower Generation Market Regional Market Share
Geographic Coverage of Hydropower Generation Market
Hydropower Generation Market REPORT HIGHLIGHTS
| Aspects | Details |
|---|---|
| Study Period | 2020-2034 |
| Base Year | 2025 |
| Estimated Year | 2026 |
| Forecast Period | 2026-2034 |
| Historical Period | 2020-2025 |
| Growth Rate | CAGR of 0.99% from 2020-2034 |
| Segmentation |
|
Table of Contents
- 1. Introduction
- 1.1. Research Scope
- 1.2. Market Segmentation
- 1.3. Research Objective
- 1.4. Definitions and Assumptions
- 2. Executive Summary
- 2.1. Market Snapshot
- 3. Market Dynamics
- 3.1. Market Drivers
- 3.2. Market Restrains
- 3.3. Market Trends
- 3.4. Market Opportunities
- 4. Market Factor Analysis
- 4.1. Porters Five Forces
- 4.1.1. Bargaining Power of Suppliers
- 4.1.2. Bargaining Power of Buyers
- 4.1.3. Threat of New Entrants
- 4.1.4. Threat of Substitutes
- 4.1.5. Competitive Rivalry
- 4.2. PESTEL analysis
- 4.3. BCG Analysis
- 4.3.1. Stars (High Growth, High Market Share)
- 4.3.2. Cash Cows (Low Growth, High Market Share)
- 4.3.3. Question Mark (High Growth, Low Market Share)
- 4.3.4. Dogs (Low Growth, Low Market Share)
- 4.4. Ansoff Matrix Analysis
- 4.5. Supply Chain Analysis
- 4.6. Regulatory Landscape
- 4.7. Current Market Potential and Opportunity Assessment (TAM–SAM–SOM Framework)
- 4.8. RAX Analyst Note
- 4.1. Porters Five Forces
- 5. Market Analysis, Insights and Forecast 2021-2033
- 5.1. Market Analysis, Insights and Forecast - by Size
- 5.1.1. Large Hydropower (Greater Than 100 MW)
- 5.1.2. Small Hydropower (Smaller Than 10 MW)
- 5.1.3. Other Sizes (10-100 MW)
- 5.2. Market Analysis, Insights and Forecast - by Region
- 5.2.1. North America
- 5.2.2. Europe
- 5.2.3. Asia Pacific
- 5.2.4. South America
- 5.2.5. Middle East and Africa
- 5.1. Market Analysis, Insights and Forecast - by Size
- 6. Global Hydropower Generation Market Analysis, Insights and Forecast, 2021-2033
- 6.1. Market Analysis, Insights and Forecast - by Size
- 6.1.1. Large Hydropower (Greater Than 100 MW)
- 6.1.2. Small Hydropower (Smaller Than 10 MW)
- 6.1.3. Other Sizes (10-100 MW)
- 6.1. Market Analysis, Insights and Forecast - by Size
- 7. North America Hydropower Generation Market Analysis, Insights and Forecast, 2020-2032
- 7.1. Market Analysis, Insights and Forecast - by Size
- 7.1.1. Large Hydropower (Greater Than 100 MW)
- 7.1.2. Small Hydropower (Smaller Than 10 MW)
- 7.1.3. Other Sizes (10-100 MW)
- 7.1. Market Analysis, Insights and Forecast - by Size
- 8. Europe Hydropower Generation Market Analysis, Insights and Forecast, 2020-2032
- 8.1. Market Analysis, Insights and Forecast - by Size
- 8.1.1. Large Hydropower (Greater Than 100 MW)
- 8.1.2. Small Hydropower (Smaller Than 10 MW)
- 8.1.3. Other Sizes (10-100 MW)
- 8.1. Market Analysis, Insights and Forecast - by Size
- 9. Asia Pacific Hydropower Generation Market Analysis, Insights and Forecast, 2020-2032
- 9.1. Market Analysis, Insights and Forecast - by Size
- 9.1.1. Large Hydropower (Greater Than 100 MW)
- 9.1.2. Small Hydropower (Smaller Than 10 MW)
- 9.1.3. Other Sizes (10-100 MW)
- 9.1. Market Analysis, Insights and Forecast - by Size
- 10. South America Hydropower Generation Market Analysis, Insights and Forecast, 2020-2032
- 10.1. Market Analysis, Insights and Forecast - by Size
- 10.1.1. Large Hydropower (Greater Than 100 MW)
- 10.1.2. Small Hydropower (Smaller Than 10 MW)
- 10.1.3. Other Sizes (10-100 MW)
- 10.1. Market Analysis, Insights and Forecast - by Size
- 11. Middle East and Africa Hydropower Generation Market Analysis, Insights and Forecast, 2020-2032
- 11.1. Market Analysis, Insights and Forecast - by Size
- 11.1.1. Large Hydropower (Greater Than 100 MW)
- 11.1.2. Small Hydropower (Smaller Than 10 MW)
- 11.1.3. Other Sizes (10-100 MW)
- 11.1. Market Analysis, Insights and Forecast - by Size
- 12. Competitive Analysis
- 12.1. Company Profiles
- 12.1.1 Iberdrola SA*List Not Exhaustive 6 4 Market Ranking/Share Analysi
- 12.1.1.1. Company Overview
- 12.1.1.2. Products
- 12.1.1.3. Company Financials
- 12.1.1.4. SWOT Analysis
- 12.1.2 China Yangtze Power Co Ltd
- 12.1.2.1. Company Overview
- 12.1.2.2. Products
- 12.1.2.3. Company Financials
- 12.1.2.4. SWOT Analysis
- 12.1.3 Voith GmbH & Co KGaA
- 12.1.3.1. Company Overview
- 12.1.3.2. Products
- 12.1.3.3. Company Financials
- 12.1.3.4. SWOT Analysis
- 12.1.4 PJSC RusHydro
- 12.1.4.1. Company Overview
- 12.1.4.2. Products
- 12.1.4.3. Company Financials
- 12.1.4.4. SWOT Analysis
- 12.1.5 Siemens Energy AG
- 12.1.5.1. Company Overview
- 12.1.5.2. Products
- 12.1.5.3. Company Financials
- 12.1.5.4. SWOT Analysis
- 12.1.6 GE Renewable Energy
- 12.1.6.1. Company Overview
- 12.1.6.2. Products
- 12.1.6.3. Company Financials
- 12.1.6.4. SWOT Analysis
- 12.1.7 Andritz AG
- 12.1.7.1. Company Overview
- 12.1.7.2. Products
- 12.1.7.3. Company Financials
- 12.1.7.4. SWOT Analysis
- 12.1.8 Électricité de France SA (EDF)
- 12.1.8.1. Company Overview
- 12.1.8.2. Products
- 12.1.8.3. Company Financials
- 12.1.8.4. SWOT Analysis
- 12.1.1 Iberdrola SA*List Not Exhaustive 6 4 Market Ranking/Share Analysi
- 12.2. Market Entropy
- 12.2.1 Company's Key Areas Served
- 12.2.2 Recent Developments
- 12.3. Company Market Share Analysis 2025
- 12.3.1 Top 5 Companies Market Share Analysis
- 12.3.2 Top 3 Companies Market Share Analysis
- 12.4. List of Potential Customers
- 13. Research Methodology
List of Figures
- Figure 1: Global Hydropower Generation Market Revenue Breakdown (billion, %) by Region 2025 & 2033
- Figure 2: Global Hydropower Generation Market Volume Breakdown (terawatt, %) by Region 2025 & 2033
- Figure 3: North America Hydropower Generation Market Revenue (billion), by Size 2025 & 2033
- Figure 4: North America Hydropower Generation Market Volume (terawatt), by Size 2025 & 2033
- Figure 5: North America Hydropower Generation Market Revenue Share (%), by Size 2025 & 2033
- Figure 6: North America Hydropower Generation Market Volume Share (%), by Size 2025 & 2033
- Figure 7: North America Hydropower Generation Market Revenue (billion), by Country 2025 & 2033
- Figure 8: North America Hydropower Generation Market Volume (terawatt), by Country 2025 & 2033
- Figure 9: North America Hydropower Generation Market Revenue Share (%), by Country 2025 & 2033
- Figure 10: North America Hydropower Generation Market Volume Share (%), by Country 2025 & 2033
- Figure 11: Europe Hydropower Generation Market Revenue (billion), by Size 2025 & 2033
- Figure 12: Europe Hydropower Generation Market Volume (terawatt), by Size 2025 & 2033
- Figure 13: Europe Hydropower Generation Market Revenue Share (%), by Size 2025 & 2033
- Figure 14: Europe Hydropower Generation Market Volume Share (%), by Size 2025 & 2033
- Figure 15: Europe Hydropower Generation Market Revenue (billion), by Country 2025 & 2033
- Figure 16: Europe Hydropower Generation Market Volume (terawatt), by Country 2025 & 2033
- Figure 17: Europe Hydropower Generation Market Revenue Share (%), by Country 2025 & 2033
- Figure 18: Europe Hydropower Generation Market Volume Share (%), by Country 2025 & 2033
- Figure 19: Asia Pacific Hydropower Generation Market Revenue (billion), by Size 2025 & 2033
- Figure 20: Asia Pacific Hydropower Generation Market Volume (terawatt), by Size 2025 & 2033
- Figure 21: Asia Pacific Hydropower Generation Market Revenue Share (%), by Size 2025 & 2033
- Figure 22: Asia Pacific Hydropower Generation Market Volume Share (%), by Size 2025 & 2033
- Figure 23: Asia Pacific Hydropower Generation Market Revenue (billion), by Country 2025 & 2033
- Figure 24: Asia Pacific Hydropower Generation Market Volume (terawatt), by Country 2025 & 2033
- Figure 25: Asia Pacific Hydropower Generation Market Revenue Share (%), by Country 2025 & 2033
- Figure 26: Asia Pacific Hydropower Generation Market Volume Share (%), by Country 2025 & 2033
- Figure 27: South America Hydropower Generation Market Revenue (billion), by Size 2025 & 2033
- Figure 28: South America Hydropower Generation Market Volume (terawatt), by Size 2025 & 2033
- Figure 29: South America Hydropower Generation Market Revenue Share (%), by Size 2025 & 2033
- Figure 30: South America Hydropower Generation Market Volume Share (%), by Size 2025 & 2033
- Figure 31: South America Hydropower Generation Market Revenue (billion), by Country 2025 & 2033
- Figure 32: South America Hydropower Generation Market Volume (terawatt), by Country 2025 & 2033
- Figure 33: South America Hydropower Generation Market Revenue Share (%), by Country 2025 & 2033
- Figure 34: South America Hydropower Generation Market Volume Share (%), by Country 2025 & 2033
- Figure 35: Middle East and Africa Hydropower Generation Market Revenue (billion), by Size 2025 & 2033
- Figure 36: Middle East and Africa Hydropower Generation Market Volume (terawatt), by Size 2025 & 2033
- Figure 37: Middle East and Africa Hydropower Generation Market Revenue Share (%), by Size 2025 & 2033
- Figure 38: Middle East and Africa Hydropower Generation Market Volume Share (%), by Size 2025 & 2033
- Figure 39: Middle East and Africa Hydropower Generation Market Revenue (billion), by Country 2025 & 2033
- Figure 40: Middle East and Africa Hydropower Generation Market Volume (terawatt), by Country 2025 & 2033
- Figure 41: Middle East and Africa Hydropower Generation Market Revenue Share (%), by Country 2025 & 2033
- Figure 42: Middle East and Africa Hydropower Generation Market Volume Share (%), by Country 2025 & 2033
List of Tables
- Table 1: Global Hydropower Generation Market Revenue billion Forecast, by Size 2020 & 2033
- Table 2: Global Hydropower Generation Market Volume terawatt Forecast, by Size 2020 & 2033
- Table 3: Global Hydropower Generation Market Revenue billion Forecast, by Region 2020 & 2033
- Table 4: Global Hydropower Generation Market Volume terawatt Forecast, by Region 2020 & 2033
- Table 5: Global Hydropower Generation Market Revenue billion Forecast, by Size 2020 & 2033
- Table 6: Global Hydropower Generation Market Volume terawatt Forecast, by Size 2020 & 2033
- Table 7: Global Hydropower Generation Market Revenue billion Forecast, by Country 2020 & 2033
- Table 8: Global Hydropower Generation Market Volume terawatt Forecast, by Country 2020 & 2033
- Table 9: United States Hydropower Generation Market Revenue (billion) Forecast, by Application 2020 & 2033
- Table 10: United States Hydropower Generation Market Volume (terawatt) Forecast, by Application 2020 & 2033
- Table 11: Canada Hydropower Generation Market Revenue (billion) Forecast, by Application 2020 & 2033
- Table 12: Canada Hydropower Generation Market Volume (terawatt) Forecast, by Application 2020 & 2033
- Table 13: Rest of North America Hydropower Generation Market Revenue (billion) Forecast, by Application 2020 & 2033
- Table 14: Rest of North America Hydropower Generation Market Volume (terawatt) Forecast, by Application 2020 & 2033
- Table 15: Global Hydropower Generation Market Revenue billion Forecast, by Size 2020 & 2033
- Table 16: Global Hydropower Generation Market Volume terawatt Forecast, by Size 2020 & 2033
- Table 17: Global Hydropower Generation Market Revenue billion Forecast, by Country 2020 & 2033
- Table 18: Global Hydropower Generation Market Volume terawatt Forecast, by Country 2020 & 2033
- Table 19: Germany Hydropower Generation Market Revenue (billion) Forecast, by Application 2020 & 2033
- Table 20: Germany Hydropower Generation Market Volume (terawatt) Forecast, by Application 2020 & 2033
- Table 21: France Hydropower Generation Market Revenue (billion) Forecast, by Application 2020 & 2033
- Table 22: France Hydropower Generation Market Volume (terawatt) Forecast, by Application 2020 & 2033
- Table 23: United Kingdom Hydropower Generation Market Revenue (billion) Forecast, by Application 2020 & 2033
- Table 24: United Kingdom Hydropower Generation Market Volume (terawatt) Forecast, by Application 2020 & 2033
- Table 25: Rest of Europe Hydropower Generation Market Revenue (billion) Forecast, by Application 2020 & 2033
- Table 26: Rest of Europe Hydropower Generation Market Volume (terawatt) Forecast, by Application 2020 & 2033
- Table 27: Global Hydropower Generation Market Revenue billion Forecast, by Size 2020 & 2033
- Table 28: Global Hydropower Generation Market Volume terawatt Forecast, by Size 2020 & 2033
- Table 29: Global Hydropower Generation Market Revenue billion Forecast, by Country 2020 & 2033
- Table 30: Global Hydropower Generation Market Volume terawatt Forecast, by Country 2020 & 2033
- Table 31: China Hydropower Generation Market Revenue (billion) Forecast, by Application 2020 & 2033
- Table 32: China Hydropower Generation Market Volume (terawatt) Forecast, by Application 2020 & 2033
- Table 33: India Hydropower Generation Market Revenue (billion) Forecast, by Application 2020 & 2033
- Table 34: India Hydropower Generation Market Volume (terawatt) Forecast, by Application 2020 & 2033
- Table 35: Japan Hydropower Generation Market Revenue (billion) Forecast, by Application 2020 & 2033
- Table 36: Japan Hydropower Generation Market Volume (terawatt) Forecast, by Application 2020 & 2033
- Table 37: South Korea Hydropower Generation Market Revenue (billion) Forecast, by Application 2020 & 2033
- Table 38: South Korea Hydropower Generation Market Volume (terawatt) Forecast, by Application 2020 & 2033
- Table 39: Rest of Asia Pacific Hydropower Generation Market Revenue (billion) Forecast, by Application 2020 & 2033
- Table 40: Rest of Asia Pacific Hydropower Generation Market Volume (terawatt) Forecast, by Application 2020 & 2033
- Table 41: Global Hydropower Generation Market Revenue billion Forecast, by Size 2020 & 2033
- Table 42: Global Hydropower Generation Market Volume terawatt Forecast, by Size 2020 & 2033
- Table 43: Global Hydropower Generation Market Revenue billion Forecast, by Country 2020 & 2033
- Table 44: Global Hydropower Generation Market Volume terawatt Forecast, by Country 2020 & 2033
- Table 45: Brazil Hydropower Generation Market Revenue (billion) Forecast, by Application 2020 & 2033
- Table 46: Brazil Hydropower Generation Market Volume (terawatt) Forecast, by Application 2020 & 2033
- Table 47: Argentina Hydropower Generation Market Revenue (billion) Forecast, by Application 2020 & 2033
- Table 48: Argentina Hydropower Generation Market Volume (terawatt) Forecast, by Application 2020 & 2033
- Table 49: Rest of South America Hydropower Generation Market Revenue (billion) Forecast, by Application 2020 & 2033
- Table 50: Rest of South America Hydropower Generation Market Volume (terawatt) Forecast, by Application 2020 & 2033
- Table 51: Global Hydropower Generation Market Revenue billion Forecast, by Size 2020 & 2033
- Table 52: Global Hydropower Generation Market Volume terawatt Forecast, by Size 2020 & 2033
- Table 53: Global Hydropower Generation Market Revenue billion Forecast, by Country 2020 & 2033
- Table 54: Global Hydropower Generation Market Volume terawatt Forecast, by Country 2020 & 2033
- Table 55: Saudi Arabia Hydropower Generation Market Revenue (billion) Forecast, by Application 2020 & 2033
- Table 56: Saudi Arabia Hydropower Generation Market Volume (terawatt) Forecast, by Application 2020 & 2033
- Table 57: United Arab Emirates Hydropower Generation Market Revenue (billion) Forecast, by Application 2020 & 2033
- Table 58: United Arab Emirates Hydropower Generation Market Volume (terawatt) Forecast, by Application 2020 & 2033
- Table 59: South Africa Hydropower Generation Market Revenue (billion) Forecast, by Application 2020 & 2033
- Table 60: South Africa Hydropower Generation Market Volume (terawatt) Forecast, by Application 2020 & 2033
- Table 61: Rest of Middle East and Africa Hydropower Generation Market Revenue (billion) Forecast, by Application 2020 & 2033
- Table 62: Rest of Middle East and Africa Hydropower Generation Market Volume (terawatt) Forecast, by Application 2020 & 2033
Frequently Asked Questions
1. What is the projected Compound Annual Growth Rate (CAGR) of the Hydropower Generation Market?
The projected CAGR is approximately 0.99%.
2. Which companies are prominent players in the Hydropower Generation Market?
Key companies in the market include Iberdrola SA*List Not Exhaustive 6 4 Market Ranking/Share Analysi, China Yangtze Power Co Ltd, Voith GmbH & Co KGaA, PJSC RusHydro, Siemens Energy AG, GE Renewable Energy, Andritz AG, Électricité de France SA (EDF).
3. What are the main segments of the Hydropower Generation Market?
The market segments include Size.
4. Can you provide details about the market size?
The market size is estimated to be USD 116.09 billion as of 2022.
5. What are some drivers contributing to market growth?
4.; Rising Demand for Reliable Electricity4.; Increasing Government Support for Hydropower Gneeration.
6. What are the notable trends driving market growth?
The Large Hydropower (Greater Than 100 MW) Segment to Dominate the Market.
7. Are there any restraints impacting market growth?
4.; Negative Environmental Consequences of Hydropower Projects.
8. Can you provide examples of recent developments in the market?
May 2023: Satluj Jal Vidyut Nigam (SJVN) of India has been granted permission by Nepal to develop a second hydropower project in the country. Currently, the firm is developing a 900-MW Arun-III hydroelectric project located on the Arun River in Eastern Nepal. This project is scheduled to be completed in 2024. Investment Board Nepal (IBN) has approved to build of the 669 MW Lower Arun hydropower project in eastern Nepal.
9. What pricing options are available for accessing the report?
Pricing options include single-user, multi-user, and enterprise licenses priced at USD 4750, USD 5250, and USD 8750 respectively.
10. Is the market size provided in terms of value or volume?
The market size is provided in terms of value, measured in billion and volume, measured in terawatt.
11. Are there any specific market keywords associated with the report?
Yes, the market keyword associated with the report is "Hydropower Generation Market," which aids in identifying and referencing the specific market segment covered.
12. How do I determine which pricing option suits my needs best?
The pricing options vary based on user requirements and access needs. Individual users may opt for single-user licenses, while businesses requiring broader access may choose multi-user or enterprise licenses for cost-effective access to the report.
13. Are there any additional resources or data provided in the Hydropower Generation Market report?
While the report offers comprehensive insights, it's advisable to review the specific contents or supplementary materials provided to ascertain if additional resources or data are available.
14. How can I stay updated on further developments or reports in the Hydropower Generation Market?
To stay informed about further developments, trends, and reports in the Hydropower Generation Market, consider subscribing to industry newsletters, following relevant companies and organizations, or regularly checking reputable industry news sources and publications.
Methodology
Step 1 - Identification of Relevant Samples Size from Population Database


Step 2 - Approaches for Defining Global Market Size (Value, Volume* & Price*)

Note*: In applicable scenarios
Step 3 - Data Sources
Primary Research
- Web Analytics
- Survey Reports
- Research Institute
- Latest Research Reports
- Opinion Leaders
Secondary Research
- Annual Reports
- White Paper
- Latest Press Release
- Industry Association
- Paid Database
- Investor Presentations

Step 4 - Data Triangulation
Involves using different sources of information in order to increase the validity of a study
These sources are likely to be stakeholders in a program - participants, other researchers, program staff, other community members, and so on.
Then we put all data in single framework & apply various statistical tools to find out the dynamic on the market.
During the analysis stage, feedback from the stakeholder groups would be compared to determine areas of agreement as well as areas of divergence