
Key Insights
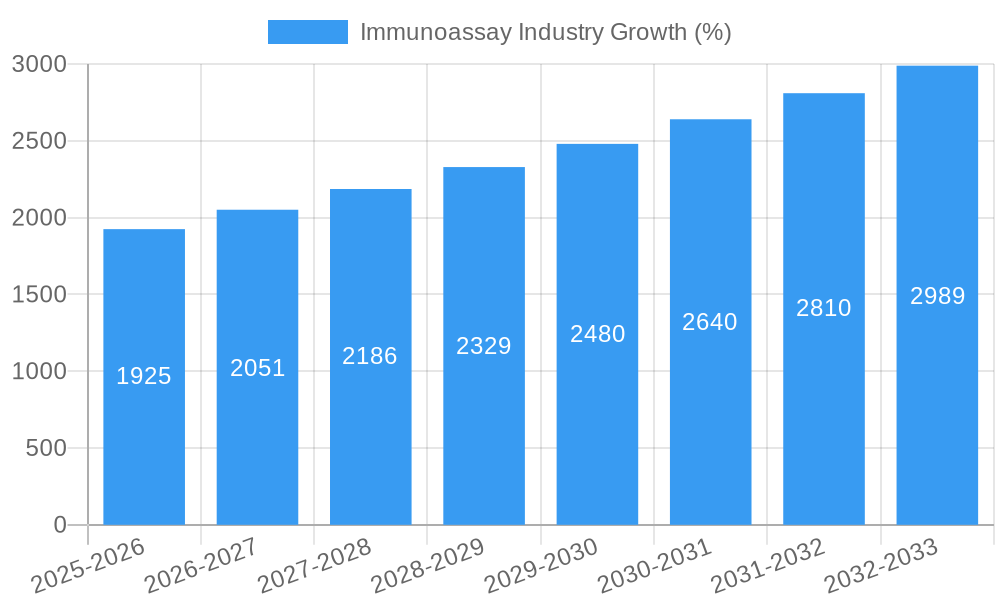
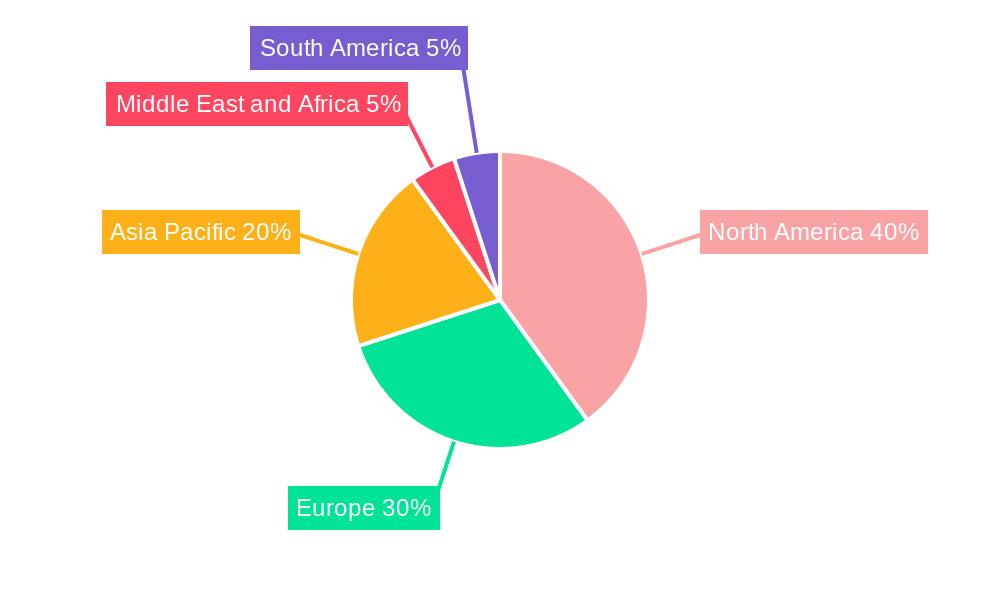
The global immunoassay market is experiencing robust growth, driven by the increasing prevalence of chronic diseases, rising demand for accurate and rapid diagnostic tests, and advancements in immunoassay technologies. The market's 7.70% CAGR indicates a significant expansion from 2019 to 2033, fueled by factors such as the development of point-of-care testing devices, the growing adoption of personalized medicine, and increased investments in research and development within the pharmaceutical and biotechnology sectors. The diverse applications of immunoassays across disease diagnosis (including infectious diseases and autoimmune disorders), therapeutic drug monitoring, and drug discovery contribute to its wide-reaching appeal. Technological advancements, particularly in chemiluminescence immunoassay (CLIA) and enzyme immunoassays (EIA) due to their high sensitivity and speed, are shaping market trends. The market is segmented by technology (RIA, EIA, FIA, CLIA, others), application (disease diagnosis, therapeutic drug monitoring, drug discovery, etc.), and end-user (hospitals, pharmaceutical companies, clinical labs, etc.), offering various growth opportunities across these segments. North America and Europe currently hold a significant market share, but the Asia-Pacific region is expected to witness the fastest growth rate driven by increasing healthcare expenditure and rising awareness about diagnostic testing.
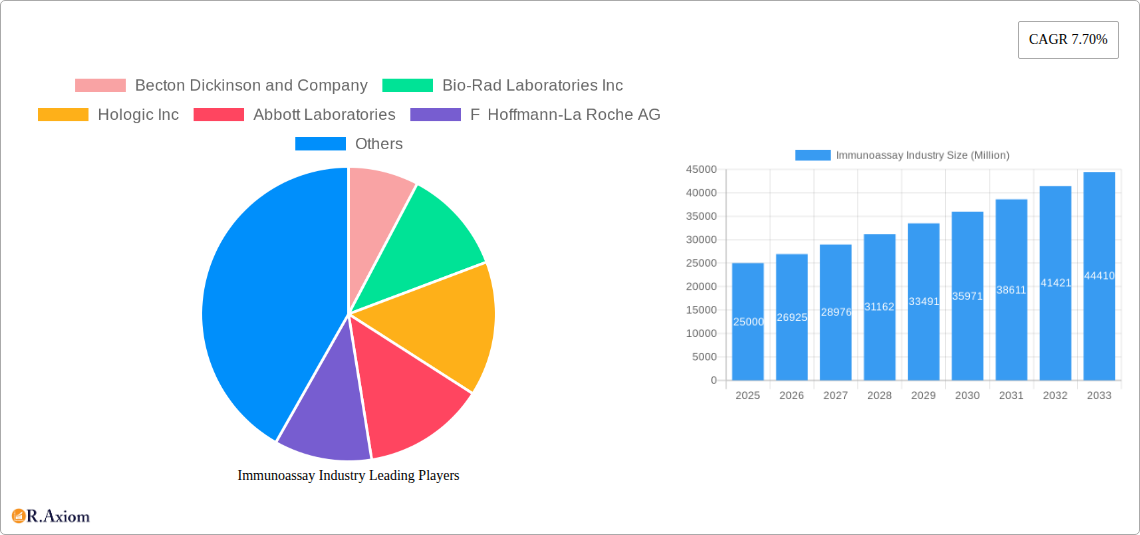
While the market faces challenges such as stringent regulatory requirements and high equipment costs, these are mitigated by the substantial benefits of accurate and timely diagnostics. The competitive landscape is marked by the presence of major players such as Becton Dickinson, Bio-Rad Laboratories, and Abbott Laboratories, who are constantly innovating and expanding their product portfolios. The continued development of automated, high-throughput immunoassay systems is expected to further drive market growth, enhancing efficiency and reducing costs in clinical settings. The expanding application of immunoassays in personalized medicine, offering targeted therapies and early disease detection, presents a significant growth driver for the foreseeable future. The market's future trajectory points towards continued expansion, driven by a confluence of technological advancements, increasing healthcare awareness, and the growing need for accurate and efficient diagnostic tools.
Immunoassay Industry Market Report: 2019-2033
This comprehensive report provides an in-depth analysis of the Immunoassay industry, covering market size, segmentation, growth drivers, challenges, and key players. The report utilizes data from the historical period (2019-2024), base year (2025), and estimated year (2025) to project market trends through 2033. The analysis incorporates data from various segments, including type, application, and end-user, along with a competitive landscape overview. This report is crucial for industry stakeholders, investors, and researchers seeking actionable insights into this dynamic market.
Immunoassay Industry Market Concentration & Innovation
The immunoassay market is characterized by a moderately concentrated landscape, with several multinational corporations holding significant market share. Key players like Abbott Laboratories, Roche, and Danaher Corporation (Beckman Coulter Inc) dominate through their established product portfolios and extensive distribution networks. However, smaller companies and innovative startups are also contributing to market growth through specialized tests and advanced technologies. The market share of the top five players is estimated at xx%, reflecting both intense competition and the potential for consolidation. M&A activity in the sector has been relatively high, with deal values exceeding $xx Million in the past five years, largely driven by the desire to expand product portfolios and geographic reach. Innovation is a key driver, with continuous improvements in assay sensitivity, speed, and automation. Regulatory frameworks, such as those from the FDA and EMA, play a vital role in ensuring product safety and efficacy. Product substitutes, such as molecular diagnostics, pose a competitive threat, but the established reliability and relatively lower cost of immunoassays maintain their strong position in the market. End-user trends towards automation and point-of-care testing are shaping the demand for innovative immunoassay products.
- Market Share: Top 5 players: xx%
- M&A Deal Value (2019-2024): > $xx Million
- Key Innovation Drivers: Enhanced sensitivity, automation, point-of-care diagnostics.
Immunoassay Industry Industry Trends & Insights
The immunoassay market exhibits a robust growth trajectory, with a Compound Annual Growth Rate (CAGR) projected at xx% during the forecast period (2025-2033). This growth is fueled by several factors, including the rising prevalence of chronic diseases necessitating increased diagnostic testing, the growing adoption of automated immunoassay systems in high-throughput clinical laboratories, and the increasing demand for faster and more accurate diagnostic results. Technological disruptions, such as the development of multiplexed assays and microfluidic devices, are further driving market expansion. Consumer preference for convenient, rapid diagnostics is also positively impacting the market. Competitive dynamics are intense, with companies focusing on developing innovative products, expanding into new markets, and forging strategic partnerships. Market penetration in emerging economies is steadily increasing, particularly due to improving healthcare infrastructure and rising disposable incomes.
Dominant Markets & Segments in Immunoassay Industry
The global immunoassay market is geographically diverse, with North America and Europe holding a dominant position due to established healthcare infrastructure, high adoption rates, and substantial research and development investments. However, Asia Pacific is projected to witness the fastest growth owing to rising healthcare spending and a growing prevalence of infectious diseases.
Dominant Segments:
- By Type: Chemiluminescence Immunoassay (CLIA) holds the largest market share due to its high sensitivity and versatility, followed by Enzyme Immunoassays (EIA).
- By Application: Disease diagnosis dominates the market, driven by the large-scale testing requirements for infectious diseases and chronic conditions. Therapeutic drug monitoring is a significant segment, and the demand for drug discovery applications is growing steadily.
- By End User: Hospitals and clinical laboratories are the largest end-users due to their high volume testing needs.
Key Drivers for Dominant Regions:
- North America: Well-established healthcare systems, high adoption rates of advanced technologies.
- Europe: Similar to North America, high investment in R&D and robust healthcare infrastructure.
- Asia Pacific: Rising healthcare spending, increasing disease prevalence, growing adoption of advanced diagnostics.
Immunoassay Industry Product Developments
Recent product innovations have focused on enhancing assay sensitivity, reducing turnaround time, and improving ease of use. Technological trends, such as multiplexing, point-of-care testing, and microfluidics, have led to the development of more compact, portable, and high-throughput systems. These innovations enhance the clinical utility and market fit of immunoassays, making them more efficient and accessible for a wider range of healthcare settings.
Report Scope & Segmentation Analysis
This report comprehensively segments the immunoassay market by type (RIA, EIA, FIA, CLIA, Others), application (Disease Diagnosis, Therapeutic Drug Monitoring, Drug Discovery, Clinical Chemistry, Hematology, Others), and end-user (Hospitals, Pharma & Biotech Companies, Clinical Laboratories, Others). Each segment’s growth projections, market size, and competitive dynamics are thoroughly analyzed, offering a granular understanding of the market's structure.
Key Drivers of Immunoassay Industry Growth
Several factors are driving the growth of the immunoassay industry. Technological advancements, including automation, miniaturization, and improved assay sensitivity, are streamlining diagnostic processes and enhancing accuracy. The increasing prevalence of chronic diseases, such as diabetes and cardiovascular diseases, is boosting the demand for diagnostic testing. Favorable regulatory environments and increasing healthcare expenditure in developing economies are also contributing to market expansion. Furthermore, the rising adoption of point-of-care testing is providing faster and more convenient diagnostics, fueling the demand for portable and user-friendly immunoassay systems.
Challenges in the Immunoassay Industry Sector
Despite the significant growth potential, the immunoassay industry faces several challenges. Stringent regulatory requirements and high costs associated with obtaining regulatory approvals can hinder market entry for new players. Supply chain disruptions and fluctuations in raw material prices can also negatively impact profitability. Moreover, the competitive landscape is intense, with established companies constantly striving to innovate and maintain market share. The emergence of alternative diagnostic technologies also presents a potential competitive threat. The cost associated with high skilled manpower in the industry represents another major challenge to growth.
Emerging Opportunities in Immunoassay Industry
Emerging opportunities lie in the development of novel immunoassay platforms, such as microfluidic devices and biosensors, offering improved sensitivity, portability, and cost-effectiveness. The growing demand for personalized medicine is driving the development of assays targeted at specific patient populations. The expanding application of immunoassays in veterinary diagnostics and environmental monitoring represents significant untapped market potential. Finally, point-of-care testing holds immense promise for extending immunoassay applications to settings beyond traditional clinical laboratories.
Leading Players in the Immunoassay Industry Market
- Becton Dickinson and Company
- Bio-Rad Laboratories Inc
- Hologic Inc
- Abbott Laboratories
- F Hoffmann-La Roche AG
- Agilent Technologies Inc
- Danaher Corporation (Beckman Coulter Inc)
- Qiagen NV
- Sysmex Corporation
- Thermo Fisher Scientific
- Luminex Corporation
- PerkinElmer Inc
Key Developments in Immunoassay Industry Industry
- November 2022: Getein launched MAGICL 6000 CLIA analyzer at MEDICA 2022. This launch expands the availability of compact, high-throughput CLIA analyzers, catering to the needs of mid-to-high-workflow laboratories.
- November 2022: LumiraDx launched a rapid microfluidic immunoassay HbA1c test in Europe, parts of the Middle East, Asia, Latin America, and Africa. This launch demonstrates the growing adoption of rapid point-of-care diagnostics for improved patient management and healthcare accessibility.
Strategic Outlook for Immunoassay Industry Market
The immunoassay market is poised for sustained growth driven by technological advancements, rising healthcare expenditure, and an increasing prevalence of chronic diseases. Opportunities exist in the development of novel assays, point-of-care diagnostics, and personalized medicine applications. Strategic partnerships and acquisitions will continue to shape the competitive landscape, as companies strive to expand their product portfolios and market reach. The continued development and adoption of automation will further drive market growth and efficiency.
Immunoassay Industry Segmentation
-
1. Type
- 1.1. Radioimmunoassay (RIA)
- 1.2. Enzyme Immunoassays (EIA)
- 1.3. Fluoroimmnoassay (FIA)
- 1.4. Chemiluminescence Immunoassay (CLIA)
- 1.5. Others
-
2. Application
- 2.1. Disease Diagnosis
- 2.2. Therapeutic Drug Monitoring
- 2.3. Drug Discovery
- 2.4. Clinical Chemistry
- 2.5. Hematology
- 2.6. Others
-
3. End User
- 3.1. Hospitals
- 3.2. Pharma & Biotech Companies
- 3.3. Clinical Laboratories
- 3.4. Others
Immunoassay Industry Segmentation By Geography
-
1. North America
- 1.1. United States
- 1.2. Canada
- 1.3. Mexico
-
2. Europe
- 2.1. Germany
- 2.2. United Kingdom
- 2.3. France
- 2.4. Italy
- 2.5. Spain
- 2.6. Rest of Europe
-
3. Asia Pacific
- 3.1. China
- 3.2. Japan
- 3.3. India
- 3.4. Australia
- 3.5. South Korea
- 3.6. Rest of Asia Pacific
-
4. Middle East and Africa
- 4.1. GCC
- 4.2. South Africa
- 4.3. Rest of Middle East and Africa
-
5. South America
- 5.1. Brazil
- 5.2. Argentina
- 5.3. Rest of South America
Immunoassay Industry REPORT HIGHLIGHTS
| Aspects | Details |
|---|---|
| Study Period | 2019-2033 |
| Base Year | 2024 |
| Estimated Year | 2025 |
| Forecast Period | 2025-2033 |
| Historical Period | 2019-2024 |
| Growth Rate | CAGR of 7.70% from 2019-2033 |
| Segmentation |
|
Table of Contents
- 1. Introduction
- 1.1. Research Scope
- 1.2. Market Segmentation
- 1.3. Research Methodology
- 1.4. Definitions and Assumptions
- 2. Executive Summary
- 2.1. Introduction
- 3. Market Dynamics
- 3.1. Introduction
- 3.2. Market Drivers
- 3.2.1. High Sensitivity and Specificity of Immunoassays; Technological Advancements in Immunoassay Instruments; Increasing Prevalence of Chronic and Infectious Diseases
- 3.3. Market Restrains
- 3.3.1. Stringent Regulatory Scenario for Approval of Immunoassays; Complexity of Procedures
- 3.4. Market Trends
- 3.4.1. Enzyme Immunoassays (EIA) Segment is Expected to Hold Significant Market Share in Immunoassay Market
- 4. Market Factor Analysis
- 4.1. Porters Five Forces
- 4.2. Supply/Value Chain
- 4.3. PESTEL analysis
- 4.4. Market Entropy
- 4.5. Patent/Trademark Analysis
- 5. Global Immunoassay Industry Analysis, Insights and Forecast, 2019-2031
- 5.1. Market Analysis, Insights and Forecast - by Type
- 5.1.1. Radioimmunoassay (RIA)
- 5.1.2. Enzyme Immunoassays (EIA)
- 5.1.3. Fluoroimmnoassay (FIA)
- 5.1.4. Chemiluminescence Immunoassay (CLIA)
- 5.1.5. Others
- 5.2. Market Analysis, Insights and Forecast - by Application
- 5.2.1. Disease Diagnosis
- 5.2.2. Therapeutic Drug Monitoring
- 5.2.3. Drug Discovery
- 5.2.4. Clinical Chemistry
- 5.2.5. Hematology
- 5.2.6. Others
- 5.3. Market Analysis, Insights and Forecast - by End User
- 5.3.1. Hospitals
- 5.3.2. Pharma & Biotech Companies
- 5.3.3. Clinical Laboratories
- 5.3.4. Others
- 5.4. Market Analysis, Insights and Forecast - by Region
- 5.4.1. North America
- 5.4.2. Europe
- 5.4.3. Asia Pacific
- 5.4.4. Middle East and Africa
- 5.4.5. South America
- 5.1. Market Analysis, Insights and Forecast - by Type
- 6. North America Immunoassay Industry Analysis, Insights and Forecast, 2019-2031
- 6.1. Market Analysis, Insights and Forecast - by Type
- 6.1.1. Radioimmunoassay (RIA)
- 6.1.2. Enzyme Immunoassays (EIA)
- 6.1.3. Fluoroimmnoassay (FIA)
- 6.1.4. Chemiluminescence Immunoassay (CLIA)
- 6.1.5. Others
- 6.2. Market Analysis, Insights and Forecast - by Application
- 6.2.1. Disease Diagnosis
- 6.2.2. Therapeutic Drug Monitoring
- 6.2.3. Drug Discovery
- 6.2.4. Clinical Chemistry
- 6.2.5. Hematology
- 6.2.6. Others
- 6.3. Market Analysis, Insights and Forecast - by End User
- 6.3.1. Hospitals
- 6.3.2. Pharma & Biotech Companies
- 6.3.3. Clinical Laboratories
- 6.3.4. Others
- 6.1. Market Analysis, Insights and Forecast - by Type
- 7. Europe Immunoassay Industry Analysis, Insights and Forecast, 2019-2031
- 7.1. Market Analysis, Insights and Forecast - by Type
- 7.1.1. Radioimmunoassay (RIA)
- 7.1.2. Enzyme Immunoassays (EIA)
- 7.1.3. Fluoroimmnoassay (FIA)
- 7.1.4. Chemiluminescence Immunoassay (CLIA)
- 7.1.5. Others
- 7.2. Market Analysis, Insights and Forecast - by Application
- 7.2.1. Disease Diagnosis
- 7.2.2. Therapeutic Drug Monitoring
- 7.2.3. Drug Discovery
- 7.2.4. Clinical Chemistry
- 7.2.5. Hematology
- 7.2.6. Others
- 7.3. Market Analysis, Insights and Forecast - by End User
- 7.3.1. Hospitals
- 7.3.2. Pharma & Biotech Companies
- 7.3.3. Clinical Laboratories
- 7.3.4. Others
- 7.1. Market Analysis, Insights and Forecast - by Type
- 8. Asia Pacific Immunoassay Industry Analysis, Insights and Forecast, 2019-2031
- 8.1. Market Analysis, Insights and Forecast - by Type
- 8.1.1. Radioimmunoassay (RIA)
- 8.1.2. Enzyme Immunoassays (EIA)
- 8.1.3. Fluoroimmnoassay (FIA)
- 8.1.4. Chemiluminescence Immunoassay (CLIA)
- 8.1.5. Others
- 8.2. Market Analysis, Insights and Forecast - by Application
- 8.2.1. Disease Diagnosis
- 8.2.2. Therapeutic Drug Monitoring
- 8.2.3. Drug Discovery
- 8.2.4. Clinical Chemistry
- 8.2.5. Hematology
- 8.2.6. Others
- 8.3. Market Analysis, Insights and Forecast - by End User
- 8.3.1. Hospitals
- 8.3.2. Pharma & Biotech Companies
- 8.3.3. Clinical Laboratories
- 8.3.4. Others
- 8.1. Market Analysis, Insights and Forecast - by Type
- 9. Middle East and Africa Immunoassay Industry Analysis, Insights and Forecast, 2019-2031
- 9.1. Market Analysis, Insights and Forecast - by Type
- 9.1.1. Radioimmunoassay (RIA)
- 9.1.2. Enzyme Immunoassays (EIA)
- 9.1.3. Fluoroimmnoassay (FIA)
- 9.1.4. Chemiluminescence Immunoassay (CLIA)
- 9.1.5. Others
- 9.2. Market Analysis, Insights and Forecast - by Application
- 9.2.1. Disease Diagnosis
- 9.2.2. Therapeutic Drug Monitoring
- 9.2.3. Drug Discovery
- 9.2.4. Clinical Chemistry
- 9.2.5. Hematology
- 9.2.6. Others
- 9.3. Market Analysis, Insights and Forecast - by End User
- 9.3.1. Hospitals
- 9.3.2. Pharma & Biotech Companies
- 9.3.3. Clinical Laboratories
- 9.3.4. Others
- 9.1. Market Analysis, Insights and Forecast - by Type
- 10. South America Immunoassay Industry Analysis, Insights and Forecast, 2019-2031
- 10.1. Market Analysis, Insights and Forecast - by Type
- 10.1.1. Radioimmunoassay (RIA)
- 10.1.2. Enzyme Immunoassays (EIA)
- 10.1.3. Fluoroimmnoassay (FIA)
- 10.1.4. Chemiluminescence Immunoassay (CLIA)
- 10.1.5. Others
- 10.2. Market Analysis, Insights and Forecast - by Application
- 10.2.1. Disease Diagnosis
- 10.2.2. Therapeutic Drug Monitoring
- 10.2.3. Drug Discovery
- 10.2.4. Clinical Chemistry
- 10.2.5. Hematology
- 10.2.6. Others
- 10.3. Market Analysis, Insights and Forecast - by End User
- 10.3.1. Hospitals
- 10.3.2. Pharma & Biotech Companies
- 10.3.3. Clinical Laboratories
- 10.3.4. Others
- 10.1. Market Analysis, Insights and Forecast - by Type
- 11. North America Immunoassay Industry Analysis, Insights and Forecast, 2019-2031
- 11.1. Market Analysis, Insights and Forecast - By Country/Sub-region
- 11.1.1 United States
- 11.1.2 Canada
- 11.1.3 Mexico
- 12. Europe Immunoassay Industry Analysis, Insights and Forecast, 2019-2031
- 12.1. Market Analysis, Insights and Forecast - By Country/Sub-region
- 12.1.1 Germany
- 12.1.2 United Kingdom
- 12.1.3 France
- 12.1.4 Italy
- 12.1.5 Spain
- 12.1.6 Rest of Europe
- 13. Asia Pacific Immunoassay Industry Analysis, Insights and Forecast, 2019-2031
- 13.1. Market Analysis, Insights and Forecast - By Country/Sub-region
- 13.1.1 China
- 13.1.2 Japan
- 13.1.3 India
- 13.1.4 Australia
- 13.1.5 South Korea
- 13.1.6 Rest of Asia Pacific
- 14. Middle East and Africa Immunoassay Industry Analysis, Insights and Forecast, 2019-2031
- 14.1. Market Analysis, Insights and Forecast - By Country/Sub-region
- 14.1.1 GCC
- 14.1.2 South Africa
- 14.1.3 Rest of Middle East and Africa
- 15. South America Immunoassay Industry Analysis, Insights and Forecast, 2019-2031
- 15.1. Market Analysis, Insights and Forecast - By Country/Sub-region
- 15.1.1 Brazil
- 15.1.2 Argentina
- 15.1.3 Rest of South America
- 16. Competitive Analysis
- 16.1. Global Market Share Analysis 2024
- 16.2. Company Profiles
- 16.2.1 Becton Dickinson and Company
- 16.2.1.1. Overview
- 16.2.1.2. Products
- 16.2.1.3. SWOT Analysis
- 16.2.1.4. Recent Developments
- 16.2.1.5. Financials (Based on Availability)
- 16.2.2 Bio-Rad Laboratories Inc
- 16.2.2.1. Overview
- 16.2.2.2. Products
- 16.2.2.3. SWOT Analysis
- 16.2.2.4. Recent Developments
- 16.2.2.5. Financials (Based on Availability)
- 16.2.3 Hologic Inc
- 16.2.3.1. Overview
- 16.2.3.2. Products
- 16.2.3.3. SWOT Analysis
- 16.2.3.4. Recent Developments
- 16.2.3.5. Financials (Based on Availability)
- 16.2.4 Abbott Laboratories
- 16.2.4.1. Overview
- 16.2.4.2. Products
- 16.2.4.3. SWOT Analysis
- 16.2.4.4. Recent Developments
- 16.2.4.5. Financials (Based on Availability)
- 16.2.5 F Hoffmann-La Roche AG
- 16.2.5.1. Overview
- 16.2.5.2. Products
- 16.2.5.3. SWOT Analysis
- 16.2.5.4. Recent Developments
- 16.2.5.5. Financials (Based on Availability)
- 16.2.6 Agilent Technologies Inc
- 16.2.6.1. Overview
- 16.2.6.2. Products
- 16.2.6.3. SWOT Analysis
- 16.2.6.4. Recent Developments
- 16.2.6.5. Financials (Based on Availability)
- 16.2.7 Danaher Corporation (Beckman Coulter Inc)
- 16.2.7.1. Overview
- 16.2.7.2. Products
- 16.2.7.3. SWOT Analysis
- 16.2.7.4. Recent Developments
- 16.2.7.5. Financials (Based on Availability)
- 16.2.8 Qiagen NV
- 16.2.8.1. Overview
- 16.2.8.2. Products
- 16.2.8.3. SWOT Analysis
- 16.2.8.4. Recent Developments
- 16.2.8.5. Financials (Based on Availability)
- 16.2.9 Sysmex Corporation
- 16.2.9.1. Overview
- 16.2.9.2. Products
- 16.2.9.3. SWOT Analysis
- 16.2.9.4. Recent Developments
- 16.2.9.5. Financials (Based on Availability)
- 16.2.10 Thermo Fisher Scientific
- 16.2.10.1. Overview
- 16.2.10.2. Products
- 16.2.10.3. SWOT Analysis
- 16.2.10.4. Recent Developments
- 16.2.10.5. Financials (Based on Availability)
- 16.2.11 Luminex Corporation
- 16.2.11.1. Overview
- 16.2.11.2. Products
- 16.2.11.3. SWOT Analysis
- 16.2.11.4. Recent Developments
- 16.2.11.5. Financials (Based on Availability)
- 16.2.12 PerkinElmer Inc
- 16.2.12.1. Overview
- 16.2.12.2. Products
- 16.2.12.3. SWOT Analysis
- 16.2.12.4. Recent Developments
- 16.2.12.5. Financials (Based on Availability)
- 16.2.1 Becton Dickinson and Company
List of Figures
- Figure 1: Global Immunoassay Industry Revenue Breakdown (Million, %) by Region 2024 & 2032
- Figure 2: Global Immunoassay Industry Volume Breakdown (K Unit, %) by Region 2024 & 2032
- Figure 3: North America Immunoassay Industry Revenue (Million), by Country 2024 & 2032
- Figure 4: North America Immunoassay Industry Volume (K Unit), by Country 2024 & 2032
- Figure 5: North America Immunoassay Industry Revenue Share (%), by Country 2024 & 2032
- Figure 6: North America Immunoassay Industry Volume Share (%), by Country 2024 & 2032
- Figure 7: Europe Immunoassay Industry Revenue (Million), by Country 2024 & 2032
- Figure 8: Europe Immunoassay Industry Volume (K Unit), by Country 2024 & 2032
- Figure 9: Europe Immunoassay Industry Revenue Share (%), by Country 2024 & 2032
- Figure 10: Europe Immunoassay Industry Volume Share (%), by Country 2024 & 2032
- Figure 11: Asia Pacific Immunoassay Industry Revenue (Million), by Country 2024 & 2032
- Figure 12: Asia Pacific Immunoassay Industry Volume (K Unit), by Country 2024 & 2032
- Figure 13: Asia Pacific Immunoassay Industry Revenue Share (%), by Country 2024 & 2032
- Figure 14: Asia Pacific Immunoassay Industry Volume Share (%), by Country 2024 & 2032
- Figure 15: Middle East and Africa Immunoassay Industry Revenue (Million), by Country 2024 & 2032
- Figure 16: Middle East and Africa Immunoassay Industry Volume (K Unit), by Country 2024 & 2032
- Figure 17: Middle East and Africa Immunoassay Industry Revenue Share (%), by Country 2024 & 2032
- Figure 18: Middle East and Africa Immunoassay Industry Volume Share (%), by Country 2024 & 2032
- Figure 19: South America Immunoassay Industry Revenue (Million), by Country 2024 & 2032
- Figure 20: South America Immunoassay Industry Volume (K Unit), by Country 2024 & 2032
- Figure 21: South America Immunoassay Industry Revenue Share (%), by Country 2024 & 2032
- Figure 22: South America Immunoassay Industry Volume Share (%), by Country 2024 & 2032
- Figure 23: North America Immunoassay Industry Revenue (Million), by Type 2024 & 2032
- Figure 24: North America Immunoassay Industry Volume (K Unit), by Type 2024 & 2032
- Figure 25: North America Immunoassay Industry Revenue Share (%), by Type 2024 & 2032
- Figure 26: North America Immunoassay Industry Volume Share (%), by Type 2024 & 2032
- Figure 27: North America Immunoassay Industry Revenue (Million), by Application 2024 & 2032
- Figure 28: North America Immunoassay Industry Volume (K Unit), by Application 2024 & 2032
- Figure 29: North America Immunoassay Industry Revenue Share (%), by Application 2024 & 2032
- Figure 30: North America Immunoassay Industry Volume Share (%), by Application 2024 & 2032
- Figure 31: North America Immunoassay Industry Revenue (Million), by End User 2024 & 2032
- Figure 32: North America Immunoassay Industry Volume (K Unit), by End User 2024 & 2032
- Figure 33: North America Immunoassay Industry Revenue Share (%), by End User 2024 & 2032
- Figure 34: North America Immunoassay Industry Volume Share (%), by End User 2024 & 2032
- Figure 35: North America Immunoassay Industry Revenue (Million), by Country 2024 & 2032
- Figure 36: North America Immunoassay Industry Volume (K Unit), by Country 2024 & 2032
- Figure 37: North America Immunoassay Industry Revenue Share (%), by Country 2024 & 2032
- Figure 38: North America Immunoassay Industry Volume Share (%), by Country 2024 & 2032
- Figure 39: Europe Immunoassay Industry Revenue (Million), by Type 2024 & 2032
- Figure 40: Europe Immunoassay Industry Volume (K Unit), by Type 2024 & 2032
- Figure 41: Europe Immunoassay Industry Revenue Share (%), by Type 2024 & 2032
- Figure 42: Europe Immunoassay Industry Volume Share (%), by Type 2024 & 2032
- Figure 43: Europe Immunoassay Industry Revenue (Million), by Application 2024 & 2032
- Figure 44: Europe Immunoassay Industry Volume (K Unit), by Application 2024 & 2032
- Figure 45: Europe Immunoassay Industry Revenue Share (%), by Application 2024 & 2032
- Figure 46: Europe Immunoassay Industry Volume Share (%), by Application 2024 & 2032
- Figure 47: Europe Immunoassay Industry Revenue (Million), by End User 2024 & 2032
- Figure 48: Europe Immunoassay Industry Volume (K Unit), by End User 2024 & 2032
- Figure 49: Europe Immunoassay Industry Revenue Share (%), by End User 2024 & 2032
- Figure 50: Europe Immunoassay Industry Volume Share (%), by End User 2024 & 2032
- Figure 51: Europe Immunoassay Industry Revenue (Million), by Country 2024 & 2032
- Figure 52: Europe Immunoassay Industry Volume (K Unit), by Country 2024 & 2032
- Figure 53: Europe Immunoassay Industry Revenue Share (%), by Country 2024 & 2032
- Figure 54: Europe Immunoassay Industry Volume Share (%), by Country 2024 & 2032
- Figure 55: Asia Pacific Immunoassay Industry Revenue (Million), by Type 2024 & 2032
- Figure 56: Asia Pacific Immunoassay Industry Volume (K Unit), by Type 2024 & 2032
- Figure 57: Asia Pacific Immunoassay Industry Revenue Share (%), by Type 2024 & 2032
- Figure 58: Asia Pacific Immunoassay Industry Volume Share (%), by Type 2024 & 2032
- Figure 59: Asia Pacific Immunoassay Industry Revenue (Million), by Application 2024 & 2032
- Figure 60: Asia Pacific Immunoassay Industry Volume (K Unit), by Application 2024 & 2032
- Figure 61: Asia Pacific Immunoassay Industry Revenue Share (%), by Application 2024 & 2032
- Figure 62: Asia Pacific Immunoassay Industry Volume Share (%), by Application 2024 & 2032
- Figure 63: Asia Pacific Immunoassay Industry Revenue (Million), by End User 2024 & 2032
- Figure 64: Asia Pacific Immunoassay Industry Volume (K Unit), by End User 2024 & 2032
- Figure 65: Asia Pacific Immunoassay Industry Revenue Share (%), by End User 2024 & 2032
- Figure 66: Asia Pacific Immunoassay Industry Volume Share (%), by End User 2024 & 2032
- Figure 67: Asia Pacific Immunoassay Industry Revenue (Million), by Country 2024 & 2032
- Figure 68: Asia Pacific Immunoassay Industry Volume (K Unit), by Country 2024 & 2032
- Figure 69: Asia Pacific Immunoassay Industry Revenue Share (%), by Country 2024 & 2032
- Figure 70: Asia Pacific Immunoassay Industry Volume Share (%), by Country 2024 & 2032
- Figure 71: Middle East and Africa Immunoassay Industry Revenue (Million), by Type 2024 & 2032
- Figure 72: Middle East and Africa Immunoassay Industry Volume (K Unit), by Type 2024 & 2032
- Figure 73: Middle East and Africa Immunoassay Industry Revenue Share (%), by Type 2024 & 2032
- Figure 74: Middle East and Africa Immunoassay Industry Volume Share (%), by Type 2024 & 2032
- Figure 75: Middle East and Africa Immunoassay Industry Revenue (Million), by Application 2024 & 2032
- Figure 76: Middle East and Africa Immunoassay Industry Volume (K Unit), by Application 2024 & 2032
- Figure 77: Middle East and Africa Immunoassay Industry Revenue Share (%), by Application 2024 & 2032
- Figure 78: Middle East and Africa Immunoassay Industry Volume Share (%), by Application 2024 & 2032
- Figure 79: Middle East and Africa Immunoassay Industry Revenue (Million), by End User 2024 & 2032
- Figure 80: Middle East and Africa Immunoassay Industry Volume (K Unit), by End User 2024 & 2032
- Figure 81: Middle East and Africa Immunoassay Industry Revenue Share (%), by End User 2024 & 2032
- Figure 82: Middle East and Africa Immunoassay Industry Volume Share (%), by End User 2024 & 2032
- Figure 83: Middle East and Africa Immunoassay Industry Revenue (Million), by Country 2024 & 2032
- Figure 84: Middle East and Africa Immunoassay Industry Volume (K Unit), by Country 2024 & 2032
- Figure 85: Middle East and Africa Immunoassay Industry Revenue Share (%), by Country 2024 & 2032
- Figure 86: Middle East and Africa Immunoassay Industry Volume Share (%), by Country 2024 & 2032
- Figure 87: South America Immunoassay Industry Revenue (Million), by Type 2024 & 2032
- Figure 88: South America Immunoassay Industry Volume (K Unit), by Type 2024 & 2032
- Figure 89: South America Immunoassay Industry Revenue Share (%), by Type 2024 & 2032
- Figure 90: South America Immunoassay Industry Volume Share (%), by Type 2024 & 2032
- Figure 91: South America Immunoassay Industry Revenue (Million), by Application 2024 & 2032
- Figure 92: South America Immunoassay Industry Volume (K Unit), by Application 2024 & 2032
- Figure 93: South America Immunoassay Industry Revenue Share (%), by Application 2024 & 2032
- Figure 94: South America Immunoassay Industry Volume Share (%), by Application 2024 & 2032
- Figure 95: South America Immunoassay Industry Revenue (Million), by End User 2024 & 2032
- Figure 96: South America Immunoassay Industry Volume (K Unit), by End User 2024 & 2032
- Figure 97: South America Immunoassay Industry Revenue Share (%), by End User 2024 & 2032
- Figure 98: South America Immunoassay Industry Volume Share (%), by End User 2024 & 2032
- Figure 99: South America Immunoassay Industry Revenue (Million), by Country 2024 & 2032
- Figure 100: South America Immunoassay Industry Volume (K Unit), by Country 2024 & 2032
- Figure 101: South America Immunoassay Industry Revenue Share (%), by Country 2024 & 2032
- Figure 102: South America Immunoassay Industry Volume Share (%), by Country 2024 & 2032
List of Tables
- Table 1: Global Immunoassay Industry Revenue Million Forecast, by Region 2019 & 2032
- Table 2: Global Immunoassay Industry Volume K Unit Forecast, by Region 2019 & 2032
- Table 3: Global Immunoassay Industry Revenue Million Forecast, by Type 2019 & 2032
- Table 4: Global Immunoassay Industry Volume K Unit Forecast, by Type 2019 & 2032
- Table 5: Global Immunoassay Industry Revenue Million Forecast, by Application 2019 & 2032
- Table 6: Global Immunoassay Industry Volume K Unit Forecast, by Application 2019 & 2032
- Table 7: Global Immunoassay Industry Revenue Million Forecast, by End User 2019 & 2032
- Table 8: Global Immunoassay Industry Volume K Unit Forecast, by End User 2019 & 2032
- Table 9: Global Immunoassay Industry Revenue Million Forecast, by Region 2019 & 2032
- Table 10: Global Immunoassay Industry Volume K Unit Forecast, by Region 2019 & 2032
- Table 11: Global Immunoassay Industry Revenue Million Forecast, by Country 2019 & 2032
- Table 12: Global Immunoassay Industry Volume K Unit Forecast, by Country 2019 & 2032
- Table 13: United States Immunoassay Industry Revenue (Million) Forecast, by Application 2019 & 2032
- Table 14: United States Immunoassay Industry Volume (K Unit) Forecast, by Application 2019 & 2032
- Table 15: Canada Immunoassay Industry Revenue (Million) Forecast, by Application 2019 & 2032
- Table 16: Canada Immunoassay Industry Volume (K Unit) Forecast, by Application 2019 & 2032
- Table 17: Mexico Immunoassay Industry Revenue (Million) Forecast, by Application 2019 & 2032
- Table 18: Mexico Immunoassay Industry Volume (K Unit) Forecast, by Application 2019 & 2032
- Table 19: Global Immunoassay Industry Revenue Million Forecast, by Country 2019 & 2032
- Table 20: Global Immunoassay Industry Volume K Unit Forecast, by Country 2019 & 2032
- Table 21: Germany Immunoassay Industry Revenue (Million) Forecast, by Application 2019 & 2032
- Table 22: Germany Immunoassay Industry Volume (K Unit) Forecast, by Application 2019 & 2032
- Table 23: United Kingdom Immunoassay Industry Revenue (Million) Forecast, by Application 2019 & 2032
- Table 24: United Kingdom Immunoassay Industry Volume (K Unit) Forecast, by Application 2019 & 2032
- Table 25: France Immunoassay Industry Revenue (Million) Forecast, by Application 2019 & 2032
- Table 26: France Immunoassay Industry Volume (K Unit) Forecast, by Application 2019 & 2032
- Table 27: Italy Immunoassay Industry Revenue (Million) Forecast, by Application 2019 & 2032
- Table 28: Italy Immunoassay Industry Volume (K Unit) Forecast, by Application 2019 & 2032
- Table 29: Spain Immunoassay Industry Revenue (Million) Forecast, by Application 2019 & 2032
- Table 30: Spain Immunoassay Industry Volume (K Unit) Forecast, by Application 2019 & 2032
- Table 31: Rest of Europe Immunoassay Industry Revenue (Million) Forecast, by Application 2019 & 2032
- Table 32: Rest of Europe Immunoassay Industry Volume (K Unit) Forecast, by Application 2019 & 2032
- Table 33: Global Immunoassay Industry Revenue Million Forecast, by Country 2019 & 2032
- Table 34: Global Immunoassay Industry Volume K Unit Forecast, by Country 2019 & 2032
- Table 35: China Immunoassay Industry Revenue (Million) Forecast, by Application 2019 & 2032
- Table 36: China Immunoassay Industry Volume (K Unit) Forecast, by Application 2019 & 2032
- Table 37: Japan Immunoassay Industry Revenue (Million) Forecast, by Application 2019 & 2032
- Table 38: Japan Immunoassay Industry Volume (K Unit) Forecast, by Application 2019 & 2032
- Table 39: India Immunoassay Industry Revenue (Million) Forecast, by Application 2019 & 2032
- Table 40: India Immunoassay Industry Volume (K Unit) Forecast, by Application 2019 & 2032
- Table 41: Australia Immunoassay Industry Revenue (Million) Forecast, by Application 2019 & 2032
- Table 42: Australia Immunoassay Industry Volume (K Unit) Forecast, by Application 2019 & 2032
- Table 43: South Korea Immunoassay Industry Revenue (Million) Forecast, by Application 2019 & 2032
- Table 44: South Korea Immunoassay Industry Volume (K Unit) Forecast, by Application 2019 & 2032
- Table 45: Rest of Asia Pacific Immunoassay Industry Revenue (Million) Forecast, by Application 2019 & 2032
- Table 46: Rest of Asia Pacific Immunoassay Industry Volume (K Unit) Forecast, by Application 2019 & 2032
- Table 47: Global Immunoassay Industry Revenue Million Forecast, by Country 2019 & 2032
- Table 48: Global Immunoassay Industry Volume K Unit Forecast, by Country 2019 & 2032
- Table 49: GCC Immunoassay Industry Revenue (Million) Forecast, by Application 2019 & 2032
- Table 50: GCC Immunoassay Industry Volume (K Unit) Forecast, by Application 2019 & 2032
- Table 51: South Africa Immunoassay Industry Revenue (Million) Forecast, by Application 2019 & 2032
- Table 52: South Africa Immunoassay Industry Volume (K Unit) Forecast, by Application 2019 & 2032
- Table 53: Rest of Middle East and Africa Immunoassay Industry Revenue (Million) Forecast, by Application 2019 & 2032
- Table 54: Rest of Middle East and Africa Immunoassay Industry Volume (K Unit) Forecast, by Application 2019 & 2032
- Table 55: Global Immunoassay Industry Revenue Million Forecast, by Country 2019 & 2032
- Table 56: Global Immunoassay Industry Volume K Unit Forecast, by Country 2019 & 2032
- Table 57: Brazil Immunoassay Industry Revenue (Million) Forecast, by Application 2019 & 2032
- Table 58: Brazil Immunoassay Industry Volume (K Unit) Forecast, by Application 2019 & 2032
- Table 59: Argentina Immunoassay Industry Revenue (Million) Forecast, by Application 2019 & 2032
- Table 60: Argentina Immunoassay Industry Volume (K Unit) Forecast, by Application 2019 & 2032
- Table 61: Rest of South America Immunoassay Industry Revenue (Million) Forecast, by Application 2019 & 2032
- Table 62: Rest of South America Immunoassay Industry Volume (K Unit) Forecast, by Application 2019 & 2032
- Table 63: Global Immunoassay Industry Revenue Million Forecast, by Type 2019 & 2032
- Table 64: Global Immunoassay Industry Volume K Unit Forecast, by Type 2019 & 2032
- Table 65: Global Immunoassay Industry Revenue Million Forecast, by Application 2019 & 2032
- Table 66: Global Immunoassay Industry Volume K Unit Forecast, by Application 2019 & 2032
- Table 67: Global Immunoassay Industry Revenue Million Forecast, by End User 2019 & 2032
- Table 68: Global Immunoassay Industry Volume K Unit Forecast, by End User 2019 & 2032
- Table 69: Global Immunoassay Industry Revenue Million Forecast, by Country 2019 & 2032
- Table 70: Global Immunoassay Industry Volume K Unit Forecast, by Country 2019 & 2032
- Table 71: United States Immunoassay Industry Revenue (Million) Forecast, by Application 2019 & 2032
- Table 72: United States Immunoassay Industry Volume (K Unit) Forecast, by Application 2019 & 2032
- Table 73: Canada Immunoassay Industry Revenue (Million) Forecast, by Application 2019 & 2032
- Table 74: Canada Immunoassay Industry Volume (K Unit) Forecast, by Application 2019 & 2032
- Table 75: Mexico Immunoassay Industry Revenue (Million) Forecast, by Application 2019 & 2032
- Table 76: Mexico Immunoassay Industry Volume (K Unit) Forecast, by Application 2019 & 2032
- Table 77: Global Immunoassay Industry Revenue Million Forecast, by Type 2019 & 2032
- Table 78: Global Immunoassay Industry Volume K Unit Forecast, by Type 2019 & 2032
- Table 79: Global Immunoassay Industry Revenue Million Forecast, by Application 2019 & 2032
- Table 80: Global Immunoassay Industry Volume K Unit Forecast, by Application 2019 & 2032
- Table 81: Global Immunoassay Industry Revenue Million Forecast, by End User 2019 & 2032
- Table 82: Global Immunoassay Industry Volume K Unit Forecast, by End User 2019 & 2032
- Table 83: Global Immunoassay Industry Revenue Million Forecast, by Country 2019 & 2032
- Table 84: Global Immunoassay Industry Volume K Unit Forecast, by Country 2019 & 2032
- Table 85: Germany Immunoassay Industry Revenue (Million) Forecast, by Application 2019 & 2032
- Table 86: Germany Immunoassay Industry Volume (K Unit) Forecast, by Application 2019 & 2032
- Table 87: United Kingdom Immunoassay Industry Revenue (Million) Forecast, by Application 2019 & 2032
- Table 88: United Kingdom Immunoassay Industry Volume (K Unit) Forecast, by Application 2019 & 2032
- Table 89: France Immunoassay Industry Revenue (Million) Forecast, by Application 2019 & 2032
- Table 90: France Immunoassay Industry Volume (K Unit) Forecast, by Application 2019 & 2032
- Table 91: Italy Immunoassay Industry Revenue (Million) Forecast, by Application 2019 & 2032
- Table 92: Italy Immunoassay Industry Volume (K Unit) Forecast, by Application 2019 & 2032
- Table 93: Spain Immunoassay Industry Revenue (Million) Forecast, by Application 2019 & 2032
- Table 94: Spain Immunoassay Industry Volume (K Unit) Forecast, by Application 2019 & 2032
- Table 95: Rest of Europe Immunoassay Industry Revenue (Million) Forecast, by Application 2019 & 2032
- Table 96: Rest of Europe Immunoassay Industry Volume (K Unit) Forecast, by Application 2019 & 2032
- Table 97: Global Immunoassay Industry Revenue Million Forecast, by Type 2019 & 2032
- Table 98: Global Immunoassay Industry Volume K Unit Forecast, by Type 2019 & 2032
- Table 99: Global Immunoassay Industry Revenue Million Forecast, by Application 2019 & 2032
- Table 100: Global Immunoassay Industry Volume K Unit Forecast, by Application 2019 & 2032
- Table 101: Global Immunoassay Industry Revenue Million Forecast, by End User 2019 & 2032
- Table 102: Global Immunoassay Industry Volume K Unit Forecast, by End User 2019 & 2032
- Table 103: Global Immunoassay Industry Revenue Million Forecast, by Country 2019 & 2032
- Table 104: Global Immunoassay Industry Volume K Unit Forecast, by Country 2019 & 2032
- Table 105: China Immunoassay Industry Revenue (Million) Forecast, by Application 2019 & 2032
- Table 106: China Immunoassay Industry Volume (K Unit) Forecast, by Application 2019 & 2032
- Table 107: Japan Immunoassay Industry Revenue (Million) Forecast, by Application 2019 & 2032
- Table 108: Japan Immunoassay Industry Volume (K Unit) Forecast, by Application 2019 & 2032
- Table 109: India Immunoassay Industry Revenue (Million) Forecast, by Application 2019 & 2032
- Table 110: India Immunoassay Industry Volume (K Unit) Forecast, by Application 2019 & 2032
- Table 111: Australia Immunoassay Industry Revenue (Million) Forecast, by Application 2019 & 2032
- Table 112: Australia Immunoassay Industry Volume (K Unit) Forecast, by Application 2019 & 2032
- Table 113: South Korea Immunoassay Industry Revenue (Million) Forecast, by Application 2019 & 2032
- Table 114: South Korea Immunoassay Industry Volume (K Unit) Forecast, by Application 2019 & 2032
- Table 115: Rest of Asia Pacific Immunoassay Industry Revenue (Million) Forecast, by Application 2019 & 2032
- Table 116: Rest of Asia Pacific Immunoassay Industry Volume (K Unit) Forecast, by Application 2019 & 2032
- Table 117: Global Immunoassay Industry Revenue Million Forecast, by Type 2019 & 2032
- Table 118: Global Immunoassay Industry Volume K Unit Forecast, by Type 2019 & 2032
- Table 119: Global Immunoassay Industry Revenue Million Forecast, by Application 2019 & 2032
- Table 120: Global Immunoassay Industry Volume K Unit Forecast, by Application 2019 & 2032
- Table 121: Global Immunoassay Industry Revenue Million Forecast, by End User 2019 & 2032
- Table 122: Global Immunoassay Industry Volume K Unit Forecast, by End User 2019 & 2032
- Table 123: Global Immunoassay Industry Revenue Million Forecast, by Country 2019 & 2032
- Table 124: Global Immunoassay Industry Volume K Unit Forecast, by Country 2019 & 2032
- Table 125: GCC Immunoassay Industry Revenue (Million) Forecast, by Application 2019 & 2032
- Table 126: GCC Immunoassay Industry Volume (K Unit) Forecast, by Application 2019 & 2032
- Table 127: South Africa Immunoassay Industry Revenue (Million) Forecast, by Application 2019 & 2032
- Table 128: South Africa Immunoassay Industry Volume (K Unit) Forecast, by Application 2019 & 2032
- Table 129: Rest of Middle East and Africa Immunoassay Industry Revenue (Million) Forecast, by Application 2019 & 2032
- Table 130: Rest of Middle East and Africa Immunoassay Industry Volume (K Unit) Forecast, by Application 2019 & 2032
- Table 131: Global Immunoassay Industry Revenue Million Forecast, by Type 2019 & 2032
- Table 132: Global Immunoassay Industry Volume K Unit Forecast, by Type 2019 & 2032
- Table 133: Global Immunoassay Industry Revenue Million Forecast, by Application 2019 & 2032
- Table 134: Global Immunoassay Industry Volume K Unit Forecast, by Application 2019 & 2032
- Table 135: Global Immunoassay Industry Revenue Million Forecast, by End User 2019 & 2032
- Table 136: Global Immunoassay Industry Volume K Unit Forecast, by End User 2019 & 2032
- Table 137: Global Immunoassay Industry Revenue Million Forecast, by Country 2019 & 2032
- Table 138: Global Immunoassay Industry Volume K Unit Forecast, by Country 2019 & 2032
- Table 139: Brazil Immunoassay Industry Revenue (Million) Forecast, by Application 2019 & 2032
- Table 140: Brazil Immunoassay Industry Volume (K Unit) Forecast, by Application 2019 & 2032
- Table 141: Argentina Immunoassay Industry Revenue (Million) Forecast, by Application 2019 & 2032
- Table 142: Argentina Immunoassay Industry Volume (K Unit) Forecast, by Application 2019 & 2032
- Table 143: Rest of South America Immunoassay Industry Revenue (Million) Forecast, by Application 2019 & 2032
- Table 144: Rest of South America Immunoassay Industry Volume (K Unit) Forecast, by Application 2019 & 2032
Frequently Asked Questions
1. What is the projected Compound Annual Growth Rate (CAGR) of the Immunoassay Industry?
The projected CAGR is approximately 7.70%.
2. Which companies are prominent players in the Immunoassay Industry?
Key companies in the market include Becton Dickinson and Company, Bio-Rad Laboratories Inc, Hologic Inc, Abbott Laboratories, F Hoffmann-La Roche AG, Agilent Technologies Inc, Danaher Corporation (Beckman Coulter Inc), Qiagen NV, Sysmex Corporation, Thermo Fisher Scientific, Luminex Corporation, PerkinElmer Inc .
3. What are the main segments of the Immunoassay Industry?
The market segments include Type, Application, End User.
4. Can you provide details about the market size?
The market size is estimated to be USD XX Million as of 2022.
5. What are some drivers contributing to market growth?
High Sensitivity and Specificity of Immunoassays; Technological Advancements in Immunoassay Instruments; Increasing Prevalence of Chronic and Infectious Diseases.
6. What are the notable trends driving market growth?
Enzyme Immunoassays (EIA) Segment is Expected to Hold Significant Market Share in Immunoassay Market.
7. Are there any restraints impacting market growth?
Stringent Regulatory Scenario for Approval of Immunoassays; Complexity of Procedures.
8. Can you provide examples of recent developments in the market?
In November 2022, Getein launched MAGICL 6000 CLIA analyzer at MEDICA 2022. MAGICL 6000 is a compact and innovative CLIA analyzer, with optimal choice for mid to high-workflow laboratories that require a one-step CLIA solution.
9. What pricing options are available for accessing the report?
Pricing options include single-user, multi-user, and enterprise licenses priced at USD 4750, USD 5250, and USD 8750 respectively.
10. Is the market size provided in terms of value or volume?
The market size is provided in terms of value, measured in Million and volume, measured in K Unit.
11. Are there any specific market keywords associated with the report?
Yes, the market keyword associated with the report is "Immunoassay Industry," which aids in identifying and referencing the specific market segment covered.
12. How do I determine which pricing option suits my needs best?
The pricing options vary based on user requirements and access needs. Individual users may opt for single-user licenses, while businesses requiring broader access may choose multi-user or enterprise licenses for cost-effective access to the report.
13. Are there any additional resources or data provided in the Immunoassay Industry report?
While the report offers comprehensive insights, it's advisable to review the specific contents or supplementary materials provided to ascertain if additional resources or data are available.
14. How can I stay updated on further developments or reports in the Immunoassay Industry?
To stay informed about further developments, trends, and reports in the Immunoassay Industry, consider subscribing to industry newsletters, following relevant companies and organizations, or regularly checking reputable industry news sources and publications.
Methodology
Step 1 - Identification of Relevant Samples Size from Population Database


Step 2 - Approaches for Defining Global Market Size (Value, Volume* & Price*)

Note*: In applicable scenarios
Step 3 - Data Sources
Primary Research
- Web Analytics
- Survey Reports
- Research Institute
- Latest Research Reports
- Opinion Leaders
Secondary Research
- Annual Reports
- White Paper
- Latest Press Release
- Industry Association
- Paid Database
- Investor Presentations

Step 4 - Data Triangulation
Involves using different sources of information in order to increase the validity of a study
These sources are likely to be stakeholders in a program - participants, other researchers, program staff, other community members, and so on.
Then we put all data in single framework & apply various statistical tools to find out the dynamic on the market.
During the analysis stage, feedback from the stakeholder groups would be compared to determine areas of agreement as well as areas of divergence


