

Key Insights
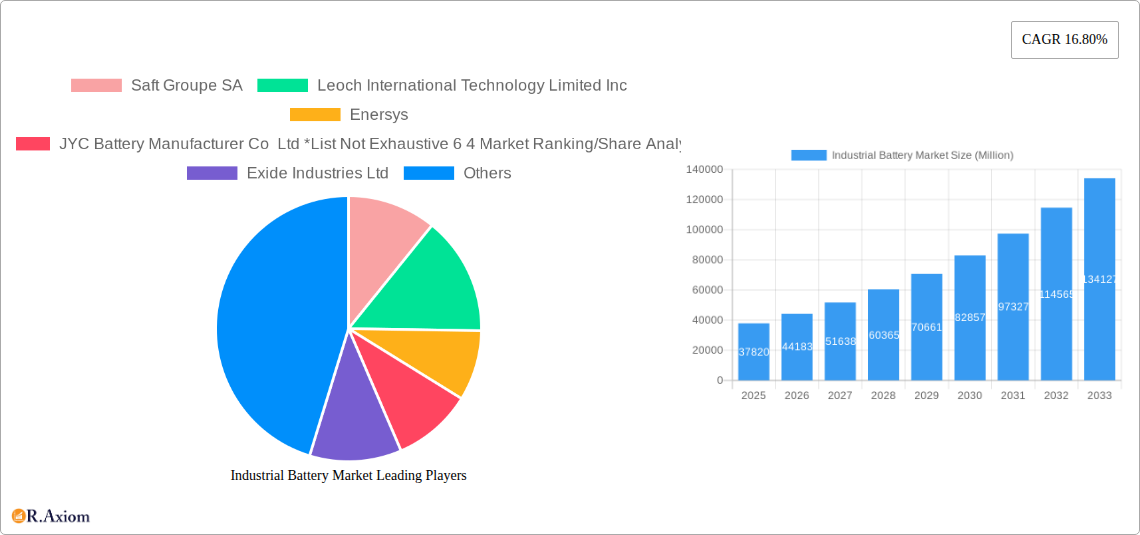
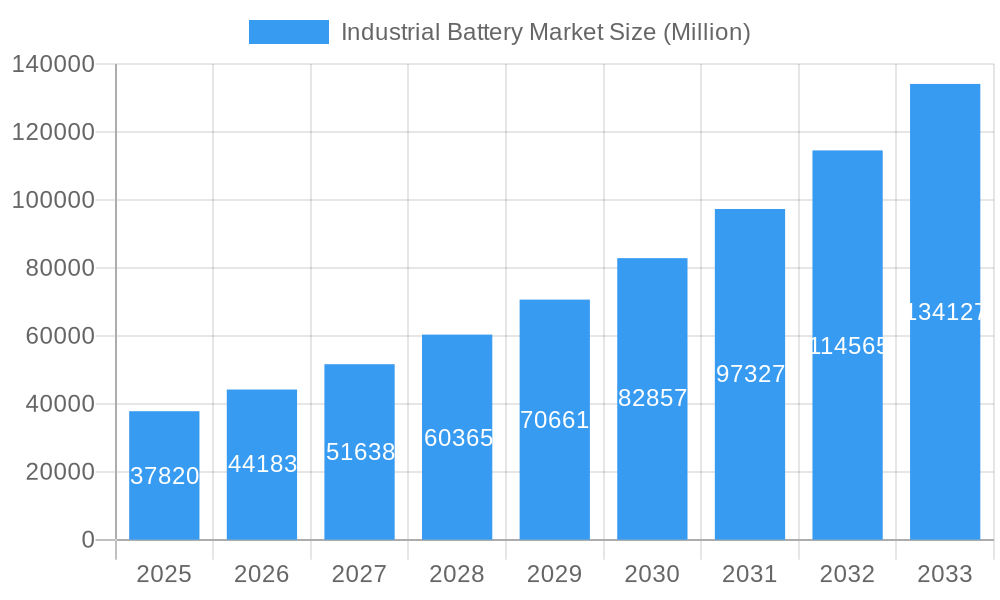
The global industrial battery market, valued at $37.82 billion in 2025, is experiencing robust growth, projected to expand at a Compound Annual Growth Rate (CAGR) of 16.80% from 2025 to 2033. This surge is driven by several key factors. The increasing adoption of automation and electrification across various industries, particularly in the power sector (including energy storage systems and uninterruptible power supplies), oil & gas, and manufacturing, fuels significant demand for reliable and efficient power solutions. Furthermore, the global push towards renewable energy integration and the rising need for backup power in critical infrastructure are driving the market forward. Technological advancements, such as improvements in lithium-ion battery technology offering higher energy density and longer lifespans, further contribute to this growth. However, the market faces challenges including the fluctuating prices of raw materials like lithium and cobalt, concerns regarding battery disposal and environmental impact, and competition from emerging energy storage technologies. Segmentation reveals a dominance of lithium-ion batteries, owing to their superior performance characteristics compared to traditional lead-acid batteries. Geographically, North America and Asia-Pacific are expected to remain key market players due to substantial industrial activity and significant investments in renewable energy infrastructure.
Industrial Battery Market Market Size (In Billion)
The market's future growth trajectory is strongly linked to the continued adoption of electric vehicles (EVs) and hybrid electric vehicles (HEVs) in industrial applications, as well as the expansion of smart grids and microgrids. The increasing focus on sustainability and reducing carbon emissions will continue to incentivize the shift towards cleaner and more efficient energy storage solutions. To capitalize on this growth, manufacturers are focusing on innovations such as solid-state batteries and improved battery management systems (BMS) to enhance safety, performance, and lifespan. Competition among major players like Saft, Leoch International, Enersys, Exide Industries, and GS Yuasa will intensify as they strive to capture market share through technological advancements, strategic partnerships, and geographic expansion. The successful navigation of regulatory hurdles related to battery safety and environmental regulations will be crucial for sustained market growth.
Industrial Battery Market Company Market Share
This detailed report provides a comprehensive analysis of the global industrial battery market, covering market size, segmentation, key players, growth drivers, challenges, and future opportunities. The study period spans from 2019 to 2033, with 2025 serving as the base and estimated year. The report is crucial for industry stakeholders, investors, and market researchers seeking actionable insights into this dynamic sector.
Industrial Battery Market Market Concentration & Innovation
The industrial battery market is characterized by a moderately concentrated landscape. A few major industry leaders command a substantial portion of the market share, yet the presence of a diverse array of smaller, specialized manufacturers fosters a highly competitive environment. Market concentration is rigorously assessed through established metrics such as the Herfindahl-Hirschman Index (HHI) and comprehensive analysis of the top 5 and top 10 market share distributions. While precise HHI figures are dynamic and subject to ongoing data collection, our current analysis and future projections indicate a robust competitive intensity within the market.
Key Drivers of Innovation: The relentless pace of innovation in this sector is propelled by significant technological breakthroughs in battery chemistries, most notably the widespread adoption of lithium-ion and the continued refinement of lead-acid technologies. The escalating demand for sophisticated energy storage solutions (ESS) to support renewable energy integration and grid stability, coupled with increasingly stringent environmental regulations that favor cleaner and more sustainable energy technologies, are pivotal forces shaping market development.
The Influence of Regulatory Frameworks: Government policies globally play a crucial role in shaping the industrial battery market. Initiatives promoting the widespread adoption of renewable energy sources and the burgeoning electric vehicle (EV) sector are direct catalysts for market expansion. Furthermore, stringent safety standards and comprehensive environmental regulations governing battery disposal and recycling are instrumental in driving responsible industry practices and fostering a circular economy approach.
Assessing Product Substitutes: While direct substitutes for industrial batteries remain limited in their current capacity, the emergence of alternative energy storage technologies, such as advanced fuel cells and high-performance supercapacitors, presents a potential long-term competitive challenge. The market actively monitors these emerging technologies for their potential to disrupt established supply chains and application areas.
Evolving End-User Trends: The pervasive trend of automation and electrification across a multitude of industries is a significant growth driver for industrial batteries. Sectors such as manufacturing, power generation and distribution, and telecommunications are increasingly reliant on high-performance, reliable industrial batteries to power their operations and support their growth trajectories.
Mergers & Acquisitions (M&A) Landscape: The industrial battery market has been an active arena for mergers and acquisitions in recent years. These strategic moves are primarily aimed at bolstering product portfolios, expanding geographic footprints, and enhancing technological capabilities. The cumulative value of M&A deals between 2019 and 2024 is estimated to be approximately [Insert Specific Value Here] Million, with individual transactions ranging from [Insert Lower Value Here] Million to [Insert Higher Value Here] Million. Notable M&A activities in this period include [mention specific M&A examples if available, with values, e.g., "Company X's acquisition of Company Y for $XX million, aimed at integrating their advanced lithium-ion technology"].
Industrial Battery Market Industry Trends & Insights
The global industrial battery market is experiencing robust growth, driven by the increasing demand for reliable and efficient energy storage solutions across various sectors. The market's Compound Annual Growth Rate (CAGR) during the forecast period (2025-2033) is projected to be xx%, with a market size reaching xx Million by 2033. This growth is fueled by several key factors:
Technological Disruptions: The shift towards high-energy-density lithium-ion batteries and improvements in lead-acid battery technology are significantly impacting market dynamics. Lithium-ion batteries are gaining market share due to their higher energy density and longer lifespan, although lead-acid batteries remain dominant in certain applications due to cost-effectiveness.
Consumer Preferences: End-users increasingly prioritize longer battery life, improved safety features, and reduced environmental impact. This has driven the demand for advanced battery management systems (BMS) and eco-friendly battery recycling solutions.
Competitive Dynamics: The market is characterized by intense competition, with both established players and emerging companies vying for market share. Competitive strategies include product innovation, strategic partnerships, and geographic expansion.
Market Penetration: The penetration of industrial batteries in various end-user industries, particularly in the renewable energy sector, is rapidly increasing, driven by the growth of renewable energy sources and the need for reliable energy storage. Market penetration in the renewable energy sector is projected to reach xx% by 2033.
Dominant Markets & Segments in Industrial Battery Market
Leading Region/Country: The Asia-Pacific region currently stands as the leading market for industrial batteries. This dominance is primarily attributed to the rapid pace of industrialization and the significant expansion of the renewable energy sector within key economies such as China and India. These countries are experiencing substantial investments in grid modernization, electric mobility, and industrial automation, all of which are substantial consumers of industrial battery solutions.
Dominant Market Segments:
-
End-User Industry: The Power Sector, encompassing Energy Storage Systems (ESS) for renewable energy integration and Uninterruptible Power Supplies (UPS) for critical infrastructure, emerges as the most dominant end-user segment. The ever-increasing global commitment to renewable energy and the imperative for grid stability are major drivers for this segment. Additionally, the Oil & Gas sector represents a significant and growing market, driven by the escalating demand for reliable battery power in demanding offshore platforms and extensive pipeline networks.
-
Technology: While Lead-acid batteries continue to hold a substantial market share due to their established cost-effectiveness and proven reliability in many applications, Lithium-ion batteries are experiencing rapid and sustained growth. This surge is attributed to their superior energy density, longer cycle life, and enhanced performance characteristics, making them increasingly attractive for advanced applications. Other technologies, including Nickel Cadmium, Nickel Metal Hydride, and Zinc Carbon, cater to specific niche applications where their unique properties are advantageous.
-
Application: In terms of application, Forklifts (material handling), Telecom infrastructure (including backup power solutions), and UPS systems for various critical facilities are identified as the primary and most significant application segments for industrial batteries. The ongoing electrification of logistics and the continuous expansion of global communication networks are key contributors to demand in these areas.
Key Growth Enablers:
-
Supportive Economic Policies: Proactive government incentives, tax credits, and subsidies directed towards the promotion of renewable energy adoption and the advancement of the electric vehicle ecosystem are powerful drivers propelling market growth.
-
Robust Infrastructure Development: The ongoing expansion and modernization of global power grids and telecommunications networks necessitate substantial investments in reliable power backup and storage solutions, thereby boosting the demand for industrial batteries.
-
Continuous Technological Advancements: The relentless pursuit of innovation in battery technology, leading to improvements in energy density, extended operational lifespan, enhanced safety features, and faster charging capabilities, plays a pivotal role in driving market expansion and enabling new applications.
Industrial Battery Market Product Developments
Recent product innovations focus on enhancing energy density, improving safety, and extending lifespan. Advancements in battery management systems (BMS) optimize battery performance and extend operational life. The market is seeing a growing demand for customized battery solutions tailored to specific end-user applications and operational requirements. This trend is driven by the need for optimized performance and increased efficiency.
Report Scope & Segmentation Analysis
The scope of this report encompasses a detailed analysis of the industrial battery market, segmented across several key dimensions to provide a comprehensive understanding of its dynamics and future trajectory. Our segmentation strategy ensures that market participants can identify opportunities and challenges within specific areas of the industry.
Segmentation by End-User Industry: The market is meticulously segmented by end-user industry. This includes, but is not limited to, the critical Power Sector (further broken down into Energy Storage Systems (ESS) and Uninterruptible Power Supplies (UPS)), the demanding Oil & Gas sector, the robust Manufacturing industry, the expansive Telecom sector, and various Other End-User Industries. For each segment, the report provides detailed growth projections, current market sizes, and an in-depth analysis of the competitive dynamics at play.
Segmentation by Technology: A granular analysis is performed on the market by battery technology. The primary categories covered are Lithium-ion batteries, Lead-acid batteries, and a consolidated category of Other Technologies, which includes Nickel Cadmium, Nickel Metal Hydride, and Zinc Carbon batteries. For each technology, the report details its current market share, projected growth potential, and the diverse application areas where it is predominantly utilized.
Segmentation by Application: The market is further segmented by specific applications, including Forklifts, Telecom (as a distinct application of backup power), UPS systems (as a broad application for various critical loads), and Other Applications that may include specialized industrial equipment and backup power solutions for diverse commercial settings. Comprehensive growth projections and market size estimations are provided for each application segment, accompanied by a thorough competitive landscape analysis.
Key Drivers of Industrial Battery Market Growth
The growth of the industrial battery market is driven by several key factors:
Technological advancements: Higher energy density, longer lifespan, and improved safety of batteries are fueling demand.
Government regulations: Policies promoting renewable energy and electric vehicles create a favorable environment for market expansion.
Economic growth: Increased industrial activity and infrastructure development drive demand for reliable and efficient energy storage.
Challenges in the Industrial Battery Market Sector
The industrial battery market faces certain challenges:
High raw material costs: The fluctuating prices of raw materials, such as lithium and cobalt, impact production costs and profitability.
Supply chain disruptions: Geopolitical instability and logistical challenges can affect the availability of raw materials and components.
Environmental concerns: The environmental impact of battery manufacturing and disposal remains a significant concern, with stricter regulations needed.
Emerging Opportunities in Industrial Battery Market
Emerging opportunities include:
Growth in renewable energy: The increasing adoption of solar and wind power necessitates reliable energy storage solutions.
Advancements in battery technology: Solid-state batteries and other next-generation technologies offer significant potential.
Expansion in electric vehicles: The growing demand for electric vehicles further increases demand for high-performance batteries.
Leading Players in the Industrial Battery Market Market
- Saft Groupe SA
- Leoch International Technology Limited Inc
- Enersys
- JYC Battery Manufacturer Co Ltd
- Exide Industries Ltd
- East Penn Manufacturing Company Inc
- GS Yuasa Corporation
- C&D Technologies Pvt Ltd
- Amar Raja Batteries Ltd
- Panasonic Corporation
Key Developments in Industrial Battery Market Industry
January 2023: ONGC Tripura Power Company and Assam Power Distribution Company Limited signed an agreement for a USD 245 Million battery storage project in Assam, featuring a 250MW/500MWh BESS.
October 2022: EnerSys expanded its presence in the Middle Tennessee Territory by granting exclusive sales and service rights for its motive power products, with support from IBCI.
Strategic Outlook for Industrial Battery Market Market
The industrial battery market is on a robust growth trajectory, propelled by a confluence of factors including groundbreaking technological advancements, increasingly supportive government policies worldwide, and the escalating demand for sophisticated energy storage solutions across a broad spectrum of industries. The future of this vital sector is intrinsically linked to the continued development and widespread adoption of next-generation battery technologies, such as solid-state batteries and advanced flow batteries. Furthermore, the establishment of comprehensive and sustainable battery recycling and repurposing solutions will be paramount in ensuring an environmentally responsible and economically viable future for the industrial battery market.
Industrial Battery Market Segmentation
-
1. Technology
- 1.1. Lithium-ion Battery
- 1.2. Lead-acid Battery
- 1.3. Other Te
-
2. Application
- 2.1. Forklift
- 2.2. Telecom
- 2.3. UPS
- 2.4. Other Applications
-
3. End-User Industry
- 3.1. Power Sector (incl. ESS, UPS, etc.)
- 3.2. Oil & Gas Sector
- 3.3. Manufacturing Sector
- 3.4. Telecom
- 3.5. Other End-User Industries
Industrial Battery Market Segmentation By Geography
-
1. North America
- 1.1. United States
- 1.2. Canada
- 1.3. Rest of North America
-
2. Europe
- 2.1. Germany
- 2.2. France
- 2.3. United Kingdom
- 2.4. Italy
- 2.5. Spain
- 2.6. Nordic Countries
- 2.7. Turkey
- 2.8. Russia
- 2.9. Rest of Europe
-
3. Asia Pacific
- 3.1. China
- 3.2. Japan
- 3.3. India
- 3.4. Australia
- 3.5. Malaysis
- 3.6. Indonesia
- 3.7. Thailand
- 3.8. Vietnam
- 3.9. Rest of Asia Pacific
-
4. South America
- 4.1. Brazil
- 4.2. Argentina
- 4.3. Chile
- 4.4. Colombia
- 4.5. Rest of South America
-
5. Middle East and Africa
- 5.1. United Arab Emirates
- 5.2. Saudi Arabia
- 5.3. Qatar
- 5.4. South Africa
- 5.5. Nigeria
- 5.6. Egypt
- 5.7. Rest of Middle East and Africa
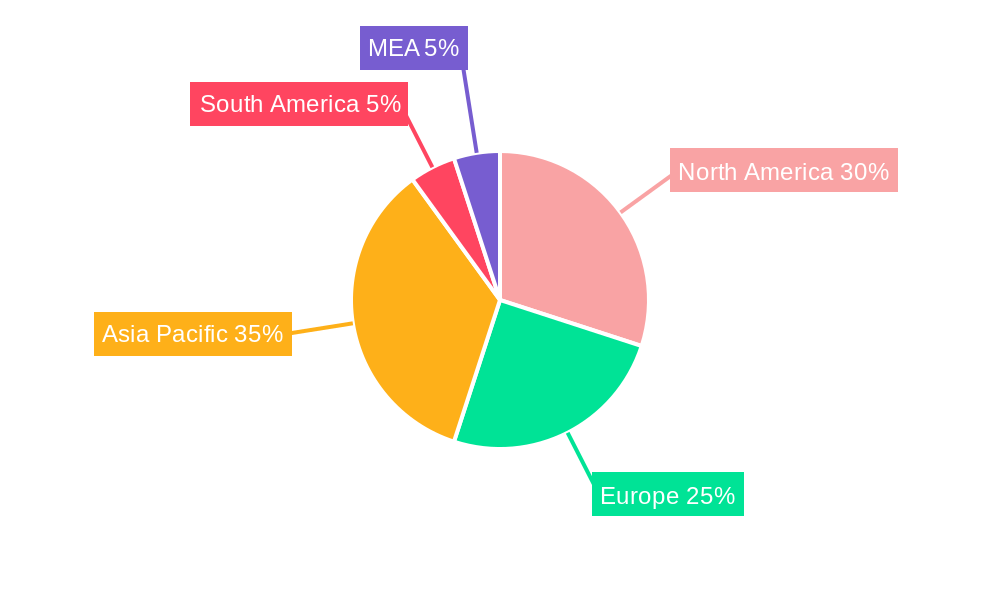
Industrial Battery Market Regional Market Share
Geographic Coverage of Industrial Battery Market
Industrial Battery Market REPORT HIGHLIGHTS
| Aspects | Details |
|---|---|
| Study Period | 2020-2034 |
| Base Year | 2025 |
| Estimated Year | 2026 |
| Forecast Period | 2026-2034 |
| Historical Period | 2020-2025 |
| Growth Rate | CAGR of 16.80% from 2020-2034 |
| Segmentation |
|
Table of Contents
- 1. Introduction
- 1.1. Research Scope
- 1.2. Market Segmentation
- 1.3. Research Objective
- 1.4. Definitions and Assumptions
- 2. Executive Summary
- 2.1. Market Snapshot
- 3. Market Dynamics
- 3.1. Market Drivers
- 3.2. Market Restrains
- 3.3. Market Trends
- 3.4. Market Opportunities
- 4. Market Factor Analysis
- 4.1. Porters Five Forces
- 4.1.1. Bargaining Power of Suppliers
- 4.1.2. Bargaining Power of Buyers
- 4.1.3. Threat of New Entrants
- 4.1.4. Threat of Substitutes
- 4.1.5. Competitive Rivalry
- 4.2. PESTEL analysis
- 4.3. BCG Analysis
- 4.3.1. Stars (High Growth, High Market Share)
- 4.3.2. Cash Cows (Low Growth, High Market Share)
- 4.3.3. Question Mark (High Growth, Low Market Share)
- 4.3.4. Dogs (Low Growth, Low Market Share)
- 4.4. Ansoff Matrix Analysis
- 4.5. Supply Chain Analysis
- 4.6. Regulatory Landscape
- 4.7. Current Market Potential and Opportunity Assessment (TAM–SAM–SOM Framework)
- 4.8. RAX Analyst Note
- 4.1. Porters Five Forces
- 5. Market Analysis, Insights and Forecast 2021-2033
- 5.1. Market Analysis, Insights and Forecast - by Technology
- 5.1.1. Lithium-ion Battery
- 5.1.2. Lead-acid Battery
- 5.1.3. Other Te
- 5.2. Market Analysis, Insights and Forecast - by Application
- 5.2.1. Forklift
- 5.2.2. Telecom
- 5.2.3. UPS
- 5.2.4. Other Applications
- 5.3. Market Analysis, Insights and Forecast - by End-User Industry
- 5.3.1. Power Sector (incl. ESS, UPS, etc.)
- 5.3.2. Oil & Gas Sector
- 5.3.3. Manufacturing Sector
- 5.3.4. Telecom
- 5.3.5. Other End-User Industries
- 5.4. Market Analysis, Insights and Forecast - by Region
- 5.4.1. North America
- 5.4.2. Europe
- 5.4.3. Asia Pacific
- 5.4.4. South America
- 5.4.5. Middle East and Africa
- 5.1. Market Analysis, Insights and Forecast - by Technology
- 6. Global Industrial Battery Market Analysis, Insights and Forecast, 2021-2033
- 6.1. Market Analysis, Insights and Forecast - by Technology
- 6.1.1. Lithium-ion Battery
- 6.1.2. Lead-acid Battery
- 6.1.3. Other Te
- 6.2. Market Analysis, Insights and Forecast - by Application
- 6.2.1. Forklift
- 6.2.2. Telecom
- 6.2.3. UPS
- 6.2.4. Other Applications
- 6.3. Market Analysis, Insights and Forecast - by End-User Industry
- 6.3.1. Power Sector (incl. ESS, UPS, etc.)
- 6.3.2. Oil & Gas Sector
- 6.3.3. Manufacturing Sector
- 6.3.4. Telecom
- 6.3.5. Other End-User Industries
- 6.1. Market Analysis, Insights and Forecast - by Technology
- 7. North America Industrial Battery Market Analysis, Insights and Forecast, 2020-2032
- 7.1. Market Analysis, Insights and Forecast - by Technology
- 7.1.1. Lithium-ion Battery
- 7.1.2. Lead-acid Battery
- 7.1.3. Other Te
- 7.2. Market Analysis, Insights and Forecast - by Application
- 7.2.1. Forklift
- 7.2.2. Telecom
- 7.2.3. UPS
- 7.2.4. Other Applications
- 7.3. Market Analysis, Insights and Forecast - by End-User Industry
- 7.3.1. Power Sector (incl. ESS, UPS, etc.)
- 7.3.2. Oil & Gas Sector
- 7.3.3. Manufacturing Sector
- 7.3.4. Telecom
- 7.3.5. Other End-User Industries
- 7.1. Market Analysis, Insights and Forecast - by Technology
- 8. Europe Industrial Battery Market Analysis, Insights and Forecast, 2020-2032
- 8.1. Market Analysis, Insights and Forecast - by Technology
- 8.1.1. Lithium-ion Battery
- 8.1.2. Lead-acid Battery
- 8.1.3. Other Te
- 8.2. Market Analysis, Insights and Forecast - by Application
- 8.2.1. Forklift
- 8.2.2. Telecom
- 8.2.3. UPS
- 8.2.4. Other Applications
- 8.3. Market Analysis, Insights and Forecast - by End-User Industry
- 8.3.1. Power Sector (incl. ESS, UPS, etc.)
- 8.3.2. Oil & Gas Sector
- 8.3.3. Manufacturing Sector
- 8.3.4. Telecom
- 8.3.5. Other End-User Industries
- 8.1. Market Analysis, Insights and Forecast - by Technology
- 9. Asia Pacific Industrial Battery Market Analysis, Insights and Forecast, 2020-2032
- 9.1. Market Analysis, Insights and Forecast - by Technology
- 9.1.1. Lithium-ion Battery
- 9.1.2. Lead-acid Battery
- 9.1.3. Other Te
- 9.2. Market Analysis, Insights and Forecast - by Application
- 9.2.1. Forklift
- 9.2.2. Telecom
- 9.2.3. UPS
- 9.2.4. Other Applications
- 9.3. Market Analysis, Insights and Forecast - by End-User Industry
- 9.3.1. Power Sector (incl. ESS, UPS, etc.)
- 9.3.2. Oil & Gas Sector
- 9.3.3. Manufacturing Sector
- 9.3.4. Telecom
- 9.3.5. Other End-User Industries
- 9.1. Market Analysis, Insights and Forecast - by Technology
- 10. South America Industrial Battery Market Analysis, Insights and Forecast, 2020-2032
- 10.1. Market Analysis, Insights and Forecast - by Technology
- 10.1.1. Lithium-ion Battery
- 10.1.2. Lead-acid Battery
- 10.1.3. Other Te
- 10.2. Market Analysis, Insights and Forecast - by Application
- 10.2.1. Forklift
- 10.2.2. Telecom
- 10.2.3. UPS
- 10.2.4. Other Applications
- 10.3. Market Analysis, Insights and Forecast - by End-User Industry
- 10.3.1. Power Sector (incl. ESS, UPS, etc.)
- 10.3.2. Oil & Gas Sector
- 10.3.3. Manufacturing Sector
- 10.3.4. Telecom
- 10.3.5. Other End-User Industries
- 10.1. Market Analysis, Insights and Forecast - by Technology
- 11. Middle East and Africa Industrial Battery Market Analysis, Insights and Forecast, 2020-2032
- 11.1. Market Analysis, Insights and Forecast - by Technology
- 11.1.1. Lithium-ion Battery
- 11.1.2. Lead-acid Battery
- 11.1.3. Other Te
- 11.2. Market Analysis, Insights and Forecast - by Application
- 11.2.1. Forklift
- 11.2.2. Telecom
- 11.2.3. UPS
- 11.2.4. Other Applications
- 11.3. Market Analysis, Insights and Forecast - by End-User Industry
- 11.3.1. Power Sector (incl. ESS, UPS, etc.)
- 11.3.2. Oil & Gas Sector
- 11.3.3. Manufacturing Sector
- 11.3.4. Telecom
- 11.3.5. Other End-User Industries
- 11.1. Market Analysis, Insights and Forecast - by Technology
- 12. Competitive Analysis
- 12.1. Company Profiles
- 12.1.1 Saft Groupe SA
- 12.1.1.1. Company Overview
- 12.1.1.2. Products
- 12.1.1.3. Company Financials
- 12.1.1.4. SWOT Analysis
- 12.1.2 Leoch International Technology Limited Inc
- 12.1.2.1. Company Overview
- 12.1.2.2. Products
- 12.1.2.3. Company Financials
- 12.1.2.4. SWOT Analysis
- 12.1.3 Enersys
- 12.1.3.1. Company Overview
- 12.1.3.2. Products
- 12.1.3.3. Company Financials
- 12.1.3.4. SWOT Analysis
- 12.1.4 JYC Battery Manufacturer Co Ltd *List Not Exhaustive 6 4 Market Ranking/Share Analysi
- 12.1.4.1. Company Overview
- 12.1.4.2. Products
- 12.1.4.3. Company Financials
- 12.1.4.4. SWOT Analysis
- 12.1.5 Exide Industries Ltd
- 12.1.5.1. Company Overview
- 12.1.5.2. Products
- 12.1.5.3. Company Financials
- 12.1.5.4. SWOT Analysis
- 12.1.6 East Penn Manufacturing Company Inc
- 12.1.6.1. Company Overview
- 12.1.6.2. Products
- 12.1.6.3. Company Financials
- 12.1.6.4. SWOT Analysis
- 12.1.7 GS Yuasa Corporation
- 12.1.7.1. Company Overview
- 12.1.7.2. Products
- 12.1.7.3. Company Financials
- 12.1.7.4. SWOT Analysis
- 12.1.8 C&D Technologies Pvt Ltd
- 12.1.8.1. Company Overview
- 12.1.8.2. Products
- 12.1.8.3. Company Financials
- 12.1.8.4. SWOT Analysis
- 12.1.9 Amar Raja batteries Ltd
- 12.1.9.1. Company Overview
- 12.1.9.2. Products
- 12.1.9.3. Company Financials
- 12.1.9.4. SWOT Analysis
- 12.1.10 Panasonic Corporation
- 12.1.10.1. Company Overview
- 12.1.10.2. Products
- 12.1.10.3. Company Financials
- 12.1.10.4. SWOT Analysis
- 12.1.1 Saft Groupe SA
- 12.2. Market Entropy
- 12.2.1 Company's Key Areas Served
- 12.2.2 Recent Developments
- 12.3. Company Market Share Analysis 2025
- 12.3.1 Top 5 Companies Market Share Analysis
- 12.3.2 Top 3 Companies Market Share Analysis
- 12.4. List of Potential Customers
- 13. Research Methodology
List of Figures
- Figure 1: Global Industrial Battery Market Revenue Breakdown (Million, %) by Region 2025 & 2033
- Figure 2: Global Industrial Battery Market Volume Breakdown (K Unit, %) by Region 2025 & 2033
- Figure 3: North America Industrial Battery Market Revenue (Million), by Technology 2025 & 2033
- Figure 4: North America Industrial Battery Market Volume (K Unit), by Technology 2025 & 2033
- Figure 5: North America Industrial Battery Market Revenue Share (%), by Technology 2025 & 2033
- Figure 6: North America Industrial Battery Market Volume Share (%), by Technology 2025 & 2033
- Figure 7: North America Industrial Battery Market Revenue (Million), by Application 2025 & 2033
- Figure 8: North America Industrial Battery Market Volume (K Unit), by Application 2025 & 2033
- Figure 9: North America Industrial Battery Market Revenue Share (%), by Application 2025 & 2033
- Figure 10: North America Industrial Battery Market Volume Share (%), by Application 2025 & 2033
- Figure 11: North America Industrial Battery Market Revenue (Million), by End-User Industry 2025 & 2033
- Figure 12: North America Industrial Battery Market Volume (K Unit), by End-User Industry 2025 & 2033
- Figure 13: North America Industrial Battery Market Revenue Share (%), by End-User Industry 2025 & 2033
- Figure 14: North America Industrial Battery Market Volume Share (%), by End-User Industry 2025 & 2033
- Figure 15: North America Industrial Battery Market Revenue (Million), by Country 2025 & 2033
- Figure 16: North America Industrial Battery Market Volume (K Unit), by Country 2025 & 2033
- Figure 17: North America Industrial Battery Market Revenue Share (%), by Country 2025 & 2033
- Figure 18: North America Industrial Battery Market Volume Share (%), by Country 2025 & 2033
- Figure 19: Europe Industrial Battery Market Revenue (Million), by Technology 2025 & 2033
- Figure 20: Europe Industrial Battery Market Volume (K Unit), by Technology 2025 & 2033
- Figure 21: Europe Industrial Battery Market Revenue Share (%), by Technology 2025 & 2033
- Figure 22: Europe Industrial Battery Market Volume Share (%), by Technology 2025 & 2033
- Figure 23: Europe Industrial Battery Market Revenue (Million), by Application 2025 & 2033
- Figure 24: Europe Industrial Battery Market Volume (K Unit), by Application 2025 & 2033
- Figure 25: Europe Industrial Battery Market Revenue Share (%), by Application 2025 & 2033
- Figure 26: Europe Industrial Battery Market Volume Share (%), by Application 2025 & 2033
- Figure 27: Europe Industrial Battery Market Revenue (Million), by End-User Industry 2025 & 2033
- Figure 28: Europe Industrial Battery Market Volume (K Unit), by End-User Industry 2025 & 2033
- Figure 29: Europe Industrial Battery Market Revenue Share (%), by End-User Industry 2025 & 2033
- Figure 30: Europe Industrial Battery Market Volume Share (%), by End-User Industry 2025 & 2033
- Figure 31: Europe Industrial Battery Market Revenue (Million), by Country 2025 & 2033
- Figure 32: Europe Industrial Battery Market Volume (K Unit), by Country 2025 & 2033
- Figure 33: Europe Industrial Battery Market Revenue Share (%), by Country 2025 & 2033
- Figure 34: Europe Industrial Battery Market Volume Share (%), by Country 2025 & 2033
- Figure 35: Asia Pacific Industrial Battery Market Revenue (Million), by Technology 2025 & 2033
- Figure 36: Asia Pacific Industrial Battery Market Volume (K Unit), by Technology 2025 & 2033
- Figure 37: Asia Pacific Industrial Battery Market Revenue Share (%), by Technology 2025 & 2033
- Figure 38: Asia Pacific Industrial Battery Market Volume Share (%), by Technology 2025 & 2033
- Figure 39: Asia Pacific Industrial Battery Market Revenue (Million), by Application 2025 & 2033
- Figure 40: Asia Pacific Industrial Battery Market Volume (K Unit), by Application 2025 & 2033
- Figure 41: Asia Pacific Industrial Battery Market Revenue Share (%), by Application 2025 & 2033
- Figure 42: Asia Pacific Industrial Battery Market Volume Share (%), by Application 2025 & 2033
- Figure 43: Asia Pacific Industrial Battery Market Revenue (Million), by End-User Industry 2025 & 2033
- Figure 44: Asia Pacific Industrial Battery Market Volume (K Unit), by End-User Industry 2025 & 2033
- Figure 45: Asia Pacific Industrial Battery Market Revenue Share (%), by End-User Industry 2025 & 2033
- Figure 46: Asia Pacific Industrial Battery Market Volume Share (%), by End-User Industry 2025 & 2033
- Figure 47: Asia Pacific Industrial Battery Market Revenue (Million), by Country 2025 & 2033
- Figure 48: Asia Pacific Industrial Battery Market Volume (K Unit), by Country 2025 & 2033
- Figure 49: Asia Pacific Industrial Battery Market Revenue Share (%), by Country 2025 & 2033
- Figure 50: Asia Pacific Industrial Battery Market Volume Share (%), by Country 2025 & 2033
- Figure 51: South America Industrial Battery Market Revenue (Million), by Technology 2025 & 2033
- Figure 52: South America Industrial Battery Market Volume (K Unit), by Technology 2025 & 2033
- Figure 53: South America Industrial Battery Market Revenue Share (%), by Technology 2025 & 2033
- Figure 54: South America Industrial Battery Market Volume Share (%), by Technology 2025 & 2033
- Figure 55: South America Industrial Battery Market Revenue (Million), by Application 2025 & 2033
- Figure 56: South America Industrial Battery Market Volume (K Unit), by Application 2025 & 2033
- Figure 57: South America Industrial Battery Market Revenue Share (%), by Application 2025 & 2033
- Figure 58: South America Industrial Battery Market Volume Share (%), by Application 2025 & 2033
- Figure 59: South America Industrial Battery Market Revenue (Million), by End-User Industry 2025 & 2033
- Figure 60: South America Industrial Battery Market Volume (K Unit), by End-User Industry 2025 & 2033
- Figure 61: South America Industrial Battery Market Revenue Share (%), by End-User Industry 2025 & 2033
- Figure 62: South America Industrial Battery Market Volume Share (%), by End-User Industry 2025 & 2033
- Figure 63: South America Industrial Battery Market Revenue (Million), by Country 2025 & 2033
- Figure 64: South America Industrial Battery Market Volume (K Unit), by Country 2025 & 2033
- Figure 65: South America Industrial Battery Market Revenue Share (%), by Country 2025 & 2033
- Figure 66: South America Industrial Battery Market Volume Share (%), by Country 2025 & 2033
- Figure 67: Middle East and Africa Industrial Battery Market Revenue (Million), by Technology 2025 & 2033
- Figure 68: Middle East and Africa Industrial Battery Market Volume (K Unit), by Technology 2025 & 2033
- Figure 69: Middle East and Africa Industrial Battery Market Revenue Share (%), by Technology 2025 & 2033
- Figure 70: Middle East and Africa Industrial Battery Market Volume Share (%), by Technology 2025 & 2033
- Figure 71: Middle East and Africa Industrial Battery Market Revenue (Million), by Application 2025 & 2033
- Figure 72: Middle East and Africa Industrial Battery Market Volume (K Unit), by Application 2025 & 2033
- Figure 73: Middle East and Africa Industrial Battery Market Revenue Share (%), by Application 2025 & 2033
- Figure 74: Middle East and Africa Industrial Battery Market Volume Share (%), by Application 2025 & 2033
- Figure 75: Middle East and Africa Industrial Battery Market Revenue (Million), by End-User Industry 2025 & 2033
- Figure 76: Middle East and Africa Industrial Battery Market Volume (K Unit), by End-User Industry 2025 & 2033
- Figure 77: Middle East and Africa Industrial Battery Market Revenue Share (%), by End-User Industry 2025 & 2033
- Figure 78: Middle East and Africa Industrial Battery Market Volume Share (%), by End-User Industry 2025 & 2033
- Figure 79: Middle East and Africa Industrial Battery Market Revenue (Million), by Country 2025 & 2033
- Figure 80: Middle East and Africa Industrial Battery Market Volume (K Unit), by Country 2025 & 2033
- Figure 81: Middle East and Africa Industrial Battery Market Revenue Share (%), by Country 2025 & 2033
- Figure 82: Middle East and Africa Industrial Battery Market Volume Share (%), by Country 2025 & 2033
List of Tables
- Table 1: Global Industrial Battery Market Revenue Million Forecast, by Technology 2020 & 2033
- Table 2: Global Industrial Battery Market Volume K Unit Forecast, by Technology 2020 & 2033
- Table 3: Global Industrial Battery Market Revenue Million Forecast, by Application 2020 & 2033
- Table 4: Global Industrial Battery Market Volume K Unit Forecast, by Application 2020 & 2033
- Table 5: Global Industrial Battery Market Revenue Million Forecast, by End-User Industry 2020 & 2033
- Table 6: Global Industrial Battery Market Volume K Unit Forecast, by End-User Industry 2020 & 2033
- Table 7: Global Industrial Battery Market Revenue Million Forecast, by Region 2020 & 2033
- Table 8: Global Industrial Battery Market Volume K Unit Forecast, by Region 2020 & 2033
- Table 9: Global Industrial Battery Market Revenue Million Forecast, by Technology 2020 & 2033
- Table 10: Global Industrial Battery Market Volume K Unit Forecast, by Technology 2020 & 2033
- Table 11: Global Industrial Battery Market Revenue Million Forecast, by Application 2020 & 2033
- Table 12: Global Industrial Battery Market Volume K Unit Forecast, by Application 2020 & 2033
- Table 13: Global Industrial Battery Market Revenue Million Forecast, by End-User Industry 2020 & 2033
- Table 14: Global Industrial Battery Market Volume K Unit Forecast, by End-User Industry 2020 & 2033
- Table 15: Global Industrial Battery Market Revenue Million Forecast, by Country 2020 & 2033
- Table 16: Global Industrial Battery Market Volume K Unit Forecast, by Country 2020 & 2033
- Table 17: United States Industrial Battery Market Revenue (Million) Forecast, by Application 2020 & 2033
- Table 18: United States Industrial Battery Market Volume (K Unit) Forecast, by Application 2020 & 2033
- Table 19: Canada Industrial Battery Market Revenue (Million) Forecast, by Application 2020 & 2033
- Table 20: Canada Industrial Battery Market Volume (K Unit) Forecast, by Application 2020 & 2033
- Table 21: Rest of North America Industrial Battery Market Revenue (Million) Forecast, by Application 2020 & 2033
- Table 22: Rest of North America Industrial Battery Market Volume (K Unit) Forecast, by Application 2020 & 2033
- Table 23: Global Industrial Battery Market Revenue Million Forecast, by Technology 2020 & 2033
- Table 24: Global Industrial Battery Market Volume K Unit Forecast, by Technology 2020 & 2033
- Table 25: Global Industrial Battery Market Revenue Million Forecast, by Application 2020 & 2033
- Table 26: Global Industrial Battery Market Volume K Unit Forecast, by Application 2020 & 2033
- Table 27: Global Industrial Battery Market Revenue Million Forecast, by End-User Industry 2020 & 2033
- Table 28: Global Industrial Battery Market Volume K Unit Forecast, by End-User Industry 2020 & 2033
- Table 29: Global Industrial Battery Market Revenue Million Forecast, by Country 2020 & 2033
- Table 30: Global Industrial Battery Market Volume K Unit Forecast, by Country 2020 & 2033
- Table 31: Germany Industrial Battery Market Revenue (Million) Forecast, by Application 2020 & 2033
- Table 32: Germany Industrial Battery Market Volume (K Unit) Forecast, by Application 2020 & 2033
- Table 33: France Industrial Battery Market Revenue (Million) Forecast, by Application 2020 & 2033
- Table 34: France Industrial Battery Market Volume (K Unit) Forecast, by Application 2020 & 2033
- Table 35: United Kingdom Industrial Battery Market Revenue (Million) Forecast, by Application 2020 & 2033
- Table 36: United Kingdom Industrial Battery Market Volume (K Unit) Forecast, by Application 2020 & 2033
- Table 37: Italy Industrial Battery Market Revenue (Million) Forecast, by Application 2020 & 2033
- Table 38: Italy Industrial Battery Market Volume (K Unit) Forecast, by Application 2020 & 2033
- Table 39: Spain Industrial Battery Market Revenue (Million) Forecast, by Application 2020 & 2033
- Table 40: Spain Industrial Battery Market Volume (K Unit) Forecast, by Application 2020 & 2033
- Table 41: Nordic Countries Industrial Battery Market Revenue (Million) Forecast, by Application 2020 & 2033
- Table 42: Nordic Countries Industrial Battery Market Volume (K Unit) Forecast, by Application 2020 & 2033
- Table 43: Turkey Industrial Battery Market Revenue (Million) Forecast, by Application 2020 & 2033
- Table 44: Turkey Industrial Battery Market Volume (K Unit) Forecast, by Application 2020 & 2033
- Table 45: Russia Industrial Battery Market Revenue (Million) Forecast, by Application 2020 & 2033
- Table 46: Russia Industrial Battery Market Volume (K Unit) Forecast, by Application 2020 & 2033
- Table 47: Rest of Europe Industrial Battery Market Revenue (Million) Forecast, by Application 2020 & 2033
- Table 48: Rest of Europe Industrial Battery Market Volume (K Unit) Forecast, by Application 2020 & 2033
- Table 49: Global Industrial Battery Market Revenue Million Forecast, by Technology 2020 & 2033
- Table 50: Global Industrial Battery Market Volume K Unit Forecast, by Technology 2020 & 2033
- Table 51: Global Industrial Battery Market Revenue Million Forecast, by Application 2020 & 2033
- Table 52: Global Industrial Battery Market Volume K Unit Forecast, by Application 2020 & 2033
- Table 53: Global Industrial Battery Market Revenue Million Forecast, by End-User Industry 2020 & 2033
- Table 54: Global Industrial Battery Market Volume K Unit Forecast, by End-User Industry 2020 & 2033
- Table 55: Global Industrial Battery Market Revenue Million Forecast, by Country 2020 & 2033
- Table 56: Global Industrial Battery Market Volume K Unit Forecast, by Country 2020 & 2033
- Table 57: China Industrial Battery Market Revenue (Million) Forecast, by Application 2020 & 2033
- Table 58: China Industrial Battery Market Volume (K Unit) Forecast, by Application 2020 & 2033
- Table 59: Japan Industrial Battery Market Revenue (Million) Forecast, by Application 2020 & 2033
- Table 60: Japan Industrial Battery Market Volume (K Unit) Forecast, by Application 2020 & 2033
- Table 61: India Industrial Battery Market Revenue (Million) Forecast, by Application 2020 & 2033
- Table 62: India Industrial Battery Market Volume (K Unit) Forecast, by Application 2020 & 2033
- Table 63: Australia Industrial Battery Market Revenue (Million) Forecast, by Application 2020 & 2033
- Table 64: Australia Industrial Battery Market Volume (K Unit) Forecast, by Application 2020 & 2033
- Table 65: Malaysis Industrial Battery Market Revenue (Million) Forecast, by Application 2020 & 2033
- Table 66: Malaysis Industrial Battery Market Volume (K Unit) Forecast, by Application 2020 & 2033
- Table 67: Indonesia Industrial Battery Market Revenue (Million) Forecast, by Application 2020 & 2033
- Table 68: Indonesia Industrial Battery Market Volume (K Unit) Forecast, by Application 2020 & 2033
- Table 69: Thailand Industrial Battery Market Revenue (Million) Forecast, by Application 2020 & 2033
- Table 70: Thailand Industrial Battery Market Volume (K Unit) Forecast, by Application 2020 & 2033
- Table 71: Vietnam Industrial Battery Market Revenue (Million) Forecast, by Application 2020 & 2033
- Table 72: Vietnam Industrial Battery Market Volume (K Unit) Forecast, by Application 2020 & 2033
- Table 73: Rest of Asia Pacific Industrial Battery Market Revenue (Million) Forecast, by Application 2020 & 2033
- Table 74: Rest of Asia Pacific Industrial Battery Market Volume (K Unit) Forecast, by Application 2020 & 2033
- Table 75: Global Industrial Battery Market Revenue Million Forecast, by Technology 2020 & 2033
- Table 76: Global Industrial Battery Market Volume K Unit Forecast, by Technology 2020 & 2033
- Table 77: Global Industrial Battery Market Revenue Million Forecast, by Application 2020 & 2033
- Table 78: Global Industrial Battery Market Volume K Unit Forecast, by Application 2020 & 2033
- Table 79: Global Industrial Battery Market Revenue Million Forecast, by End-User Industry 2020 & 2033
- Table 80: Global Industrial Battery Market Volume K Unit Forecast, by End-User Industry 2020 & 2033
- Table 81: Global Industrial Battery Market Revenue Million Forecast, by Country 2020 & 2033
- Table 82: Global Industrial Battery Market Volume K Unit Forecast, by Country 2020 & 2033
- Table 83: Brazil Industrial Battery Market Revenue (Million) Forecast, by Application 2020 & 2033
- Table 84: Brazil Industrial Battery Market Volume (K Unit) Forecast, by Application 2020 & 2033
- Table 85: Argentina Industrial Battery Market Revenue (Million) Forecast, by Application 2020 & 2033
- Table 86: Argentina Industrial Battery Market Volume (K Unit) Forecast, by Application 2020 & 2033
- Table 87: Chile Industrial Battery Market Revenue (Million) Forecast, by Application 2020 & 2033
- Table 88: Chile Industrial Battery Market Volume (K Unit) Forecast, by Application 2020 & 2033
- Table 89: Colombia Industrial Battery Market Revenue (Million) Forecast, by Application 2020 & 2033
- Table 90: Colombia Industrial Battery Market Volume (K Unit) Forecast, by Application 2020 & 2033
- Table 91: Rest of South America Industrial Battery Market Revenue (Million) Forecast, by Application 2020 & 2033
- Table 92: Rest of South America Industrial Battery Market Volume (K Unit) Forecast, by Application 2020 & 2033
- Table 93: Global Industrial Battery Market Revenue Million Forecast, by Technology 2020 & 2033
- Table 94: Global Industrial Battery Market Volume K Unit Forecast, by Technology 2020 & 2033
- Table 95: Global Industrial Battery Market Revenue Million Forecast, by Application 2020 & 2033
- Table 96: Global Industrial Battery Market Volume K Unit Forecast, by Application 2020 & 2033
- Table 97: Global Industrial Battery Market Revenue Million Forecast, by End-User Industry 2020 & 2033
- Table 98: Global Industrial Battery Market Volume K Unit Forecast, by End-User Industry 2020 & 2033
- Table 99: Global Industrial Battery Market Revenue Million Forecast, by Country 2020 & 2033
- Table 100: Global Industrial Battery Market Volume K Unit Forecast, by Country 2020 & 2033
- Table 101: United Arab Emirates Industrial Battery Market Revenue (Million) Forecast, by Application 2020 & 2033
- Table 102: United Arab Emirates Industrial Battery Market Volume (K Unit) Forecast, by Application 2020 & 2033
- Table 103: Saudi Arabia Industrial Battery Market Revenue (Million) Forecast, by Application 2020 & 2033
- Table 104: Saudi Arabia Industrial Battery Market Volume (K Unit) Forecast, by Application 2020 & 2033
- Table 105: Qatar Industrial Battery Market Revenue (Million) Forecast, by Application 2020 & 2033
- Table 106: Qatar Industrial Battery Market Volume (K Unit) Forecast, by Application 2020 & 2033
- Table 107: South Africa Industrial Battery Market Revenue (Million) Forecast, by Application 2020 & 2033
- Table 108: South Africa Industrial Battery Market Volume (K Unit) Forecast, by Application 2020 & 2033
- Table 109: Nigeria Industrial Battery Market Revenue (Million) Forecast, by Application 2020 & 2033
- Table 110: Nigeria Industrial Battery Market Volume (K Unit) Forecast, by Application 2020 & 2033
- Table 111: Egypt Industrial Battery Market Revenue (Million) Forecast, by Application 2020 & 2033
- Table 112: Egypt Industrial Battery Market Volume (K Unit) Forecast, by Application 2020 & 2033
- Table 113: Rest of Middle East and Africa Industrial Battery Market Revenue (Million) Forecast, by Application 2020 & 2033
- Table 114: Rest of Middle East and Africa Industrial Battery Market Volume (K Unit) Forecast, by Application 2020 & 2033
Frequently Asked Questions
1. What is the projected Compound Annual Growth Rate (CAGR) of the Industrial Battery Market?
The projected CAGR is approximately 16.80%.
2. Which companies are prominent players in the Industrial Battery Market?
Key companies in the market include Saft Groupe SA, Leoch International Technology Limited Inc, Enersys, JYC Battery Manufacturer Co Ltd *List Not Exhaustive 6 4 Market Ranking/Share Analysi, Exide Industries Ltd, East Penn Manufacturing Company Inc, GS Yuasa Corporation, C&D Technologies Pvt Ltd, Amar Raja batteries Ltd, Panasonic Corporation.
3. What are the main segments of the Industrial Battery Market?
The market segments include Technology, Application, End-User Industry.
4. Can you provide details about the market size?
The market size is estimated to be USD 37.82 Million as of 2022.
5. What are some drivers contributing to market growth?
4.; Declining Lithium-ion Battery Prices4.; Rising Renewable Energy Integration Worldwide.
6. What are the notable trends driving market growth?
Forklift Application Expected to Dominate the Market.
7. Are there any restraints impacting market growth?
4.; Uncertainty in Raw Material Prices.
8. Can you provide examples of recent developments in the market?
January 2023: Oil & Natural Gas Corporation (ONGC) subsidiary, ONGC Tripura Power Company, signed an agreement with Assam Power Distribution Company Limited (APDCL) for a large-scale battery storage project in Assam. The project is worth USD 245 million, and both companies will form a joint venture (JV) to develop a battery energy storage system (BESS) project with up to 250MW rated power output and 500MWh capacity.
9. What pricing options are available for accessing the report?
Pricing options include single-user, multi-user, and enterprise licenses priced at USD 4750, USD 5250, and USD 8750 respectively.
10. Is the market size provided in terms of value or volume?
The market size is provided in terms of value, measured in Million and volume, measured in K Unit.
11. Are there any specific market keywords associated with the report?
Yes, the market keyword associated with the report is "Industrial Battery Market," which aids in identifying and referencing the specific market segment covered.
12. How do I determine which pricing option suits my needs best?
The pricing options vary based on user requirements and access needs. Individual users may opt for single-user licenses, while businesses requiring broader access may choose multi-user or enterprise licenses for cost-effective access to the report.
13. Are there any additional resources or data provided in the Industrial Battery Market report?
While the report offers comprehensive insights, it's advisable to review the specific contents or supplementary materials provided to ascertain if additional resources or data are available.
14. How can I stay updated on further developments or reports in the Industrial Battery Market?
To stay informed about further developments, trends, and reports in the Industrial Battery Market, consider subscribing to industry newsletters, following relevant companies and organizations, or regularly checking reputable industry news sources and publications.
Methodology
Step 1 - Identification of Relevant Samples Size from Population Database


Step 2 - Approaches for Defining Global Market Size (Value, Volume* & Price*)

Note*: In applicable scenarios
Step 3 - Data Sources
Primary Research
- Web Analytics
- Survey Reports
- Research Institute
- Latest Research Reports
- Opinion Leaders
Secondary Research
- Annual Reports
- White Paper
- Latest Press Release
- Industry Association
- Paid Database
- Investor Presentations

Step 4 - Data Triangulation
Involves using different sources of information in order to increase the validity of a study
These sources are likely to be stakeholders in a program - participants, other researchers, program staff, other community members, and so on.
Then we put all data in single framework & apply various statistical tools to find out the dynamic on the market.
During the analysis stage, feedback from the stakeholder groups would be compared to determine areas of agreement as well as areas of divergence