

Key Insights
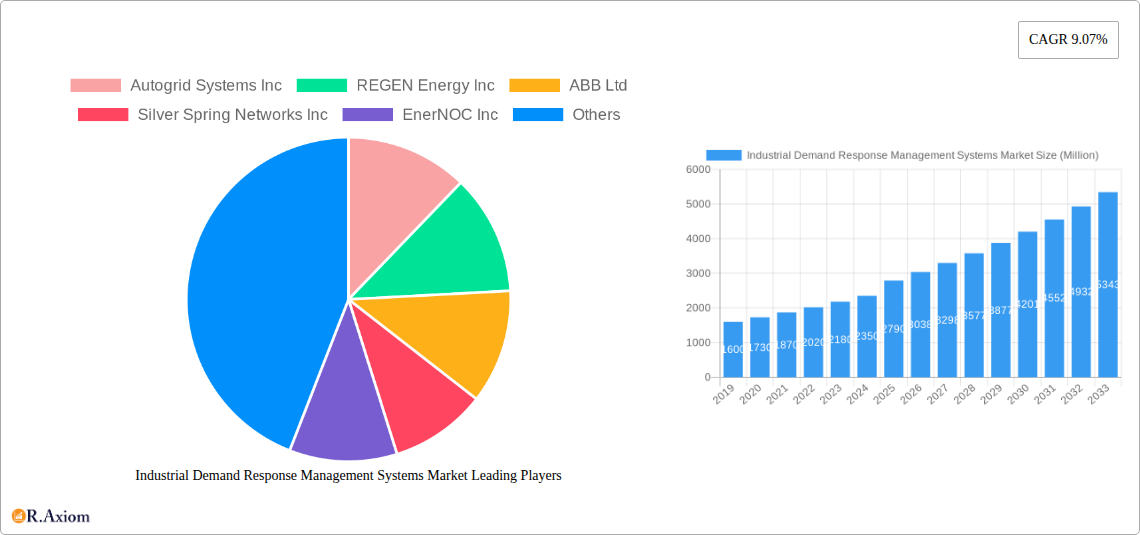
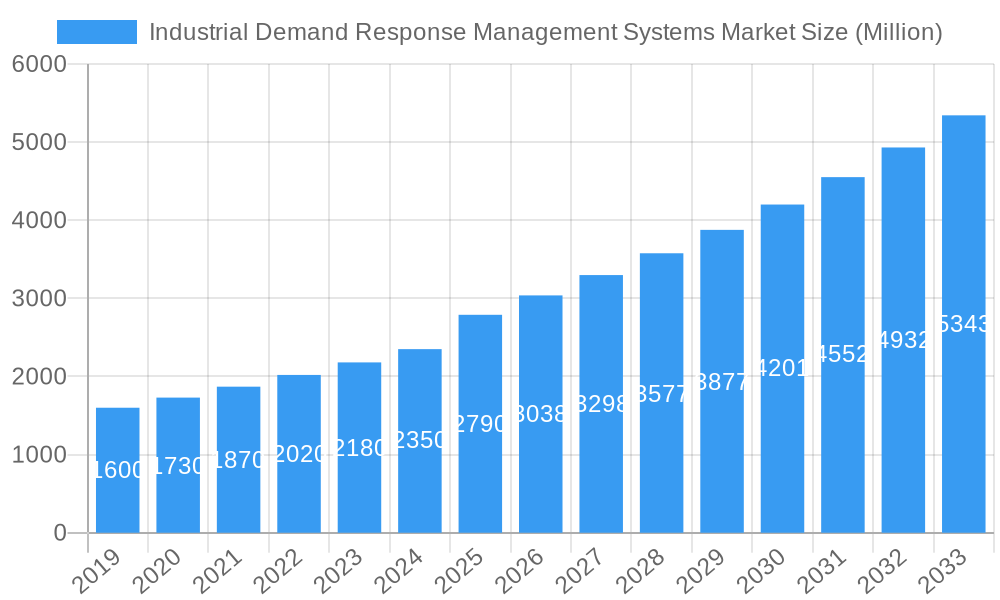
The Industrial Demand Response Management Systems (IDRMS) market is poised for significant expansion, projected to reach a substantial valuation by the end of the forecast period. With an impressive Compound Annual Growth Rate (CAGR) of 9.07%, this dynamic sector is being propelled by a confluence of factors aimed at enhancing grid stability and optimizing energy consumption in industrial settings. A primary driver for this growth is the increasing adoption of smart grid technologies, which enable more sophisticated control and communication for demand response programs. Furthermore, rising energy costs and stringent environmental regulations are compelling industrial players to seek efficient solutions for managing their electricity usage, thereby reducing operational expenses and their carbon footprint. The growing emphasis on renewable energy integration also plays a crucial role, as demand response systems are vital for balancing the intermittent nature of solar and wind power. The market's expansion is further bolstered by advancements in automation and artificial intelligence, leading to more intelligent and responsive demand management.
Industrial Demand Response Management Systems Market Market Size (In Billion)
The IDRMS market is segmented into two primary categories: Conventional Demand Response and Automated Demand Response. The Automated Demand Response segment is expected to witness a faster growth rate due to its inherent efficiency, real-time capabilities, and ability to seamlessly integrate with existing industrial infrastructure. Key companies such as Siemens AG, Schneider Electric SE, ABB Ltd, and General Electric Company are at the forefront of innovation, offering comprehensive solutions that cater to the evolving needs of the industrial sector. Geographically, North America and Europe currently lead the market, driven by mature smart grid initiatives and strong regulatory frameworks. However, the Asia Pacific region, particularly China and India, is anticipated to emerge as a high-growth market due to rapid industrialization and increasing investments in grid modernization. Emerging economies in South America and the Middle East & Africa also present considerable untapped potential as they focus on improving energy infrastructure and sustainability.
Industrial Demand Response Management Systems Market Company Market Share
This detailed report provides an in-depth analysis of the global Industrial Demand Response Management Systems (IDRMS) market, encompassing market dynamics, segmentation, key players, and future outlook. Covering the historical period from 2019 to 2024, with a base year of 2025 and a forecast period extending to 2033, this study is crucial for understanding the evolving landscape of grid management and energy optimization for industrial consumers. The market is driven by the increasing need for grid stability, the integration of renewable energy sources, and stringent energy efficiency regulations worldwide.
Industrial Demand Response Management Systems Market Market Concentration & Innovation
The Industrial Demand Response Management Systems market is characterized by moderate to high concentration, with a few leading players holding significant market share. Innovation is a key differentiator, driven by advancements in IoT, AI, and cloud computing, enabling more sophisticated and automated demand response strategies. Regulatory frameworks, such as government incentives and mandates for grid flexibility, play a pivotal role in shaping market growth. Product substitutes, like on-site energy generation and storage, are emerging but often complement rather than replace comprehensive IDRMS solutions. End-user trends lean towards automated, real-time control for enhanced operational efficiency and cost savings. Mergers and acquisitions (M&A) activities, with estimated deal values ranging from tens of millions to hundreds of millions of dollars, are prevalent as larger companies seek to consolidate their market position and acquire innovative technologies.
- Market Share Dynamics: Leading companies like Schneider Electric SE, Siemens AG, and General Electric Company collectively hold a substantial portion of the market.
- M&A Activities: Strategic acquisitions are common, aimed at expanding product portfolios and geographical reach. For instance, the acquisition of specialized software providers by larger industrial automation companies is a recurring theme.
- Innovation Drivers: Artificial intelligence for predictive load management, blockchain for secure energy trading, and advanced analytics for performance optimization are key innovation areas.
- Regulatory Impact: Policies promoting renewable energy integration and grid modernization directly influence the adoption of IDRMS.
- Product Substitution: While on-site generation and battery storage are alternatives for energy independence, they often integrate with IDRMS for coordinated grid interaction.
Industrial Demand Response Management Systems Market Industry Trends & Insights
The Industrial Demand Response Management Systems market is experiencing robust growth, projected to expand at a Compound Annual Growth Rate (CAGR) of approximately 15% over the forecast period. This surge is fueled by several critical industry trends. Firstly, the increasing integration of intermittent renewable energy sources, such as solar and wind power, into the grid necessitates advanced demand response capabilities to balance supply and demand fluctuations. Utilities and grid operators are actively deploying IDRMS to manage grid stability and avoid costly infrastructure upgrades. Secondly, escalating energy costs and the growing corporate focus on sustainability and Environmental, Social, and Governance (ESG) initiatives are pushing industrial sectors to adopt energy-efficient solutions. IDRMS offers a direct pathway to reduce energy consumption during peak hours, leading to significant cost savings and a lower carbon footprint.
Technological disruptions are profoundly impacting the market. The proliferation of the Internet of Things (IoT) sensors and smart devices within industrial facilities allows for granular data collection and real-time monitoring of energy consumption. This data fuels advanced analytics and machine learning algorithms, enabling sophisticated demand response strategies that can automatically shed or shift loads with minimal disruption to industrial operations. Cloud-based IDRMS platforms are becoming increasingly popular due to their scalability, flexibility, and ease of deployment, offering remote management and data access. Consumer preferences are shifting towards solutions that provide tangible economic benefits and contribute to grid resilience. Industrial end-users are seeking intelligent systems that can optimize their participation in various demand response programs, thereby generating additional revenue streams through grid services. Competitive dynamics are intensifying, with established players investing heavily in R&D and new entrants focusing on niche applications and innovative technologies. The market penetration of IDRMS is steadily increasing across various industrial verticals, including manufacturing, data centers, and heavy industries, as organizations recognize its strategic importance for operational efficiency and grid integration.
Dominant Markets & Segments in Industrial Demand Response Management Systems Market
The Industrial Demand Response Management Systems market is segmented by type into Conventional Demand Response and Automated Demand Response. Currently, Automated Demand Response (ADR) holds a dominant position and is projected to continue its lead throughout the forecast period. This dominance is driven by the inherent advantages of automation in complex industrial environments, where rapid and precise control over energy consumption is paramount.
Automated Demand Response (ADR):
- Technological Advancement: ADR leverages IoT devices, smart meters, and advanced control algorithms to automatically adjust energy consumption in response to grid signals or price fluctuations. This eliminates the need for manual intervention, ensuring faster response times and greater accuracy.
- Efficiency and Cost Savings: Industrial facilities adopting ADR can achieve significant reductions in energy costs by curtailing operations during peak demand periods, thereby avoiding high electricity tariffs. The ability to dynamically shift non-critical loads to off-peak hours offers substantial economic benefits.
- Grid Reliability: ADR plays a crucial role in enhancing grid stability by providing rapid and scalable load shedding capabilities. This is particularly vital with the increasing penetration of renewable energy sources, which can lead to grid volatility.
- Integration Capabilities: Modern ADR systems are designed for seamless integration with existing industrial control systems (ICS) and Building Management Systems (BMS), allowing for a holistic approach to energy management.
- Regulatory Support: Many regions are implementing policies and incentives that favor or mandate the adoption of automated demand response solutions, further accelerating their market penetration.
- Industry-Specific Applications: ADR is highly effective in sectors with predictable operational patterns, such as manufacturing plants with large machinery, data centers managing server loads, and cold storage facilities.
Conventional Demand Response:
- Maturity and Simplicity: Conventional demand response, which typically involves manual actions or pre-set schedules communicated through less sophisticated means, has a longer history in the market. It remains relevant for industries with simpler energy profiles or where immediate automation is not technically feasible or cost-effective.
- Lower Initial Investment: For some smaller industrial operations, the initial investment in conventional DR programs may be lower compared to fully automated systems.
- Human Oversight: In certain critical operations, a degree of human oversight in load shedding decisions is preferred.
However, the trend clearly favors automation due to its superior performance, responsiveness, and ability to meet the evolving demands of a dynamic grid. Regions with advanced grid infrastructure and supportive regulatory frameworks, such as North America and Europe, are leading in the adoption of ADR technologies. The economic incentives offered by utilities for participation in ADR programs, coupled with the operational efficiencies gained, make it the preferred choice for most industrial energy consumers seeking to optimize their energy strategies.
Industrial Demand Response Management Systems Market Product Developments
Product developments in the Industrial Demand Response Management Systems market are focused on enhancing automation, data analytics, and integration capabilities. Key innovations include AI-powered predictive load management, which anticipates grid stress and automatically optimizes industrial operations for maximum efficiency and minimal disruption. Advanced IoT integration enables granular control over individual equipment and processes, allowing for precise load shedding and shifting. Cloud-based platforms are offering enhanced scalability and remote management features, making sophisticated DR solutions accessible to a wider range of industrial facilities. The competitive advantage lies in solutions that offer seamless integration with existing infrastructure, deliver measurable cost savings, and contribute to grid stability, thereby meeting the growing demand for smart energy management.
Report Scope & Segmentation Analysis
This report provides a comprehensive analysis of the Industrial Demand Response Management Systems (IDRMS) market. The primary segmentation considered is by Type, which includes Conventional Demand Response and Automated Demand Response.
Conventional Demand Response: This segment encompasses traditional methods where industrial consumers manually reduce their electricity consumption based on price signals or direct requests from utilities. While less technologically advanced, it still plays a role in specific industrial contexts where immediate automation may not be feasible or economically justified. Its market size is expected to grow modestly, driven by existing infrastructure and a segment of the market that prioritizes simplicity.
Automated Demand Response: This segment represents the rapidly growing market for systems that automatically adjust energy consumption in response to grid conditions. Utilizing IoT, AI, and advanced control systems, ADR offers superior responsiveness, efficiency, and economic benefits. Growth projections for this segment are strong, fueled by technological advancements, increasing grid complexity, and supportive regulatory policies. Competitive dynamics in ADR are intense, with innovation and integration capabilities being key differentiators.
Key Drivers of Industrial Demand Response Management Systems Market Growth
The growth of the Industrial Demand Response Management Systems market is propelled by a confluence of technological, economic, and regulatory factors. The increasing penetration of renewable energy sources necessitates sophisticated grid management solutions like IDRMS to maintain stability and balance supply and demand. Economic drivers include the rising cost of electricity, pushing industrial entities to seek cost-saving measures through energy efficiency and optimized consumption. Government regulations and incentives promoting grid modernization, energy independence, and carbon emission reduction also significantly fuel market adoption.
- Grid Modernization Initiatives: Utilities and governments are investing in smart grids, which rely heavily on demand response for flexibility.
- Renewable Energy Integration: The intermittency of solar and wind power requires flexible loads that IDRMS can manage.
- Rising Energy Prices: High electricity costs incentivize industries to reduce consumption during peak demand.
- Sustainability Goals: Corporate ESG mandates and climate change concerns drive the adoption of energy-efficient technologies.
- Technological Advancements: IoT, AI, and cloud computing enable more sophisticated and automated DR solutions.
Challenges in the Industrial Demand Response Management Systems Market Sector
Despite its promising growth trajectory, the Industrial Demand Response Management Systems market faces several challenges. Regulatory fragmentation across different regions can create complexities for companies operating globally. The initial capital investment required for implementing advanced IDRMS solutions can be a significant barrier for some small and medium-sized enterprises (SMEs). Cybersecurity concerns related to connected industrial control systems and data privacy are also critical considerations that need robust solutions. Furthermore, ensuring seamless integration with diverse and often legacy industrial operational technology (OT) infrastructure presents a technical hurdle. The lack of standardized communication protocols can also impede interoperability between different systems and stakeholders.
- High Initial Investment Costs: The upfront cost of advanced IDRMS can be prohibitive for some businesses.
- Cybersecurity Vulnerabilities: Protecting critical industrial infrastructure from cyber threats is paramount.
- Regulatory Complexity: Varying regulations across jurisdictions can complicate market entry and operations.
- Integration with Legacy Systems: Interfacing new IDRMS with older OT infrastructure can be challenging.
- Lack of Standardization: Inconsistent communication protocols hinder interoperability.
Emerging Opportunities in Industrial Demand Response Management Systems Market
The Industrial Demand Response Management Systems market is ripe with emerging opportunities, driven by evolving energy landscapes and technological innovation. The increasing adoption of electric vehicles (EVs) presents a new frontier for demand response, as charging infrastructure can be intelligently managed to avoid grid strain. The development of decentralized energy resources (DERs), such as microgrids and battery storage, creates opportunities for IDRMS to orchestrate complex energy interactions between multiple assets. The growing demand for granular energy data and analytics provides an opening for solution providers offering advanced reporting and optimization services. Furthermore, the expansion of IDRMS into emerging economies, where grid infrastructure is rapidly developing, offers substantial growth potential.
- Electric Vehicle (EV) Charging Management: Optimizing EV charging schedules to benefit the grid and reduce costs.
- Decentralized Energy Resources (DERs) Integration: Orchestrating microgrids, battery storage, and other DERs for enhanced grid services.
- Advanced Data Analytics and Reporting: Offering insights into energy consumption patterns and performance optimization.
- Expansion into Emerging Markets: Tapping into developing economies with growing energy demands.
- Integration with Smart Manufacturing: Combining energy management with production efficiency for a holistic operational approach.
Leading Players in the Industrial Demand Response Management Systems Market Market
- Autogrid Systems Inc
- REGEN Energy Inc
- ABB Ltd
- Silver Spring Networks Inc
- EnerNOC Inc
- Hitachi Ltd
- Mitsubishi Electric Corporation
- Siemens AG
- Alstom SA
- Schneider Electric SE
- Eaton Corporation PLC
- General Electric Company
Key Developments in Industrial Demand Response Management Systems Market Industry
- June 2023: Vertiv launched its Vertiv EnerSav service, a solution designed to assist critical facility operators in achieving significant cost savings through targeted energy reduction. This service avoids substantial infrastructure investments by conducting rigorous on-site assessments and gap analyses. Vertiv's innovative External Digital Demand Response Technology (EDD-RT) further optimizes energy consumption by dynamically adapting manufacturer settings based on live consumption patterns.
- July 2023: CPower Energy and OBM announced their strategic partnership to integrate CPower's EnerWise Site Optimization technology ("EnerWise") into Foreman's mining management platform during the Mining Disrupt Conference. CPower collaborated with Foreman, enhancing the demand response functionality of Foreman's software. This collaboration enabled Foreman's customers to optimize their participation in demand response programs, thereby maximizing revenue generation while contributing to grid reliability.
- October 2023: Google conducted tests of a demand-response system designed to reduce electricity consumption for its data centers during times of stress on local grids in Taiwan, Oregon, and across Europe. The company planned to roll out the system more widely by shifting non-urgent computing tasks to other times and locations, assuring customers that this initiative would not impact Google services.
Strategic Outlook for Industrial Demand Response Management Systems Market Market
The strategic outlook for the Industrial Demand Response Management Systems market is overwhelmingly positive, driven by the accelerating global transition towards a more sustainable and resilient energy infrastructure. Growth catalysts include ongoing advancements in AI and IoT, which promise even more intelligent and autonomous energy management solutions. The increasing imperative for grid flexibility to accommodate higher renewable energy penetration will continue to elevate the importance of IDRMS. Furthermore, the growing focus on energy security and the desire to mitigate the impact of volatile energy prices will solidify the role of IDRMS as a critical tool for industrial competitiveness. Strategic investments in R&D, partnerships, and market expansion, particularly in rapidly developing economies, will be key for players aiming to capture market share and shape the future of industrial energy management.
Industrial Demand Response Management Systems Market Segmentation
-
1. Type
- 1.1. Conventional Demand Response
- 1.2. Automated Demand Response
Industrial Demand Response Management Systems Market Segmentation By Geography
-
1. North America
- 1.1. United States
- 1.2. Canada
- 1.3. Rest of North America
-
2. Asia Pacific
- 2.1. China
- 2.2. India
- 2.3. Japan
- 2.4. Australia
- 2.5. Malaysia
- 2.6. Thailand
- 2.7. Indonesia
- 2.8. Vietnam
- 2.9. Rest of Asia pacific
-
3. Europe
- 3.1. Germany
- 3.2. France
- 3.3. United Kingdom
- 3.4. Italy
- 3.5. Spain
- 3.6. Nordic
- 3.7. Turkey
- 3.8. Russia
- 3.9. Rest of Europe
-
4. South America
- 4.1. Brazil
- 4.2. Argentina
- 4.3. Chile
- 4.4. Colombia
- 4.5. Rest of South America
-
5. Middle East and Africa
- 5.1. Saudi Arabia
- 5.2. United Arab Emirates
- 5.3. South Africa
- 5.4. Qatar
- 5.5. Egypt
- 5.6. Nigeria
- 5.7. Rest of Middle East
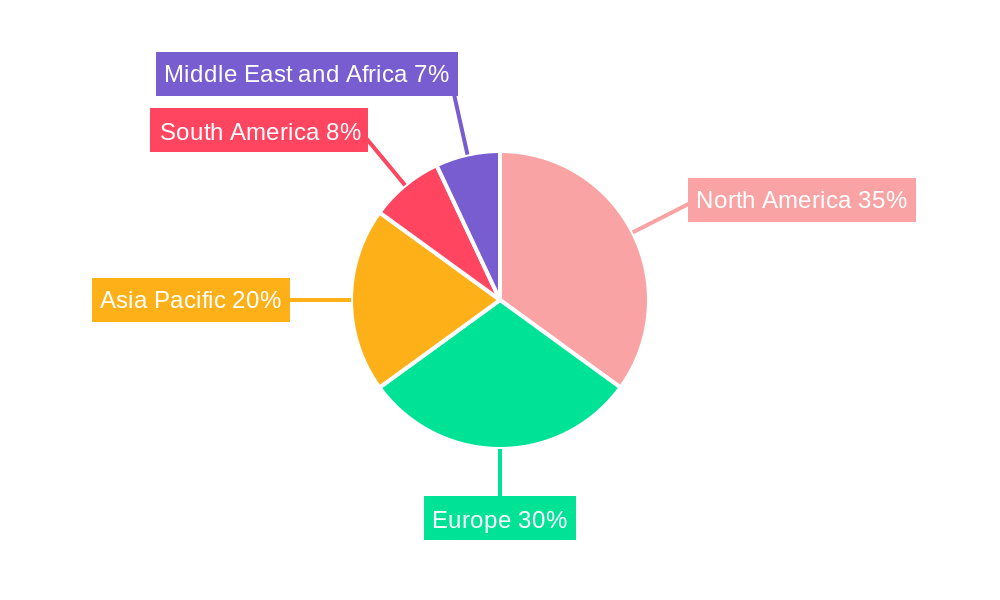
Industrial Demand Response Management Systems Market Regional Market Share
Geographic Coverage of Industrial Demand Response Management Systems Market
Industrial Demand Response Management Systems Market REPORT HIGHLIGHTS
| Aspects | Details |
|---|---|
| Study Period | 2020-2034 |
| Base Year | 2025 |
| Estimated Year | 2026 |
| Forecast Period | 2026-2034 |
| Historical Period | 2020-2025 |
| Growth Rate | CAGR of 9.07% from 2020-2034 |
| Segmentation |
|
Table of Contents
- 1. Introduction
- 1.1. Research Scope
- 1.2. Market Segmentation
- 1.3. Research Objective
- 1.4. Definitions and Assumptions
- 2. Executive Summary
- 2.1. Market Snapshot
- 3. Market Dynamics
- 3.1. Market Drivers
- 3.2. Market Restrains
- 3.3. Market Trends
- 3.4. Market Opportunities
- 4. Market Factor Analysis
- 4.1. Porters Five Forces
- 4.1.1. Bargaining Power of Suppliers
- 4.1.2. Bargaining Power of Buyers
- 4.1.3. Threat of New Entrants
- 4.1.4. Threat of Substitutes
- 4.1.5. Competitive Rivalry
- 4.2. PESTEL analysis
- 4.3. BCG Analysis
- 4.3.1. Stars (High Growth, High Market Share)
- 4.3.2. Cash Cows (Low Growth, High Market Share)
- 4.3.3. Question Mark (High Growth, Low Market Share)
- 4.3.4. Dogs (Low Growth, Low Market Share)
- 4.4. Ansoff Matrix Analysis
- 4.5. Supply Chain Analysis
- 4.6. Regulatory Landscape
- 4.7. Current Market Potential and Opportunity Assessment (TAM–SAM–SOM Framework)
- 4.8. RAX Analyst Note
- 4.1. Porters Five Forces
- 5. Market Analysis, Insights and Forecast 2021-2033
- 5.1. Market Analysis, Insights and Forecast - by Type
- 5.1.1. Conventional Demand Response
- 5.1.2. Automated Demand Response
- 5.2. Market Analysis, Insights and Forecast - by Region
- 5.2.1. North America
- 5.2.2. Asia Pacific
- 5.2.3. Europe
- 5.2.4. South America
- 5.2.5. Middle East and Africa
- 5.1. Market Analysis, Insights and Forecast - by Type
- 6. Global Industrial Demand Response Management Systems Market Analysis, Insights and Forecast, 2021-2033
- 6.1. Market Analysis, Insights and Forecast - by Type
- 6.1.1. Conventional Demand Response
- 6.1.2. Automated Demand Response
- 6.1. Market Analysis, Insights and Forecast - by Type
- 7. North America Industrial Demand Response Management Systems Market Analysis, Insights and Forecast, 2020-2032
- 7.1. Market Analysis, Insights and Forecast - by Type
- 7.1.1. Conventional Demand Response
- 7.1.2. Automated Demand Response
- 7.1. Market Analysis, Insights and Forecast - by Type
- 8. Asia Pacific Industrial Demand Response Management Systems Market Analysis, Insights and Forecast, 2020-2032
- 8.1. Market Analysis, Insights and Forecast - by Type
- 8.1.1. Conventional Demand Response
- 8.1.2. Automated Demand Response
- 8.1. Market Analysis, Insights and Forecast - by Type
- 9. Europe Industrial Demand Response Management Systems Market Analysis, Insights and Forecast, 2020-2032
- 9.1. Market Analysis, Insights and Forecast - by Type
- 9.1.1. Conventional Demand Response
- 9.1.2. Automated Demand Response
- 9.1. Market Analysis, Insights and Forecast - by Type
- 10. South America Industrial Demand Response Management Systems Market Analysis, Insights and Forecast, 2020-2032
- 10.1. Market Analysis, Insights and Forecast - by Type
- 10.1.1. Conventional Demand Response
- 10.1.2. Automated Demand Response
- 10.1. Market Analysis, Insights and Forecast - by Type
- 11. Middle East and Africa Industrial Demand Response Management Systems Market Analysis, Insights and Forecast, 2020-2032
- 11.1. Market Analysis, Insights and Forecast - by Type
- 11.1.1. Conventional Demand Response
- 11.1.2. Automated Demand Response
- 11.1. Market Analysis, Insights and Forecast - by Type
- 12. Competitive Analysis
- 12.1. Company Profiles
- 12.1.1 Autogrid Systems Inc
- 12.1.1.1. Company Overview
- 12.1.1.2. Products
- 12.1.1.3. Company Financials
- 12.1.1.4. SWOT Analysis
- 12.1.2 REGEN Energy Inc
- 12.1.2.1. Company Overview
- 12.1.2.2. Products
- 12.1.2.3. Company Financials
- 12.1.2.4. SWOT Analysis
- 12.1.3 ABB Ltd
- 12.1.3.1. Company Overview
- 12.1.3.2. Products
- 12.1.3.3. Company Financials
- 12.1.3.4. SWOT Analysis
- 12.1.4 Silver Spring Networks Inc
- 12.1.4.1. Company Overview
- 12.1.4.2. Products
- 12.1.4.3. Company Financials
- 12.1.4.4. SWOT Analysis
- 12.1.5 EnerNOC Inc
- 12.1.5.1. Company Overview
- 12.1.5.2. Products
- 12.1.5.3. Company Financials
- 12.1.5.4. SWOT Analysis
- 12.1.6 Hitachi Ltd
- 12.1.6.1. Company Overview
- 12.1.6.2. Products
- 12.1.6.3. Company Financials
- 12.1.6.4. SWOT Analysis
- 12.1.7 Mitsubishi Electric Corporation
- 12.1.7.1. Company Overview
- 12.1.7.2. Products
- 12.1.7.3. Company Financials
- 12.1.7.4. SWOT Analysis
- 12.1.8 Siemens AG
- 12.1.8.1. Company Overview
- 12.1.8.2. Products
- 12.1.8.3. Company Financials
- 12.1.8.4. SWOT Analysis
- 12.1.9 Alstom SA
- 12.1.9.1. Company Overview
- 12.1.9.2. Products
- 12.1.9.3. Company Financials
- 12.1.9.4. SWOT Analysis
- 12.1.10 Schneider Electric SE
- 12.1.10.1. Company Overview
- 12.1.10.2. Products
- 12.1.10.3. Company Financials
- 12.1.10.4. SWOT Analysis
- 12.1.11 Eaton Corporation PLC
- 12.1.11.1. Company Overview
- 12.1.11.2. Products
- 12.1.11.3. Company Financials
- 12.1.11.4. SWOT Analysis
- 12.1.12 General Electric Company
- 12.1.12.1. Company Overview
- 12.1.12.2. Products
- 12.1.12.3. Company Financials
- 12.1.12.4. SWOT Analysis
- 12.1.1 Autogrid Systems Inc
- 12.2. Market Entropy
- 12.2.1 Company's Key Areas Served
- 12.2.2 Recent Developments
- 12.3. Company Market Share Analysis 2025
- 12.3.1 Top 5 Companies Market Share Analysis
- 12.3.2 Top 3 Companies Market Share Analysis
- 12.4. List of Potential Customers
- 13. Research Methodology
List of Figures
- Figure 1: Global Industrial Demand Response Management Systems Market Revenue Breakdown (Million, %) by Region 2025 & 2033
- Figure 2: North America Industrial Demand Response Management Systems Market Revenue (Million), by Type 2025 & 2033
- Figure 3: North America Industrial Demand Response Management Systems Market Revenue Share (%), by Type 2025 & 2033
- Figure 4: North America Industrial Demand Response Management Systems Market Revenue (Million), by Country 2025 & 2033
- Figure 5: North America Industrial Demand Response Management Systems Market Revenue Share (%), by Country 2025 & 2033
- Figure 6: Asia Pacific Industrial Demand Response Management Systems Market Revenue (Million), by Type 2025 & 2033
- Figure 7: Asia Pacific Industrial Demand Response Management Systems Market Revenue Share (%), by Type 2025 & 2033
- Figure 8: Asia Pacific Industrial Demand Response Management Systems Market Revenue (Million), by Country 2025 & 2033
- Figure 9: Asia Pacific Industrial Demand Response Management Systems Market Revenue Share (%), by Country 2025 & 2033
- Figure 10: Europe Industrial Demand Response Management Systems Market Revenue (Million), by Type 2025 & 2033
- Figure 11: Europe Industrial Demand Response Management Systems Market Revenue Share (%), by Type 2025 & 2033
- Figure 12: Europe Industrial Demand Response Management Systems Market Revenue (Million), by Country 2025 & 2033
- Figure 13: Europe Industrial Demand Response Management Systems Market Revenue Share (%), by Country 2025 & 2033
- Figure 14: South America Industrial Demand Response Management Systems Market Revenue (Million), by Type 2025 & 2033
- Figure 15: South America Industrial Demand Response Management Systems Market Revenue Share (%), by Type 2025 & 2033
- Figure 16: South America Industrial Demand Response Management Systems Market Revenue (Million), by Country 2025 & 2033
- Figure 17: South America Industrial Demand Response Management Systems Market Revenue Share (%), by Country 2025 & 2033
- Figure 18: Middle East and Africa Industrial Demand Response Management Systems Market Revenue (Million), by Type 2025 & 2033
- Figure 19: Middle East and Africa Industrial Demand Response Management Systems Market Revenue Share (%), by Type 2025 & 2033
- Figure 20: Middle East and Africa Industrial Demand Response Management Systems Market Revenue (Million), by Country 2025 & 2033
- Figure 21: Middle East and Africa Industrial Demand Response Management Systems Market Revenue Share (%), by Country 2025 & 2033
List of Tables
- Table 1: Global Industrial Demand Response Management Systems Market Revenue Million Forecast, by Type 2020 & 2033
- Table 2: Global Industrial Demand Response Management Systems Market Revenue Million Forecast, by Region 2020 & 2033
- Table 3: Global Industrial Demand Response Management Systems Market Revenue Million Forecast, by Type 2020 & 2033
- Table 4: Global Industrial Demand Response Management Systems Market Revenue Million Forecast, by Country 2020 & 2033
- Table 5: United States Industrial Demand Response Management Systems Market Revenue (Million) Forecast, by Application 2020 & 2033
- Table 6: Canada Industrial Demand Response Management Systems Market Revenue (Million) Forecast, by Application 2020 & 2033
- Table 7: Rest of North America Industrial Demand Response Management Systems Market Revenue (Million) Forecast, by Application 2020 & 2033
- Table 8: Global Industrial Demand Response Management Systems Market Revenue Million Forecast, by Type 2020 & 2033
- Table 9: Global Industrial Demand Response Management Systems Market Revenue Million Forecast, by Country 2020 & 2033
- Table 10: China Industrial Demand Response Management Systems Market Revenue (Million) Forecast, by Application 2020 & 2033
- Table 11: India Industrial Demand Response Management Systems Market Revenue (Million) Forecast, by Application 2020 & 2033
- Table 12: Japan Industrial Demand Response Management Systems Market Revenue (Million) Forecast, by Application 2020 & 2033
- Table 13: Australia Industrial Demand Response Management Systems Market Revenue (Million) Forecast, by Application 2020 & 2033
- Table 14: Malaysia Industrial Demand Response Management Systems Market Revenue (Million) Forecast, by Application 2020 & 2033
- Table 15: Thailand Industrial Demand Response Management Systems Market Revenue (Million) Forecast, by Application 2020 & 2033
- Table 16: Indonesia Industrial Demand Response Management Systems Market Revenue (Million) Forecast, by Application 2020 & 2033
- Table 17: Vietnam Industrial Demand Response Management Systems Market Revenue (Million) Forecast, by Application 2020 & 2033
- Table 18: Rest of Asia pacific Industrial Demand Response Management Systems Market Revenue (Million) Forecast, by Application 2020 & 2033
- Table 19: Global Industrial Demand Response Management Systems Market Revenue Million Forecast, by Type 2020 & 2033
- Table 20: Global Industrial Demand Response Management Systems Market Revenue Million Forecast, by Country 2020 & 2033
- Table 21: Germany Industrial Demand Response Management Systems Market Revenue (Million) Forecast, by Application 2020 & 2033
- Table 22: France Industrial Demand Response Management Systems Market Revenue (Million) Forecast, by Application 2020 & 2033
- Table 23: United Kingdom Industrial Demand Response Management Systems Market Revenue (Million) Forecast, by Application 2020 & 2033
- Table 24: Italy Industrial Demand Response Management Systems Market Revenue (Million) Forecast, by Application 2020 & 2033
- Table 25: Spain Industrial Demand Response Management Systems Market Revenue (Million) Forecast, by Application 2020 & 2033
- Table 26: Nordic Industrial Demand Response Management Systems Market Revenue (Million) Forecast, by Application 2020 & 2033
- Table 27: Turkey Industrial Demand Response Management Systems Market Revenue (Million) Forecast, by Application 2020 & 2033
- Table 28: Russia Industrial Demand Response Management Systems Market Revenue (Million) Forecast, by Application 2020 & 2033
- Table 29: Rest of Europe Industrial Demand Response Management Systems Market Revenue (Million) Forecast, by Application 2020 & 2033
- Table 30: Global Industrial Demand Response Management Systems Market Revenue Million Forecast, by Type 2020 & 2033
- Table 31: Global Industrial Demand Response Management Systems Market Revenue Million Forecast, by Country 2020 & 2033
- Table 32: Brazil Industrial Demand Response Management Systems Market Revenue (Million) Forecast, by Application 2020 & 2033
- Table 33: Argentina Industrial Demand Response Management Systems Market Revenue (Million) Forecast, by Application 2020 & 2033
- Table 34: Chile Industrial Demand Response Management Systems Market Revenue (Million) Forecast, by Application 2020 & 2033
- Table 35: Colombia Industrial Demand Response Management Systems Market Revenue (Million) Forecast, by Application 2020 & 2033
- Table 36: Rest of South America Industrial Demand Response Management Systems Market Revenue (Million) Forecast, by Application 2020 & 2033
- Table 37: Global Industrial Demand Response Management Systems Market Revenue Million Forecast, by Type 2020 & 2033
- Table 38: Global Industrial Demand Response Management Systems Market Revenue Million Forecast, by Country 2020 & 2033
- Table 39: Saudi Arabia Industrial Demand Response Management Systems Market Revenue (Million) Forecast, by Application 2020 & 2033
- Table 40: United Arab Emirates Industrial Demand Response Management Systems Market Revenue (Million) Forecast, by Application 2020 & 2033
- Table 41: South Africa Industrial Demand Response Management Systems Market Revenue (Million) Forecast, by Application 2020 & 2033
- Table 42: Qatar Industrial Demand Response Management Systems Market Revenue (Million) Forecast, by Application 2020 & 2033
- Table 43: Egypt Industrial Demand Response Management Systems Market Revenue (Million) Forecast, by Application 2020 & 2033
- Table 44: Nigeria Industrial Demand Response Management Systems Market Revenue (Million) Forecast, by Application 2020 & 2033
- Table 45: Rest of Middle East Industrial Demand Response Management Systems Market Revenue (Million) Forecast, by Application 2020 & 2033
Frequently Asked Questions
1. What is the projected Compound Annual Growth Rate (CAGR) of the Industrial Demand Response Management Systems Market?
The projected CAGR is approximately 9.07%.
2. Which companies are prominent players in the Industrial Demand Response Management Systems Market?
Key companies in the market include Autogrid Systems Inc, REGEN Energy Inc, ABB Ltd, Silver Spring Networks Inc, EnerNOC Inc, Hitachi Ltd, Mitsubishi Electric Corporation, Siemens AG, Alstom SA, Schneider Electric SE, Eaton Corporation PLC, General Electric Company.
3. What are the main segments of the Industrial Demand Response Management Systems Market?
The market segments include Type.
4. Can you provide details about the market size?
The market size is estimated to be USD 2.79 Million as of 2022.
5. What are some drivers contributing to market growth?
4.; Need for Efficient Energy Management Systems4.; Growing Penetration of Renewable Energy Sources.
6. What are the notable trends driving market growth?
Growing Penetration of Renewable Energy Sources to Drive the Market.
7. Are there any restraints impacting market growth?
4.; Privacy Concerns on the Industrial Demand Response Management Systems.
8. Can you provide examples of recent developments in the market?
June 2023: Vertiv launched its Vertiv EnerSav service, helping critical facility operators unlock cost savings through targeted energy reduction. This service avoided substantial infrastructure investments by conducting rigorous on-site assessments and gap analyses. Vertiv's innovative External Digital Demand Response Technology (EDD-RT) further optimizes energy consumption by dynamically adapting manufacturer settings based on live consumption patterns.
9. What pricing options are available for accessing the report?
Pricing options include single-user, multi-user, and enterprise licenses priced at USD 4750, USD 5250, and USD 8750 respectively.
10. Is the market size provided in terms of value or volume?
The market size is provided in terms of value, measured in Million.
11. Are there any specific market keywords associated with the report?
Yes, the market keyword associated with the report is "Industrial Demand Response Management Systems Market," which aids in identifying and referencing the specific market segment covered.
12. How do I determine which pricing option suits my needs best?
The pricing options vary based on user requirements and access needs. Individual users may opt for single-user licenses, while businesses requiring broader access may choose multi-user or enterprise licenses for cost-effective access to the report.
13. Are there any additional resources or data provided in the Industrial Demand Response Management Systems Market report?
While the report offers comprehensive insights, it's advisable to review the specific contents or supplementary materials provided to ascertain if additional resources or data are available.
14. How can I stay updated on further developments or reports in the Industrial Demand Response Management Systems Market?
To stay informed about further developments, trends, and reports in the Industrial Demand Response Management Systems Market, consider subscribing to industry newsletters, following relevant companies and organizations, or regularly checking reputable industry news sources and publications.
Methodology
Step 1 - Identification of Relevant Samples Size from Population Database


Step 2 - Approaches for Defining Global Market Size (Value, Volume* & Price*)

Note*: In applicable scenarios
Step 3 - Data Sources
Primary Research
- Web Analytics
- Survey Reports
- Research Institute
- Latest Research Reports
- Opinion Leaders
Secondary Research
- Annual Reports
- White Paper
- Latest Press Release
- Industry Association
- Paid Database
- Investor Presentations

Step 4 - Data Triangulation
Involves using different sources of information in order to increase the validity of a study
These sources are likely to be stakeholders in a program - participants, other researchers, program staff, other community members, and so on.
Then we put all data in single framework & apply various statistical tools to find out the dynamic on the market.
During the analysis stage, feedback from the stakeholder groups would be compared to determine areas of agreement as well as areas of divergence