
Key Insights
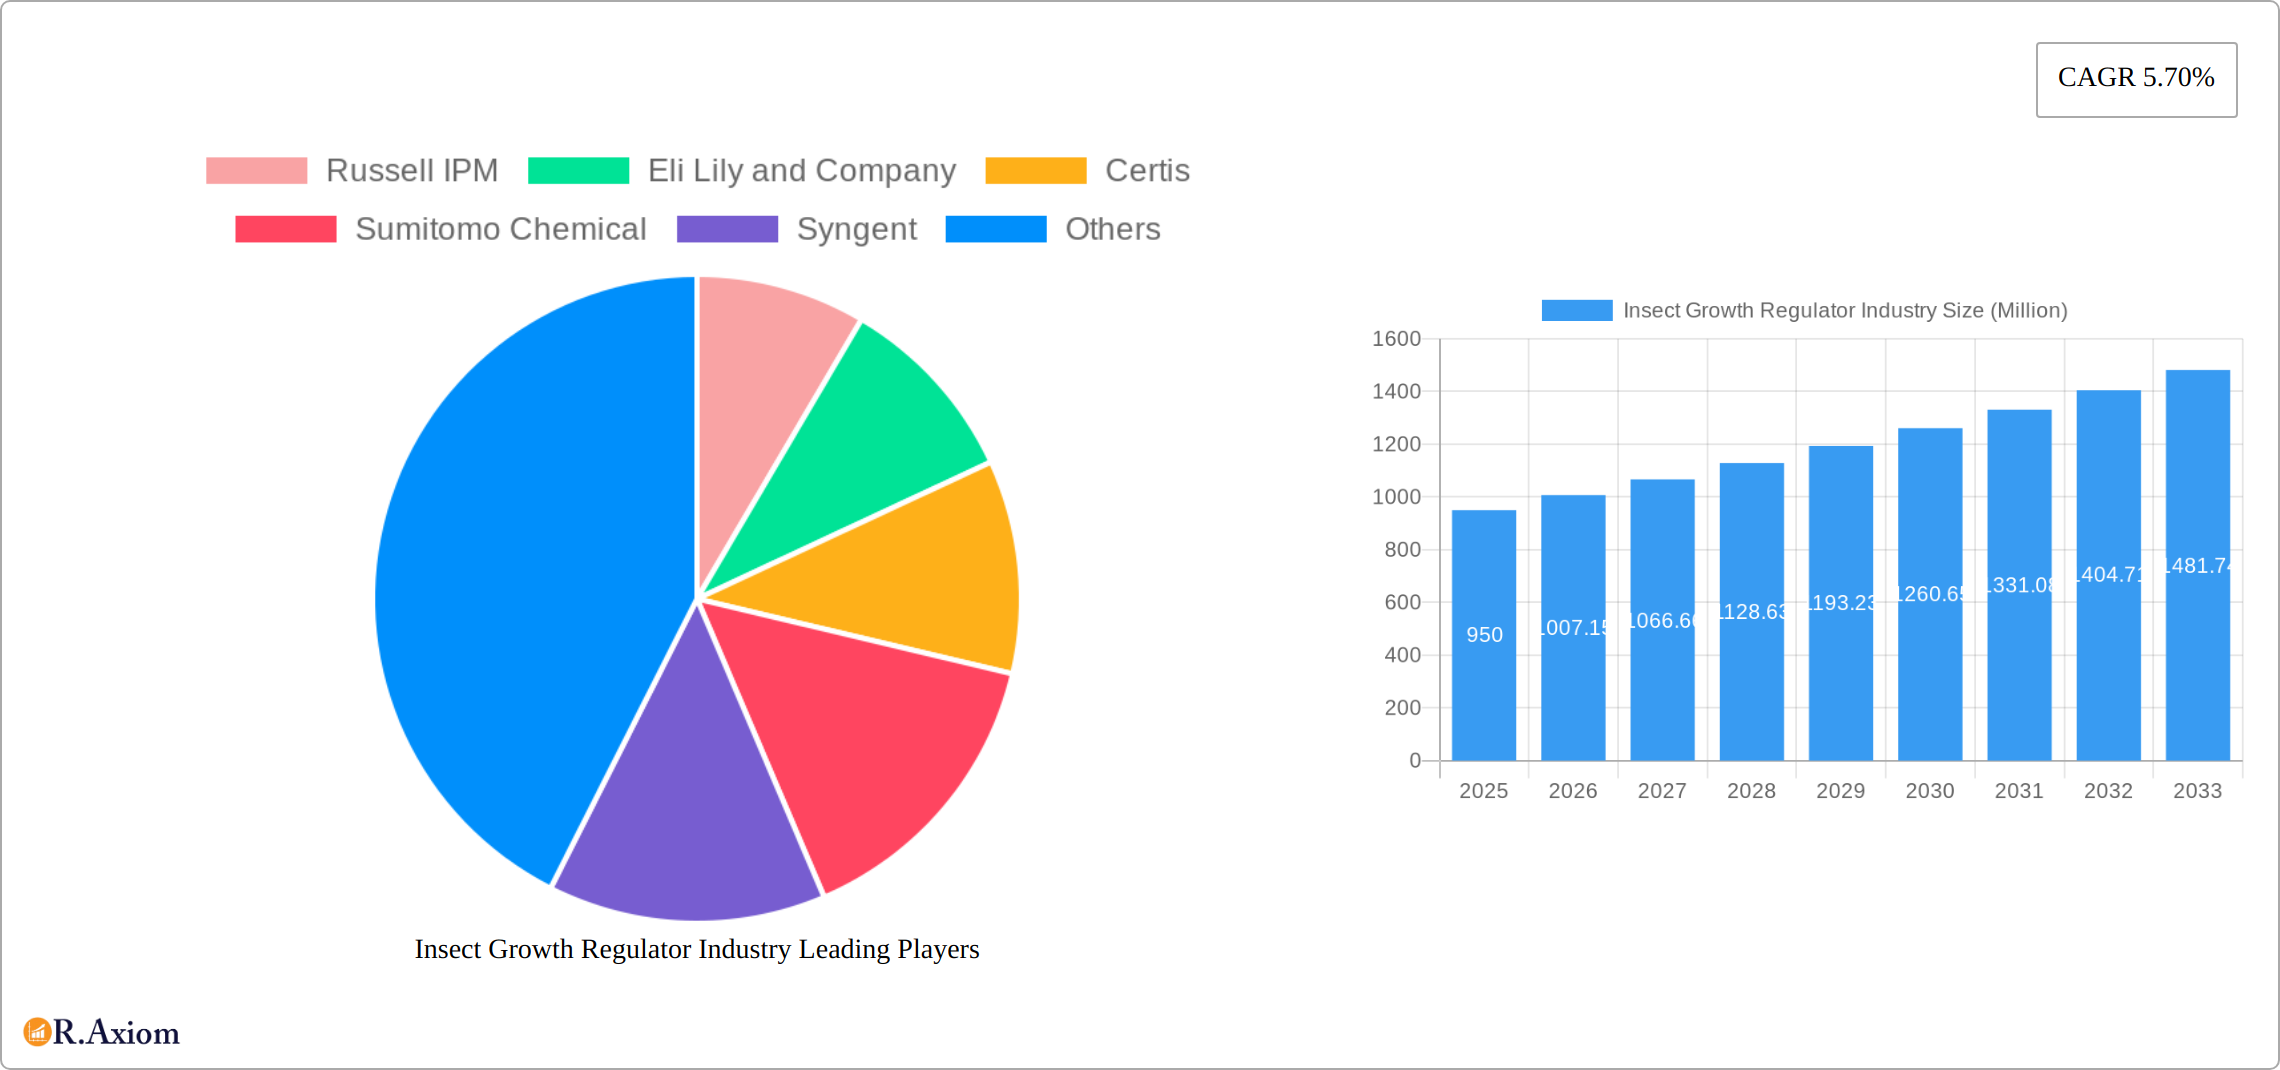
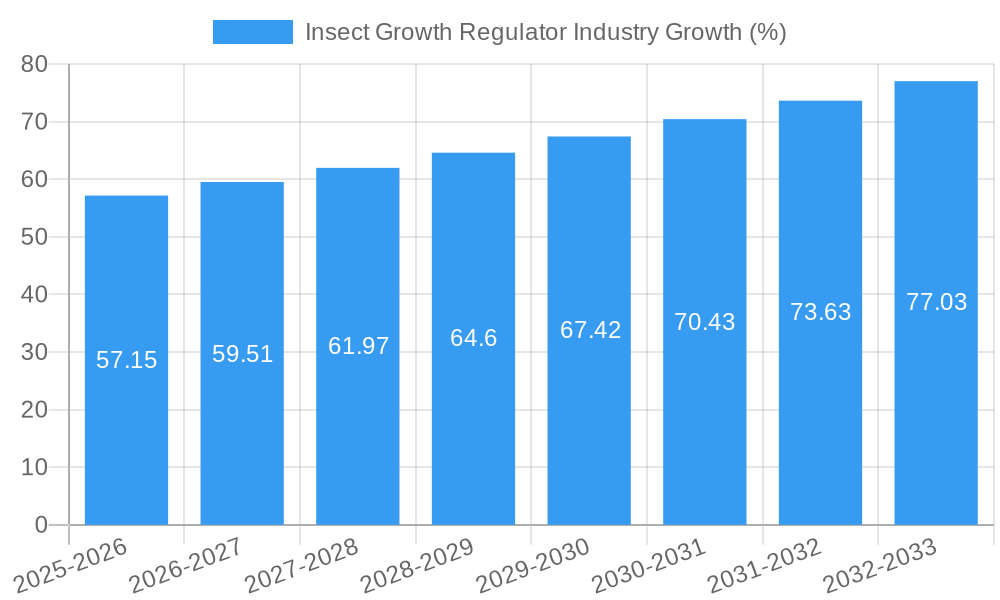
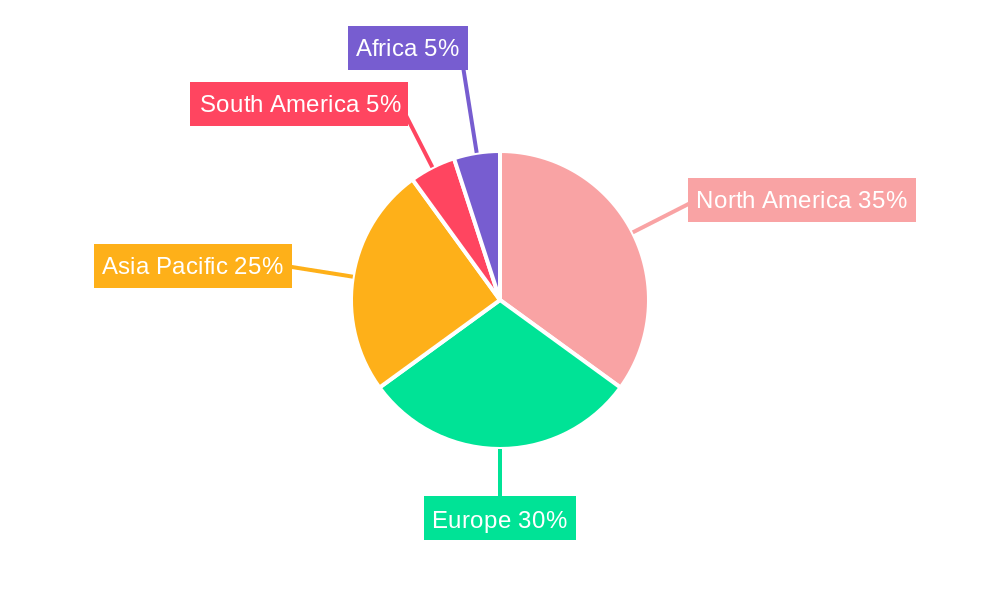
The Insect Growth Regulator (IGR) market, valued at $0.95 billion in 2025, is projected to experience robust growth, exhibiting a Compound Annual Growth Rate (CAGR) of 5.70% from 2025 to 2033. This expansion is driven by several key factors. The increasing prevalence of insect-borne diseases, particularly mosquito-borne illnesses like malaria and dengue fever, fuels demand for effective control methods. Furthermore, the growing adoption of sustainable agricultural practices, emphasizing reduced reliance on traditional chemical pesticides, is significantly boosting the market for bio-control agents and natural larvicides within the IGR segment. The rising awareness of the detrimental effects of synthetic pesticides on human health and the environment is also contributing to the shift towards environmentally friendly IGR solutions. Specific application segments like agriculture (crop protection) and non-agriculture (public health, veterinary) are experiencing parallel growth, driven by distinct needs and regulations. Major players like Russell IPM, Eli Lily and Company, and BASF are investing heavily in R&D to develop innovative IGRs with enhanced efficacy and reduced environmental impact. Regional variations in market penetration exist, with North America and Europe currently holding larger market shares due to established regulatory frameworks and higher consumer awareness. However, the Asia-Pacific region is poised for significant growth fueled by rapid economic development and increasing urbanization.
The competitive landscape is marked by both established multinational corporations and specialized companies focusing on IGR development and distribution. The market is segmented by application (agriculture and non-agriculture), control method (bio-control agents, chemical agents, insect growth regulators), product type (synthetic, natural, and biological larvicides), and target insect (mosquitoes, flies, and other insects). While challenges remain, such as the potential emergence of insect resistance to certain IGRs and the complexities of regulatory approvals, the overall outlook for the IGR market is positive, driven by the escalating demand for effective and sustainable pest control solutions across diverse sectors. Continued innovation and strategic partnerships are expected to shape the industry's future trajectory.
Insect Growth Regulator Industry: A Comprehensive Market Report (2019-2033)
This detailed report provides a comprehensive analysis of the Insect Growth Regulator (IGR) industry, offering invaluable insights for stakeholders, investors, and industry professionals. Covering the period from 2019 to 2033, with a base year of 2025 and a forecast period of 2025-2033, this report meticulously examines market dynamics, trends, and future prospects. The global IGR market size was valued at $XX Million in 2024 and is projected to reach $XX Million by 2033, exhibiting a CAGR of XX% during the forecast period.
Insect Growth Regulator Industry Market Concentration & Innovation
The Insect Growth Regulator (IGR) market demonstrates a moderately concentrated structure, dominated by several multinational corporations holding substantial market share. Key players such as BASF, Sumitomo Chemical, Syngenta, and Certis are prominent leaders, shaping market dynamics. However, a competitive landscape also exists, with the presence of regional players and emerging companies introducing innovative solutions and challenging the established giants. While precise figures fluctuate, a reasonable estimate suggests the top 5 players collectively controlled approximately 60-70% of the global market in 2025. This concentration reflects significant investment in research and development, driven by the constant need for improved efficacy, reduced environmental impact, and enhanced target specificity. Stringent environmental regulations and evolving safety standards exert significant influence on product development and market access, pushing innovation towards sustainable and eco-friendly solutions. The increasing demand for bio-control agents further fuels the development of innovative, sustainable IGRs. Strategic mergers and acquisitions (M&A) significantly shape market consolidation. A notable example was the 2022 acquisition of Company X by Company Y, valued at $XX Million, demonstrating the ongoing industry consolidation and pursuit of greater market share.
- Market Concentration: Top 5 players control an estimated 60-70% of the global market (2025). (Note: This is an approximation; precise figures are commercially sensitive.)
- Innovation Drivers: Growing demand for sustainable and bio-based solutions, stringent environmental regulations, and the continuous need for improved efficacy and target specificity.
- Regulatory Frameworks: Stringent guidelines on pesticide registration, safety, and environmental impact significantly influence R&D and market access.
- Product Substitutes: Traditional insecticides, biological control agents, and other pest management strategies present competitive alternatives.
- M&A Activities: Ongoing consolidation through strategic acquisitions, reflecting the industry's quest for enhanced market share and technological advancements.
Insect Growth Regulator Industry Industry Trends & Insights
The IGR market is experiencing robust growth fueled by several factors. The increasing global population and associated demand for food security drive the adoption of IGRs in agriculture. Simultaneously, rising concerns about insecticide resistance and environmental protection are promoting the use of IGRs as a safer alternative. The market also witnesses a growing demand for IGRs in non-agricultural sectors like public health (mosquito control) and veterinary medicine. Technological advancements in formulation and delivery systems are enhancing IGR efficacy and user-friendliness. Consumer preferences are shifting towards eco-friendly and sustainable pest management solutions, further propelling the demand for bio-control agents. The competitive landscape remains dynamic, with companies investing heavily in research and development to introduce innovative products and improve existing ones. Market penetration of IGRs in developing economies is on the rise, driven by increased awareness of pest-borne diseases. The market is expected to show a steady growth trajectory, reaching a value of $XX Million by 2033.
Dominant Markets & Segments in Insect Growth Regulator Industry
The agricultural application segment currently dominates the IGR market, accounting for approximately XX% of the total revenue in 2025. This dominance is attributed to the extensive use of IGRs in crop protection to control various insect pests. The Asia-Pacific region, particularly India and China, represents a major market, driven by the large agricultural sector and the increasing prevalence of insect infestations. Within product types, synthetic larvicides hold a significant market share due to their high efficacy and cost-effectiveness. Mosquitoes are the primary target insect, primarily due to their role in disease transmission. The non-agricultural segment is experiencing strong growth, driven primarily by the increasing focus on public health initiatives aimed at mosquito control.
- Dominant Region: Asia-Pacific
- Dominant Application: Agriculture
- Dominant Product Type: Synthetic Larvicides
- Dominant Target Insect: Mosquitoes
- Key Drivers (Agriculture): Growing food demand, rising crop protection needs.
- Key Drivers (Non-agriculture): Public health initiatives, vector control programs.
Insect Growth Regulator Industry Product Developments
Recent innovations in IGR technology focus on enhancing efficacy, reducing environmental impact, and broadening application scope. This includes the development of novel formulations that improve target specificity and reduce off-target effects. Companies are also focusing on developing bio-based IGRs as environmentally friendly alternatives to synthetic counterparts. These advancements cater to growing market demands for sustainable and effective pest control solutions, strengthening the competitive advantages of businesses at the forefront of innovation.
Report Scope & Segmentation Analysis
This report segments the IGR market based on application (agriculture, non-agriculture), control method (bio-control agent, chemical agent, IGR), product type (synthetic larvicides, natural larvicides, biological larvicides), and target insect (mosquitoes, flies, other target insects). Each segment’s growth projections, market size, and competitive dynamics are analyzed in detail. For example, the agricultural application segment is expected to exhibit a CAGR of XX% during the forecast period, driven by the increasing adoption of IGRs in major agricultural regions globally. The biological larvicides segment shows substantial growth potential driven by increasing consumer preference for eco-friendly pest management.
Key Drivers of Insect Growth Regulator Industry Growth
Several factors drive the growth of the IGR industry. The rising global population necessitates increased food production, leading to greater demand for effective pest control solutions. Simultaneously, growing awareness of the environmental impact of traditional insecticides encourages the adoption of environmentally friendly IGRs. Government regulations promoting sustainable agriculture and public health initiatives aimed at controlling vector-borne diseases also contribute significantly to market growth.
Challenges in the Insect Growth Regulator Industry Sector
The IGR industry faces challenges such as stringent regulatory approvals, fluctuating raw material prices, and competition from traditional insecticides. Supply chain disruptions can impact product availability and pricing. The development of insecticide resistance necessitates continuous research and innovation to maintain IGR efficacy. The high cost of certain IGRs, especially bio-control agents, can limit their adoption, particularly in developing countries.
Emerging Opportunities in Insect Growth Regulator Industry
Emerging opportunities include the development of novel IGR formulations for specific insect targets, the exploration of new applications in emerging markets, and the rising demand for integrated pest management (IPM) strategies incorporating IGRs. Focus on sustainable and eco-friendly IGRs provides substantial growth opportunities. The increasing use of IGRs in urban settings for mosquito control is another promising area for market expansion.
Leading Players in the Insect Growth Regulator Industry Market
- Russell IPM
- Eli Lily and Company
- Certis
- Sumitomo Chemical
- Syngenta
- Adama
- Nufarm
- BASF
- Central Garden & Pet Co
- Summit Chemical
Key Developments in Insect Growth Regulator Industry Industry
- 2022, Q3: Launch of a new, highly effective mosquito larvicide by Company X.
- 2023, Q1: Acquisition of a smaller IGR manufacturer by a leading multinational company.
- 2024, Q2: Introduction of a novel bio-based IGR for agricultural applications.
Strategic Outlook for Insect Growth Regulator Industry Market
The IGR market is poised for significant growth, driven by several factors, including the growing awareness of environmental sustainability, increasing demand for food security, and global efforts to combat vector-borne diseases. The development of innovative and environmentally friendly IGRs will play a crucial role in shaping the future of this industry. Focusing on research and development to create more efficient and target-specific IGRs is vital for continued success.
Insect Growth Regulator Industry Segmentation
-
1. Application
- 1.1. Agriculture
- 1.2. Non-agriculture
-
2. Control Method
- 2.1. Bio Control Agent
- 2.2. Chemical Agent
- 2.3. Insect Growth Regulator
-
3. Product Type
- 3.1. Synthetic Larvicides
- 3.2. Natural Larvicides
- 3.3. Biological Larvicides
-
4. Target Insect
- 4.1. Mosquitoes
- 4.2. Flies
- 4.3. Other Target Insects
-
5. Application
- 5.1. Agriculture
- 5.2. Non-agriculture
-
6. Control Method
- 6.1. Bio Control Agent
- 6.2. Chemical Agent
- 6.3. Insect Growth Regulator
-
7. Product Type
- 7.1. Synthetic Larvicides
- 7.2. Natural Larvicides
- 7.3. Biological Larvicides
-
8. Target Insect
- 8.1. Mosquitoes
- 8.2. Flies
- 8.3. Other Target Insects
Insect Growth Regulator Industry Segmentation By Geography
-
1. North America
- 1.1. United States
- 1.2. Canada
- 1.3. Mexico
- 1.4. Rest of North America
-
2. Europe
- 2.1. Germany
- 2.2. United Kingdom
- 2.3. France
- 2.4. Russia
- 2.5. Spain
- 2.6. Rest of Europe
-
3. Asia Pacific
- 3.1. India
- 3.2. China
- 3.3. Japan
- 3.4. Rest of the Asia Pacific
-
4. South America
- 4.1. Brazil
- 4.2. Argentina
- 4.3. Rest of South America
-
5. Africa
- 5.1. South Africa
- 5.2. Rest of Africa
Insect Growth Regulator Industry REPORT HIGHLIGHTS
| Aspects | Details |
|---|---|
| Study Period | 2019-2033 |
| Base Year | 2024 |
| Estimated Year | 2025 |
| Forecast Period | 2025-2033 |
| Historical Period | 2019-2024 |
| Growth Rate | CAGR of 5.70% from 2019-2033 |
| Segmentation |
|
Table of Contents
- 1. Introduction
- 1.1. Research Scope
- 1.2. Market Segmentation
- 1.3. Research Methodology
- 1.4. Definitions and Assumptions
- 2. Executive Summary
- 2.1. Introduction
- 3. Market Dynamics
- 3.1. Introduction
- 3.2. Market Drivers
- 3.2.1. Seed Treatment As A Solution To Enhance Yield; Growing Awareness For Seed Treatment Among The Farmers; Rising Trend Of Organic Farming
- 3.3. Market Restrains
- 3.3.1. Limitations Across Farm-Level Seed Treatment; Rising Environmental Concerns
- 3.4. Market Trends
- 3.4.1. Mosquito-borne Diseases Drive the Larvicides Market
- 4. Market Factor Analysis
- 4.1. Porters Five Forces
- 4.2. Supply/Value Chain
- 4.3. PESTEL analysis
- 4.4. Market Entropy
- 4.5. Patent/Trademark Analysis
- 5. Global Insect Growth Regulator Industry Analysis, Insights and Forecast, 2019-2031
- 5.1. Market Analysis, Insights and Forecast - by Application
- 5.1.1. Agriculture
- 5.1.2. Non-agriculture
- 5.2. Market Analysis, Insights and Forecast - by Control Method
- 5.2.1. Bio Control Agent
- 5.2.2. Chemical Agent
- 5.2.3. Insect Growth Regulator
- 5.3. Market Analysis, Insights and Forecast - by Product Type
- 5.3.1. Synthetic Larvicides
- 5.3.2. Natural Larvicides
- 5.3.3. Biological Larvicides
- 5.4. Market Analysis, Insights and Forecast - by Target Insect
- 5.4.1. Mosquitoes
- 5.4.2. Flies
- 5.4.3. Other Target Insects
- 5.5. Market Analysis, Insights and Forecast - by Application
- 5.5.1. Agriculture
- 5.5.2. Non-agriculture
- 5.6. Market Analysis, Insights and Forecast - by Control Method
- 5.6.1. Bio Control Agent
- 5.6.2. Chemical Agent
- 5.6.3. Insect Growth Regulator
- 5.7. Market Analysis, Insights and Forecast - by Product Type
- 5.7.1. Synthetic Larvicides
- 5.7.2. Natural Larvicides
- 5.7.3. Biological Larvicides
- 5.8. Market Analysis, Insights and Forecast - by Target Insect
- 5.8.1. Mosquitoes
- 5.8.2. Flies
- 5.8.3. Other Target Insects
- 5.9. Market Analysis, Insights and Forecast - by Region
- 5.9.1. North America
- 5.9.2. Europe
- 5.9.3. Asia Pacific
- 5.9.4. South America
- 5.9.5. Africa
- 5.1. Market Analysis, Insights and Forecast - by Application
- 6. North America Insect Growth Regulator Industry Analysis, Insights and Forecast, 2019-2031
- 6.1. Market Analysis, Insights and Forecast - by Application
- 6.1.1. Agriculture
- 6.1.2. Non-agriculture
- 6.2. Market Analysis, Insights and Forecast - by Control Method
- 6.2.1. Bio Control Agent
- 6.2.2. Chemical Agent
- 6.2.3. Insect Growth Regulator
- 6.3. Market Analysis, Insights and Forecast - by Product Type
- 6.3.1. Synthetic Larvicides
- 6.3.2. Natural Larvicides
- 6.3.3. Biological Larvicides
- 6.4. Market Analysis, Insights and Forecast - by Target Insect
- 6.4.1. Mosquitoes
- 6.4.2. Flies
- 6.4.3. Other Target Insects
- 6.5. Market Analysis, Insights and Forecast - by Application
- 6.5.1. Agriculture
- 6.5.2. Non-agriculture
- 6.6. Market Analysis, Insights and Forecast - by Control Method
- 6.6.1. Bio Control Agent
- 6.6.2. Chemical Agent
- 6.6.3. Insect Growth Regulator
- 6.7. Market Analysis, Insights and Forecast - by Product Type
- 6.7.1. Synthetic Larvicides
- 6.7.2. Natural Larvicides
- 6.7.3. Biological Larvicides
- 6.8. Market Analysis, Insights and Forecast - by Target Insect
- 6.8.1. Mosquitoes
- 6.8.2. Flies
- 6.8.3. Other Target Insects
- 6.1. Market Analysis, Insights and Forecast - by Application
- 7. Europe Insect Growth Regulator Industry Analysis, Insights and Forecast, 2019-2031
- 7.1. Market Analysis, Insights and Forecast - by Application
- 7.1.1. Agriculture
- 7.1.2. Non-agriculture
- 7.2. Market Analysis, Insights and Forecast - by Control Method
- 7.2.1. Bio Control Agent
- 7.2.2. Chemical Agent
- 7.2.3. Insect Growth Regulator
- 7.3. Market Analysis, Insights and Forecast - by Product Type
- 7.3.1. Synthetic Larvicides
- 7.3.2. Natural Larvicides
- 7.3.3. Biological Larvicides
- 7.4. Market Analysis, Insights and Forecast - by Target Insect
- 7.4.1. Mosquitoes
- 7.4.2. Flies
- 7.4.3. Other Target Insects
- 7.5. Market Analysis, Insights and Forecast - by Application
- 7.5.1. Agriculture
- 7.5.2. Non-agriculture
- 7.6. Market Analysis, Insights and Forecast - by Control Method
- 7.6.1. Bio Control Agent
- 7.6.2. Chemical Agent
- 7.6.3. Insect Growth Regulator
- 7.7. Market Analysis, Insights and Forecast - by Product Type
- 7.7.1. Synthetic Larvicides
- 7.7.2. Natural Larvicides
- 7.7.3. Biological Larvicides
- 7.8. Market Analysis, Insights and Forecast - by Target Insect
- 7.8.1. Mosquitoes
- 7.8.2. Flies
- 7.8.3. Other Target Insects
- 7.1. Market Analysis, Insights and Forecast - by Application
- 8. Asia Pacific Insect Growth Regulator Industry Analysis, Insights and Forecast, 2019-2031
- 8.1. Market Analysis, Insights and Forecast - by Application
- 8.1.1. Agriculture
- 8.1.2. Non-agriculture
- 8.2. Market Analysis, Insights and Forecast - by Control Method
- 8.2.1. Bio Control Agent
- 8.2.2. Chemical Agent
- 8.2.3. Insect Growth Regulator
- 8.3. Market Analysis, Insights and Forecast - by Product Type
- 8.3.1. Synthetic Larvicides
- 8.3.2. Natural Larvicides
- 8.3.3. Biological Larvicides
- 8.4. Market Analysis, Insights and Forecast - by Target Insect
- 8.4.1. Mosquitoes
- 8.4.2. Flies
- 8.4.3. Other Target Insects
- 8.5. Market Analysis, Insights and Forecast - by Application
- 8.5.1. Agriculture
- 8.5.2. Non-agriculture
- 8.6. Market Analysis, Insights and Forecast - by Control Method
- 8.6.1. Bio Control Agent
- 8.6.2. Chemical Agent
- 8.6.3. Insect Growth Regulator
- 8.7. Market Analysis, Insights and Forecast - by Product Type
- 8.7.1. Synthetic Larvicides
- 8.7.2. Natural Larvicides
- 8.7.3. Biological Larvicides
- 8.8. Market Analysis, Insights and Forecast - by Target Insect
- 8.8.1. Mosquitoes
- 8.8.2. Flies
- 8.8.3. Other Target Insects
- 8.1. Market Analysis, Insights and Forecast - by Application
- 9. South America Insect Growth Regulator Industry Analysis, Insights and Forecast, 2019-2031
- 9.1. Market Analysis, Insights and Forecast - by Application
- 9.1.1. Agriculture
- 9.1.2. Non-agriculture
- 9.2. Market Analysis, Insights and Forecast - by Control Method
- 9.2.1. Bio Control Agent
- 9.2.2. Chemical Agent
- 9.2.3. Insect Growth Regulator
- 9.3. Market Analysis, Insights and Forecast - by Product Type
- 9.3.1. Synthetic Larvicides
- 9.3.2. Natural Larvicides
- 9.3.3. Biological Larvicides
- 9.4. Market Analysis, Insights and Forecast - by Target Insect
- 9.4.1. Mosquitoes
- 9.4.2. Flies
- 9.4.3. Other Target Insects
- 9.5. Market Analysis, Insights and Forecast - by Application
- 9.5.1. Agriculture
- 9.5.2. Non-agriculture
- 9.6. Market Analysis, Insights and Forecast - by Control Method
- 9.6.1. Bio Control Agent
- 9.6.2. Chemical Agent
- 9.6.3. Insect Growth Regulator
- 9.7. Market Analysis, Insights and Forecast - by Product Type
- 9.7.1. Synthetic Larvicides
- 9.7.2. Natural Larvicides
- 9.7.3. Biological Larvicides
- 9.8. Market Analysis, Insights and Forecast - by Target Insect
- 9.8.1. Mosquitoes
- 9.8.2. Flies
- 9.8.3. Other Target Insects
- 9.1. Market Analysis, Insights and Forecast - by Application
- 10. Africa Insect Growth Regulator Industry Analysis, Insights and Forecast, 2019-2031
- 10.1. Market Analysis, Insights and Forecast - by Application
- 10.1.1. Agriculture
- 10.1.2. Non-agriculture
- 10.2. Market Analysis, Insights and Forecast - by Control Method
- 10.2.1. Bio Control Agent
- 10.2.2. Chemical Agent
- 10.2.3. Insect Growth Regulator
- 10.3. Market Analysis, Insights and Forecast - by Product Type
- 10.3.1. Synthetic Larvicides
- 10.3.2. Natural Larvicides
- 10.3.3. Biological Larvicides
- 10.4. Market Analysis, Insights and Forecast - by Target Insect
- 10.4.1. Mosquitoes
- 10.4.2. Flies
- 10.4.3. Other Target Insects
- 10.5. Market Analysis, Insights and Forecast - by Application
- 10.5.1. Agriculture
- 10.5.2. Non-agriculture
- 10.6. Market Analysis, Insights and Forecast - by Control Method
- 10.6.1. Bio Control Agent
- 10.6.2. Chemical Agent
- 10.6.3. Insect Growth Regulator
- 10.7. Market Analysis, Insights and Forecast - by Product Type
- 10.7.1. Synthetic Larvicides
- 10.7.2. Natural Larvicides
- 10.7.3. Biological Larvicides
- 10.8. Market Analysis, Insights and Forecast - by Target Insect
- 10.8.1. Mosquitoes
- 10.8.2. Flies
- 10.8.3. Other Target Insects
- 10.1. Market Analysis, Insights and Forecast - by Application
- 11. North America Insect Growth Regulator Industry Analysis, Insights and Forecast, 2019-2031
- 11.1. Market Analysis, Insights and Forecast - By Country/Sub-region
- 11.1.1 United States
- 11.1.2 Canada
- 11.1.3 Mexico
- 11.1.4 Rest of North America
- 12. Europe Insect Growth Regulator Industry Analysis, Insights and Forecast, 2019-2031
- 12.1. Market Analysis, Insights and Forecast - By Country/Sub-region
- 12.1.1 Germany
- 12.1.2 United Kingdom
- 12.1.3 France
- 12.1.4 Russia
- 12.1.5 Spain
- 12.1.6 Rest of Europe
- 13. Asia Pacific Insect Growth Regulator Industry Analysis, Insights and Forecast, 2019-2031
- 13.1. Market Analysis, Insights and Forecast - By Country/Sub-region
- 13.1.1 India
- 13.1.2 China
- 13.1.3 Japan
- 13.1.4 Rest of the Asia Pacific
- 14. South America Insect Growth Regulator Industry Analysis, Insights and Forecast, 2019-2031
- 14.1. Market Analysis, Insights and Forecast - By Country/Sub-region
- 14.1.1 Brazil
- 14.1.2 Argentina
- 14.1.3 Rest of South America
- 15. Africa Insect Growth Regulator Industry Analysis, Insights and Forecast, 2019-2031
- 15.1. Market Analysis, Insights and Forecast - By Country/Sub-region
- 15.1.1 South Africa
- 15.1.2 Rest of Africa
- 16. Competitive Analysis
- 16.1. Global Market Share Analysis 2024
- 16.2. Company Profiles
- 16.2.1 Russell IPM
- 16.2.1.1. Overview
- 16.2.1.2. Products
- 16.2.1.3. SWOT Analysis
- 16.2.1.4. Recent Developments
- 16.2.1.5. Financials (Based on Availability)
- 16.2.2 Eli Lily and Company
- 16.2.2.1. Overview
- 16.2.2.2. Products
- 16.2.2.3. SWOT Analysis
- 16.2.2.4. Recent Developments
- 16.2.2.5. Financials (Based on Availability)
- 16.2.3 Certis
- 16.2.3.1. Overview
- 16.2.3.2. Products
- 16.2.3.3. SWOT Analysis
- 16.2.3.4. Recent Developments
- 16.2.3.5. Financials (Based on Availability)
- 16.2.4 Sumitomo Chemical
- 16.2.4.1. Overview
- 16.2.4.2. Products
- 16.2.4.3. SWOT Analysis
- 16.2.4.4. Recent Developments
- 16.2.4.5. Financials (Based on Availability)
- 16.2.5 Syngent
- 16.2.5.1. Overview
- 16.2.5.2. Products
- 16.2.5.3. SWOT Analysis
- 16.2.5.4. Recent Developments
- 16.2.5.5. Financials (Based on Availability)
- 16.2.6 Adama
- 16.2.6.1. Overview
- 16.2.6.2. Products
- 16.2.6.3. SWOT Analysis
- 16.2.6.4. Recent Developments
- 16.2.6.5. Financials (Based on Availability)
- 16.2.7 Nufarm
- 16.2.7.1. Overview
- 16.2.7.2. Products
- 16.2.7.3. SWOT Analysis
- 16.2.7.4. Recent Developments
- 16.2.7.5. Financials (Based on Availability)
- 16.2.8 BASF
- 16.2.8.1. Overview
- 16.2.8.2. Products
- 16.2.8.3. SWOT Analysis
- 16.2.8.4. Recent Developments
- 16.2.8.5. Financials (Based on Availability)
- 16.2.9 Central Garden & Pet Co
- 16.2.9.1. Overview
- 16.2.9.2. Products
- 16.2.9.3. SWOT Analysis
- 16.2.9.4. Recent Developments
- 16.2.9.5. Financials (Based on Availability)
- 16.2.10 Summit Chemical
- 16.2.10.1. Overview
- 16.2.10.2. Products
- 16.2.10.3. SWOT Analysis
- 16.2.10.4. Recent Developments
- 16.2.10.5. Financials (Based on Availability)
- 16.2.1 Russell IPM
List of Figures
- Figure 1: Global Insect Growth Regulator Industry Revenue Breakdown (Million, %) by Region 2024 & 2032
- Figure 2: Global Insect Growth Regulator Industry Volume Breakdown (Kiloton, %) by Region 2024 & 2032
- Figure 3: North America Insect Growth Regulator Industry Revenue (Million), by Country 2024 & 2032
- Figure 4: North America Insect Growth Regulator Industry Volume (Kiloton), by Country 2024 & 2032
- Figure 5: North America Insect Growth Regulator Industry Revenue Share (%), by Country 2024 & 2032
- Figure 6: North America Insect Growth Regulator Industry Volume Share (%), by Country 2024 & 2032
- Figure 7: Europe Insect Growth Regulator Industry Revenue (Million), by Country 2024 & 2032
- Figure 8: Europe Insect Growth Regulator Industry Volume (Kiloton), by Country 2024 & 2032
- Figure 9: Europe Insect Growth Regulator Industry Revenue Share (%), by Country 2024 & 2032
- Figure 10: Europe Insect Growth Regulator Industry Volume Share (%), by Country 2024 & 2032
- Figure 11: Asia Pacific Insect Growth Regulator Industry Revenue (Million), by Country 2024 & 2032
- Figure 12: Asia Pacific Insect Growth Regulator Industry Volume (Kiloton), by Country 2024 & 2032
- Figure 13: Asia Pacific Insect Growth Regulator Industry Revenue Share (%), by Country 2024 & 2032
- Figure 14: Asia Pacific Insect Growth Regulator Industry Volume Share (%), by Country 2024 & 2032
- Figure 15: South America Insect Growth Regulator Industry Revenue (Million), by Country 2024 & 2032
- Figure 16: South America Insect Growth Regulator Industry Volume (Kiloton), by Country 2024 & 2032
- Figure 17: South America Insect Growth Regulator Industry Revenue Share (%), by Country 2024 & 2032
- Figure 18: South America Insect Growth Regulator Industry Volume Share (%), by Country 2024 & 2032
- Figure 19: Africa Insect Growth Regulator Industry Revenue (Million), by Country 2024 & 2032
- Figure 20: Africa Insect Growth Regulator Industry Volume (Kiloton), by Country 2024 & 2032
- Figure 21: Africa Insect Growth Regulator Industry Revenue Share (%), by Country 2024 & 2032
- Figure 22: Africa Insect Growth Regulator Industry Volume Share (%), by Country 2024 & 2032
- Figure 23: North America Insect Growth Regulator Industry Revenue (Million), by Application 2024 & 2032
- Figure 24: North America Insect Growth Regulator Industry Volume (Kiloton), by Application 2024 & 2032
- Figure 25: North America Insect Growth Regulator Industry Revenue Share (%), by Application 2024 & 2032
- Figure 26: North America Insect Growth Regulator Industry Volume Share (%), by Application 2024 & 2032
- Figure 27: North America Insect Growth Regulator Industry Revenue (Million), by Control Method 2024 & 2032
- Figure 28: North America Insect Growth Regulator Industry Volume (Kiloton), by Control Method 2024 & 2032
- Figure 29: North America Insect Growth Regulator Industry Revenue Share (%), by Control Method 2024 & 2032
- Figure 30: North America Insect Growth Regulator Industry Volume Share (%), by Control Method 2024 & 2032
- Figure 31: North America Insect Growth Regulator Industry Revenue (Million), by Product Type 2024 & 2032
- Figure 32: North America Insect Growth Regulator Industry Volume (Kiloton), by Product Type 2024 & 2032
- Figure 33: North America Insect Growth Regulator Industry Revenue Share (%), by Product Type 2024 & 2032
- Figure 34: North America Insect Growth Regulator Industry Volume Share (%), by Product Type 2024 & 2032
- Figure 35: North America Insect Growth Regulator Industry Revenue (Million), by Target Insect 2024 & 2032
- Figure 36: North America Insect Growth Regulator Industry Volume (Kiloton), by Target Insect 2024 & 2032
- Figure 37: North America Insect Growth Regulator Industry Revenue Share (%), by Target Insect 2024 & 2032
- Figure 38: North America Insect Growth Regulator Industry Volume Share (%), by Target Insect 2024 & 2032
- Figure 39: North America Insect Growth Regulator Industry Revenue (Million), by Application 2024 & 2032
- Figure 40: North America Insect Growth Regulator Industry Volume (Kiloton), by Application 2024 & 2032
- Figure 41: North America Insect Growth Regulator Industry Revenue Share (%), by Application 2024 & 2032
- Figure 42: North America Insect Growth Regulator Industry Volume Share (%), by Application 2024 & 2032
- Figure 43: North America Insect Growth Regulator Industry Revenue (Million), by Control Method 2024 & 2032
- Figure 44: North America Insect Growth Regulator Industry Volume (Kiloton), by Control Method 2024 & 2032
- Figure 45: North America Insect Growth Regulator Industry Revenue Share (%), by Control Method 2024 & 2032
- Figure 46: North America Insect Growth Regulator Industry Volume Share (%), by Control Method 2024 & 2032
- Figure 47: North America Insect Growth Regulator Industry Revenue (Million), by Product Type 2024 & 2032
- Figure 48: North America Insect Growth Regulator Industry Volume (Kiloton), by Product Type 2024 & 2032
- Figure 49: North America Insect Growth Regulator Industry Revenue Share (%), by Product Type 2024 & 2032
- Figure 50: North America Insect Growth Regulator Industry Volume Share (%), by Product Type 2024 & 2032
- Figure 51: North America Insect Growth Regulator Industry Revenue (Million), by Target Insect 2024 & 2032
- Figure 52: North America Insect Growth Regulator Industry Volume (Kiloton), by Target Insect 2024 & 2032
- Figure 53: North America Insect Growth Regulator Industry Revenue Share (%), by Target Insect 2024 & 2032
- Figure 54: North America Insect Growth Regulator Industry Volume Share (%), by Target Insect 2024 & 2032
- Figure 55: North America Insect Growth Regulator Industry Revenue (Million), by Country 2024 & 2032
- Figure 56: North America Insect Growth Regulator Industry Volume (Kiloton), by Country 2024 & 2032
- Figure 57: North America Insect Growth Regulator Industry Revenue Share (%), by Country 2024 & 2032
- Figure 58: North America Insect Growth Regulator Industry Volume Share (%), by Country 2024 & 2032
- Figure 59: Europe Insect Growth Regulator Industry Revenue (Million), by Application 2024 & 2032
- Figure 60: Europe Insect Growth Regulator Industry Volume (Kiloton), by Application 2024 & 2032
- Figure 61: Europe Insect Growth Regulator Industry Revenue Share (%), by Application 2024 & 2032
- Figure 62: Europe Insect Growth Regulator Industry Volume Share (%), by Application 2024 & 2032
- Figure 63: Europe Insect Growth Regulator Industry Revenue (Million), by Control Method 2024 & 2032
- Figure 64: Europe Insect Growth Regulator Industry Volume (Kiloton), by Control Method 2024 & 2032
- Figure 65: Europe Insect Growth Regulator Industry Revenue Share (%), by Control Method 2024 & 2032
- Figure 66: Europe Insect Growth Regulator Industry Volume Share (%), by Control Method 2024 & 2032
- Figure 67: Europe Insect Growth Regulator Industry Revenue (Million), by Product Type 2024 & 2032
- Figure 68: Europe Insect Growth Regulator Industry Volume (Kiloton), by Product Type 2024 & 2032
- Figure 69: Europe Insect Growth Regulator Industry Revenue Share (%), by Product Type 2024 & 2032
- Figure 70: Europe Insect Growth Regulator Industry Volume Share (%), by Product Type 2024 & 2032
- Figure 71: Europe Insect Growth Regulator Industry Revenue (Million), by Target Insect 2024 & 2032
- Figure 72: Europe Insect Growth Regulator Industry Volume (Kiloton), by Target Insect 2024 & 2032
- Figure 73: Europe Insect Growth Regulator Industry Revenue Share (%), by Target Insect 2024 & 2032
- Figure 74: Europe Insect Growth Regulator Industry Volume Share (%), by Target Insect 2024 & 2032
- Figure 75: Europe Insect Growth Regulator Industry Revenue (Million), by Application 2024 & 2032
- Figure 76: Europe Insect Growth Regulator Industry Volume (Kiloton), by Application 2024 & 2032
- Figure 77: Europe Insect Growth Regulator Industry Revenue Share (%), by Application 2024 & 2032
- Figure 78: Europe Insect Growth Regulator Industry Volume Share (%), by Application 2024 & 2032
- Figure 79: Europe Insect Growth Regulator Industry Revenue (Million), by Control Method 2024 & 2032
- Figure 80: Europe Insect Growth Regulator Industry Volume (Kiloton), by Control Method 2024 & 2032
- Figure 81: Europe Insect Growth Regulator Industry Revenue Share (%), by Control Method 2024 & 2032
- Figure 82: Europe Insect Growth Regulator Industry Volume Share (%), by Control Method 2024 & 2032
- Figure 83: Europe Insect Growth Regulator Industry Revenue (Million), by Product Type 2024 & 2032
- Figure 84: Europe Insect Growth Regulator Industry Volume (Kiloton), by Product Type 2024 & 2032
- Figure 85: Europe Insect Growth Regulator Industry Revenue Share (%), by Product Type 2024 & 2032
- Figure 86: Europe Insect Growth Regulator Industry Volume Share (%), by Product Type 2024 & 2032
- Figure 87: Europe Insect Growth Regulator Industry Revenue (Million), by Target Insect 2024 & 2032
- Figure 88: Europe Insect Growth Regulator Industry Volume (Kiloton), by Target Insect 2024 & 2032
- Figure 89: Europe Insect Growth Regulator Industry Revenue Share (%), by Target Insect 2024 & 2032
- Figure 90: Europe Insect Growth Regulator Industry Volume Share (%), by Target Insect 2024 & 2032
- Figure 91: Europe Insect Growth Regulator Industry Revenue (Million), by Country 2024 & 2032
- Figure 92: Europe Insect Growth Regulator Industry Volume (Kiloton), by Country 2024 & 2032
- Figure 93: Europe Insect Growth Regulator Industry Revenue Share (%), by Country 2024 & 2032
- Figure 94: Europe Insect Growth Regulator Industry Volume Share (%), by Country 2024 & 2032
- Figure 95: Asia Pacific Insect Growth Regulator Industry Revenue (Million), by Application 2024 & 2032
- Figure 96: Asia Pacific Insect Growth Regulator Industry Volume (Kiloton), by Application 2024 & 2032
- Figure 97: Asia Pacific Insect Growth Regulator Industry Revenue Share (%), by Application 2024 & 2032
- Figure 98: Asia Pacific Insect Growth Regulator Industry Volume Share (%), by Application 2024 & 2032
- Figure 99: Asia Pacific Insect Growth Regulator Industry Revenue (Million), by Control Method 2024 & 2032
- Figure 100: Asia Pacific Insect Growth Regulator Industry Volume (Kiloton), by Control Method 2024 & 2032
- Figure 101: Asia Pacific Insect Growth Regulator Industry Revenue Share (%), by Control Method 2024 & 2032
- Figure 102: Asia Pacific Insect Growth Regulator Industry Volume Share (%), by Control Method 2024 & 2032
- Figure 103: Asia Pacific Insect Growth Regulator Industry Revenue (Million), by Product Type 2024 & 2032
- Figure 104: Asia Pacific Insect Growth Regulator Industry Volume (Kiloton), by Product Type 2024 & 2032
- Figure 105: Asia Pacific Insect Growth Regulator Industry Revenue Share (%), by Product Type 2024 & 2032
- Figure 106: Asia Pacific Insect Growth Regulator Industry Volume Share (%), by Product Type 2024 & 2032
- Figure 107: Asia Pacific Insect Growth Regulator Industry Revenue (Million), by Target Insect 2024 & 2032
- Figure 108: Asia Pacific Insect Growth Regulator Industry Volume (Kiloton), by Target Insect 2024 & 2032
- Figure 109: Asia Pacific Insect Growth Regulator Industry Revenue Share (%), by Target Insect 2024 & 2032
- Figure 110: Asia Pacific Insect Growth Regulator Industry Volume Share (%), by Target Insect 2024 & 2032
- Figure 111: Asia Pacific Insect Growth Regulator Industry Revenue (Million), by Application 2024 & 2032
- Figure 112: Asia Pacific Insect Growth Regulator Industry Volume (Kiloton), by Application 2024 & 2032
- Figure 113: Asia Pacific Insect Growth Regulator Industry Revenue Share (%), by Application 2024 & 2032
- Figure 114: Asia Pacific Insect Growth Regulator Industry Volume Share (%), by Application 2024 & 2032
- Figure 115: Asia Pacific Insect Growth Regulator Industry Revenue (Million), by Control Method 2024 & 2032
- Figure 116: Asia Pacific Insect Growth Regulator Industry Volume (Kiloton), by Control Method 2024 & 2032
- Figure 117: Asia Pacific Insect Growth Regulator Industry Revenue Share (%), by Control Method 2024 & 2032
- Figure 118: Asia Pacific Insect Growth Regulator Industry Volume Share (%), by Control Method 2024 & 2032
- Figure 119: Asia Pacific Insect Growth Regulator Industry Revenue (Million), by Product Type 2024 & 2032
- Figure 120: Asia Pacific Insect Growth Regulator Industry Volume (Kiloton), by Product Type 2024 & 2032
- Figure 121: Asia Pacific Insect Growth Regulator Industry Revenue Share (%), by Product Type 2024 & 2032
- Figure 122: Asia Pacific Insect Growth Regulator Industry Volume Share (%), by Product Type 2024 & 2032
- Figure 123: Asia Pacific Insect Growth Regulator Industry Revenue (Million), by Target Insect 2024 & 2032
- Figure 124: Asia Pacific Insect Growth Regulator Industry Volume (Kiloton), by Target Insect 2024 & 2032
- Figure 125: Asia Pacific Insect Growth Regulator Industry Revenue Share (%), by Target Insect 2024 & 2032
- Figure 126: Asia Pacific Insect Growth Regulator Industry Volume Share (%), by Target Insect 2024 & 2032
- Figure 127: Asia Pacific Insect Growth Regulator Industry Revenue (Million), by Country 2024 & 2032
- Figure 128: Asia Pacific Insect Growth Regulator Industry Volume (Kiloton), by Country 2024 & 2032
- Figure 129: Asia Pacific Insect Growth Regulator Industry Revenue Share (%), by Country 2024 & 2032
- Figure 130: Asia Pacific Insect Growth Regulator Industry Volume Share (%), by Country 2024 & 2032
- Figure 131: South America Insect Growth Regulator Industry Revenue (Million), by Application 2024 & 2032
- Figure 132: South America Insect Growth Regulator Industry Volume (Kiloton), by Application 2024 & 2032
- Figure 133: South America Insect Growth Regulator Industry Revenue Share (%), by Application 2024 & 2032
- Figure 134: South America Insect Growth Regulator Industry Volume Share (%), by Application 2024 & 2032
- Figure 135: South America Insect Growth Regulator Industry Revenue (Million), by Control Method 2024 & 2032
- Figure 136: South America Insect Growth Regulator Industry Volume (Kiloton), by Control Method 2024 & 2032
- Figure 137: South America Insect Growth Regulator Industry Revenue Share (%), by Control Method 2024 & 2032
- Figure 138: South America Insect Growth Regulator Industry Volume Share (%), by Control Method 2024 & 2032
- Figure 139: South America Insect Growth Regulator Industry Revenue (Million), by Product Type 2024 & 2032
- Figure 140: South America Insect Growth Regulator Industry Volume (Kiloton), by Product Type 2024 & 2032
- Figure 141: South America Insect Growth Regulator Industry Revenue Share (%), by Product Type 2024 & 2032
- Figure 142: South America Insect Growth Regulator Industry Volume Share (%), by Product Type 2024 & 2032
- Figure 143: South America Insect Growth Regulator Industry Revenue (Million), by Target Insect 2024 & 2032
- Figure 144: South America Insect Growth Regulator Industry Volume (Kiloton), by Target Insect 2024 & 2032
- Figure 145: South America Insect Growth Regulator Industry Revenue Share (%), by Target Insect 2024 & 2032
- Figure 146: South America Insect Growth Regulator Industry Volume Share (%), by Target Insect 2024 & 2032
- Figure 147: South America Insect Growth Regulator Industry Revenue (Million), by Application 2024 & 2032
- Figure 148: South America Insect Growth Regulator Industry Volume (Kiloton), by Application 2024 & 2032
- Figure 149: South America Insect Growth Regulator Industry Revenue Share (%), by Application 2024 & 2032
- Figure 150: South America Insect Growth Regulator Industry Volume Share (%), by Application 2024 & 2032
- Figure 151: South America Insect Growth Regulator Industry Revenue (Million), by Control Method 2024 & 2032
- Figure 152: South America Insect Growth Regulator Industry Volume (Kiloton), by Control Method 2024 & 2032
- Figure 153: South America Insect Growth Regulator Industry Revenue Share (%), by Control Method 2024 & 2032
- Figure 154: South America Insect Growth Regulator Industry Volume Share (%), by Control Method 2024 & 2032
- Figure 155: South America Insect Growth Regulator Industry Revenue (Million), by Product Type 2024 & 2032
- Figure 156: South America Insect Growth Regulator Industry Volume (Kiloton), by Product Type 2024 & 2032
- Figure 157: South America Insect Growth Regulator Industry Revenue Share (%), by Product Type 2024 & 2032
- Figure 158: South America Insect Growth Regulator Industry Volume Share (%), by Product Type 2024 & 2032
- Figure 159: South America Insect Growth Regulator Industry Revenue (Million), by Target Insect 2024 & 2032
- Figure 160: South America Insect Growth Regulator Industry Volume (Kiloton), by Target Insect 2024 & 2032
- Figure 161: South America Insect Growth Regulator Industry Revenue Share (%), by Target Insect 2024 & 2032
- Figure 162: South America Insect Growth Regulator Industry Volume Share (%), by Target Insect 2024 & 2032
- Figure 163: South America Insect Growth Regulator Industry Revenue (Million), by Country 2024 & 2032
- Figure 164: South America Insect Growth Regulator Industry Volume (Kiloton), by Country 2024 & 2032
- Figure 165: South America Insect Growth Regulator Industry Revenue Share (%), by Country 2024 & 2032
- Figure 166: South America Insect Growth Regulator Industry Volume Share (%), by Country 2024 & 2032
- Figure 167: Africa Insect Growth Regulator Industry Revenue (Million), by Application 2024 & 2032
- Figure 168: Africa Insect Growth Regulator Industry Volume (Kiloton), by Application 2024 & 2032
- Figure 169: Africa Insect Growth Regulator Industry Revenue Share (%), by Application 2024 & 2032
- Figure 170: Africa Insect Growth Regulator Industry Volume Share (%), by Application 2024 & 2032
- Figure 171: Africa Insect Growth Regulator Industry Revenue (Million), by Control Method 2024 & 2032
- Figure 172: Africa Insect Growth Regulator Industry Volume (Kiloton), by Control Method 2024 & 2032
- Figure 173: Africa Insect Growth Regulator Industry Revenue Share (%), by Control Method 2024 & 2032
- Figure 174: Africa Insect Growth Regulator Industry Volume Share (%), by Control Method 2024 & 2032
- Figure 175: Africa Insect Growth Regulator Industry Revenue (Million), by Product Type 2024 & 2032
- Figure 176: Africa Insect Growth Regulator Industry Volume (Kiloton), by Product Type 2024 & 2032
- Figure 177: Africa Insect Growth Regulator Industry Revenue Share (%), by Product Type 2024 & 2032
- Figure 178: Africa Insect Growth Regulator Industry Volume Share (%), by Product Type 2024 & 2032
- Figure 179: Africa Insect Growth Regulator Industry Revenue (Million), by Target Insect 2024 & 2032
- Figure 180: Africa Insect Growth Regulator Industry Volume (Kiloton), by Target Insect 2024 & 2032
- Figure 181: Africa Insect Growth Regulator Industry Revenue Share (%), by Target Insect 2024 & 2032
- Figure 182: Africa Insect Growth Regulator Industry Volume Share (%), by Target Insect 2024 & 2032
- Figure 183: Africa Insect Growth Regulator Industry Revenue (Million), by Application 2024 & 2032
- Figure 184: Africa Insect Growth Regulator Industry Volume (Kiloton), by Application 2024 & 2032
- Figure 185: Africa Insect Growth Regulator Industry Revenue Share (%), by Application 2024 & 2032
- Figure 186: Africa Insect Growth Regulator Industry Volume Share (%), by Application 2024 & 2032
- Figure 187: Africa Insect Growth Regulator Industry Revenue (Million), by Control Method 2024 & 2032
- Figure 188: Africa Insect Growth Regulator Industry Volume (Kiloton), by Control Method 2024 & 2032
- Figure 189: Africa Insect Growth Regulator Industry Revenue Share (%), by Control Method 2024 & 2032
- Figure 190: Africa Insect Growth Regulator Industry Volume Share (%), by Control Method 2024 & 2032
- Figure 191: Africa Insect Growth Regulator Industry Revenue (Million), by Product Type 2024 & 2032
- Figure 192: Africa Insect Growth Regulator Industry Volume (Kiloton), by Product Type 2024 & 2032
- Figure 193: Africa Insect Growth Regulator Industry Revenue Share (%), by Product Type 2024 & 2032
- Figure 194: Africa Insect Growth Regulator Industry Volume Share (%), by Product Type 2024 & 2032
- Figure 195: Africa Insect Growth Regulator Industry Revenue (Million), by Target Insect 2024 & 2032
- Figure 196: Africa Insect Growth Regulator Industry Volume (Kiloton), by Target Insect 2024 & 2032
- Figure 197: Africa Insect Growth Regulator Industry Revenue Share (%), by Target Insect 2024 & 2032
- Figure 198: Africa Insect Growth Regulator Industry Volume Share (%), by Target Insect 2024 & 2032
- Figure 199: Africa Insect Growth Regulator Industry Revenue (Million), by Country 2024 & 2032
- Figure 200: Africa Insect Growth Regulator Industry Volume (Kiloton), by Country 2024 & 2032
- Figure 201: Africa Insect Growth Regulator Industry Revenue Share (%), by Country 2024 & 2032
- Figure 202: Africa Insect Growth Regulator Industry Volume Share (%), by Country 2024 & 2032
List of Tables
- Table 1: Global Insect Growth Regulator Industry Revenue Million Forecast, by Region 2019 & 2032
- Table 2: Global Insect Growth Regulator Industry Volume Kiloton Forecast, by Region 2019 & 2032
- Table 3: Global Insect Growth Regulator Industry Revenue Million Forecast, by Application 2019 & 2032
- Table 4: Global Insect Growth Regulator Industry Volume Kiloton Forecast, by Application 2019 & 2032
- Table 5: Global Insect Growth Regulator Industry Revenue Million Forecast, by Control Method 2019 & 2032
- Table 6: Global Insect Growth Regulator Industry Volume Kiloton Forecast, by Control Method 2019 & 2032
- Table 7: Global Insect Growth Regulator Industry Revenue Million Forecast, by Product Type 2019 & 2032
- Table 8: Global Insect Growth Regulator Industry Volume Kiloton Forecast, by Product Type 2019 & 2032
- Table 9: Global Insect Growth Regulator Industry Revenue Million Forecast, by Target Insect 2019 & 2032
- Table 10: Global Insect Growth Regulator Industry Volume Kiloton Forecast, by Target Insect 2019 & 2032
- Table 11: Global Insect Growth Regulator Industry Revenue Million Forecast, by Application 2019 & 2032
- Table 12: Global Insect Growth Regulator Industry Volume Kiloton Forecast, by Application 2019 & 2032
- Table 13: Global Insect Growth Regulator Industry Revenue Million Forecast, by Control Method 2019 & 2032
- Table 14: Global Insect Growth Regulator Industry Volume Kiloton Forecast, by Control Method 2019 & 2032
- Table 15: Global Insect Growth Regulator Industry Revenue Million Forecast, by Product Type 2019 & 2032
- Table 16: Global Insect Growth Regulator Industry Volume Kiloton Forecast, by Product Type 2019 & 2032
- Table 17: Global Insect Growth Regulator Industry Revenue Million Forecast, by Target Insect 2019 & 2032
- Table 18: Global Insect Growth Regulator Industry Volume Kiloton Forecast, by Target Insect 2019 & 2032
- Table 19: Global Insect Growth Regulator Industry Revenue Million Forecast, by Region 2019 & 2032
- Table 20: Global Insect Growth Regulator Industry Volume Kiloton Forecast, by Region 2019 & 2032
- Table 21: Global Insect Growth Regulator Industry Revenue Million Forecast, by Country 2019 & 2032
- Table 22: Global Insect Growth Regulator Industry Volume Kiloton Forecast, by Country 2019 & 2032
- Table 23: United States Insect Growth Regulator Industry Revenue (Million) Forecast, by Application 2019 & 2032
- Table 24: United States Insect Growth Regulator Industry Volume (Kiloton) Forecast, by Application 2019 & 2032
- Table 25: Canada Insect Growth Regulator Industry Revenue (Million) Forecast, by Application 2019 & 2032
- Table 26: Canada Insect Growth Regulator Industry Volume (Kiloton) Forecast, by Application 2019 & 2032
- Table 27: Mexico Insect Growth Regulator Industry Revenue (Million) Forecast, by Application 2019 & 2032
- Table 28: Mexico Insect Growth Regulator Industry Volume (Kiloton) Forecast, by Application 2019 & 2032
- Table 29: Rest of North America Insect Growth Regulator Industry Revenue (Million) Forecast, by Application 2019 & 2032
- Table 30: Rest of North America Insect Growth Regulator Industry Volume (Kiloton) Forecast, by Application 2019 & 2032
- Table 31: Global Insect Growth Regulator Industry Revenue Million Forecast, by Country 2019 & 2032
- Table 32: Global Insect Growth Regulator Industry Volume Kiloton Forecast, by Country 2019 & 2032
- Table 33: Germany Insect Growth Regulator Industry Revenue (Million) Forecast, by Application 2019 & 2032
- Table 34: Germany Insect Growth Regulator Industry Volume (Kiloton) Forecast, by Application 2019 & 2032
- Table 35: United Kingdom Insect Growth Regulator Industry Revenue (Million) Forecast, by Application 2019 & 2032
- Table 36: United Kingdom Insect Growth Regulator Industry Volume (Kiloton) Forecast, by Application 2019 & 2032
- Table 37: France Insect Growth Regulator Industry Revenue (Million) Forecast, by Application 2019 & 2032
- Table 38: France Insect Growth Regulator Industry Volume (Kiloton) Forecast, by Application 2019 & 2032
- Table 39: Russia Insect Growth Regulator Industry Revenue (Million) Forecast, by Application 2019 & 2032
- Table 40: Russia Insect Growth Regulator Industry Volume (Kiloton) Forecast, by Application 2019 & 2032
- Table 41: Spain Insect Growth Regulator Industry Revenue (Million) Forecast, by Application 2019 & 2032
- Table 42: Spain Insect Growth Regulator Industry Volume (Kiloton) Forecast, by Application 2019 & 2032
- Table 43: Rest of Europe Insect Growth Regulator Industry Revenue (Million) Forecast, by Application 2019 & 2032
- Table 44: Rest of Europe Insect Growth Regulator Industry Volume (Kiloton) Forecast, by Application 2019 & 2032
- Table 45: Global Insect Growth Regulator Industry Revenue Million Forecast, by Country 2019 & 2032
- Table 46: Global Insect Growth Regulator Industry Volume Kiloton Forecast, by Country 2019 & 2032
- Table 47: India Insect Growth Regulator Industry Revenue (Million) Forecast, by Application 2019 & 2032
- Table 48: India Insect Growth Regulator Industry Volume (Kiloton) Forecast, by Application 2019 & 2032
- Table 49: China Insect Growth Regulator Industry Revenue (Million) Forecast, by Application 2019 & 2032
- Table 50: China Insect Growth Regulator Industry Volume (Kiloton) Forecast, by Application 2019 & 2032
- Table 51: Japan Insect Growth Regulator Industry Revenue (Million) Forecast, by Application 2019 & 2032
- Table 52: Japan Insect Growth Regulator Industry Volume (Kiloton) Forecast, by Application 2019 & 2032
- Table 53: Rest of the Asia Pacific Insect Growth Regulator Industry Revenue (Million) Forecast, by Application 2019 & 2032
- Table 54: Rest of the Asia Pacific Insect Growth Regulator Industry Volume (Kiloton) Forecast, by Application 2019 & 2032
- Table 55: Global Insect Growth Regulator Industry Revenue Million Forecast, by Country 2019 & 2032
- Table 56: Global Insect Growth Regulator Industry Volume Kiloton Forecast, by Country 2019 & 2032
- Table 57: Brazil Insect Growth Regulator Industry Revenue (Million) Forecast, by Application 2019 & 2032
- Table 58: Brazil Insect Growth Regulator Industry Volume (Kiloton) Forecast, by Application 2019 & 2032
- Table 59: Argentina Insect Growth Regulator Industry Revenue (Million) Forecast, by Application 2019 & 2032
- Table 60: Argentina Insect Growth Regulator Industry Volume (Kiloton) Forecast, by Application 2019 & 2032
- Table 61: Rest of South America Insect Growth Regulator Industry Revenue (Million) Forecast, by Application 2019 & 2032
- Table 62: Rest of South America Insect Growth Regulator Industry Volume (Kiloton) Forecast, by Application 2019 & 2032
- Table 63: Global Insect Growth Regulator Industry Revenue Million Forecast, by Country 2019 & 2032
- Table 64: Global Insect Growth Regulator Industry Volume Kiloton Forecast, by Country 2019 & 2032
- Table 65: South Africa Insect Growth Regulator Industry Revenue (Million) Forecast, by Application 2019 & 2032
- Table 66: South Africa Insect Growth Regulator Industry Volume (Kiloton) Forecast, by Application 2019 & 2032
- Table 67: Rest of Africa Insect Growth Regulator Industry Revenue (Million) Forecast, by Application 2019 & 2032
- Table 68: Rest of Africa Insect Growth Regulator Industry Volume (Kiloton) Forecast, by Application 2019 & 2032
- Table 69: Global Insect Growth Regulator Industry Revenue Million Forecast, by Application 2019 & 2032
- Table 70: Global Insect Growth Regulator Industry Volume Kiloton Forecast, by Application 2019 & 2032
- Table 71: Global Insect Growth Regulator Industry Revenue Million Forecast, by Control Method 2019 & 2032
- Table 72: Global Insect Growth Regulator Industry Volume Kiloton Forecast, by Control Method 2019 & 2032
- Table 73: Global Insect Growth Regulator Industry Revenue Million Forecast, by Product Type 2019 & 2032
- Table 74: Global Insect Growth Regulator Industry Volume Kiloton Forecast, by Product Type 2019 & 2032
- Table 75: Global Insect Growth Regulator Industry Revenue Million Forecast, by Target Insect 2019 & 2032
- Table 76: Global Insect Growth Regulator Industry Volume Kiloton Forecast, by Target Insect 2019 & 2032
- Table 77: Global Insect Growth Regulator Industry Revenue Million Forecast, by Application 2019 & 2032
- Table 78: Global Insect Growth Regulator Industry Volume Kiloton Forecast, by Application 2019 & 2032
- Table 79: Global Insect Growth Regulator Industry Revenue Million Forecast, by Control Method 2019 & 2032
- Table 80: Global Insect Growth Regulator Industry Volume Kiloton Forecast, by Control Method 2019 & 2032
- Table 81: Global Insect Growth Regulator Industry Revenue Million Forecast, by Product Type 2019 & 2032
- Table 82: Global Insect Growth Regulator Industry Volume Kiloton Forecast, by Product Type 2019 & 2032
- Table 83: Global Insect Growth Regulator Industry Revenue Million Forecast, by Target Insect 2019 & 2032
- Table 84: Global Insect Growth Regulator Industry Volume Kiloton Forecast, by Target Insect 2019 & 2032
- Table 85: Global Insect Growth Regulator Industry Revenue Million Forecast, by Country 2019 & 2032
- Table 86: Global Insect Growth Regulator Industry Volume Kiloton Forecast, by Country 2019 & 2032
- Table 87: United States Insect Growth Regulator Industry Revenue (Million) Forecast, by Application 2019 & 2032
- Table 88: United States Insect Growth Regulator Industry Volume (Kiloton) Forecast, by Application 2019 & 2032
- Table 89: Canada Insect Growth Regulator Industry Revenue (Million) Forecast, by Application 2019 & 2032
- Table 90: Canada Insect Growth Regulator Industry Volume (Kiloton) Forecast, by Application 2019 & 2032
- Table 91: Mexico Insect Growth Regulator Industry Revenue (Million) Forecast, by Application 2019 & 2032
- Table 92: Mexico Insect Growth Regulator Industry Volume (Kiloton) Forecast, by Application 2019 & 2032
- Table 93: Rest of North America Insect Growth Regulator Industry Revenue (Million) Forecast, by Application 2019 & 2032
- Table 94: Rest of North America Insect Growth Regulator Industry Volume (Kiloton) Forecast, by Application 2019 & 2032
- Table 95: Global Insect Growth Regulator Industry Revenue Million Forecast, by Application 2019 & 2032
- Table 96: Global Insect Growth Regulator Industry Volume Kiloton Forecast, by Application 2019 & 2032
- Table 97: Global Insect Growth Regulator Industry Revenue Million Forecast, by Control Method 2019 & 2032
- Table 98: Global Insect Growth Regulator Industry Volume Kiloton Forecast, by Control Method 2019 & 2032
- Table 99: Global Insect Growth Regulator Industry Revenue Million Forecast, by Product Type 2019 & 2032
- Table 100: Global Insect Growth Regulator Industry Volume Kiloton Forecast, by Product Type 2019 & 2032
- Table 101: Global Insect Growth Regulator Industry Revenue Million Forecast, by Target Insect 2019 & 2032
- Table 102: Global Insect Growth Regulator Industry Volume Kiloton Forecast, by Target Insect 2019 & 2032
- Table 103: Global Insect Growth Regulator Industry Revenue Million Forecast, by Application 2019 & 2032
- Table 104: Global Insect Growth Regulator Industry Volume Kiloton Forecast, by Application 2019 & 2032
- Table 105: Global Insect Growth Regulator Industry Revenue Million Forecast, by Control Method 2019 & 2032
- Table 106: Global Insect Growth Regulator Industry Volume Kiloton Forecast, by Control Method 2019 & 2032
- Table 107: Global Insect Growth Regulator Industry Revenue Million Forecast, by Product Type 2019 & 2032
- Table 108: Global Insect Growth Regulator Industry Volume Kiloton Forecast, by Product Type 2019 & 2032
- Table 109: Global Insect Growth Regulator Industry Revenue Million Forecast, by Target Insect 2019 & 2032
- Table 110: Global Insect Growth Regulator Industry Volume Kiloton Forecast, by Target Insect 2019 & 2032
- Table 111: Global Insect Growth Regulator Industry Revenue Million Forecast, by Country 2019 & 2032
- Table 112: Global Insect Growth Regulator Industry Volume Kiloton Forecast, by Country 2019 & 2032
- Table 113: Germany Insect Growth Regulator Industry Revenue (Million) Forecast, by Application 2019 & 2032
- Table 114: Germany Insect Growth Regulator Industry Volume (Kiloton) Forecast, by Application 2019 & 2032
- Table 115: United Kingdom Insect Growth Regulator Industry Revenue (Million) Forecast, by Application 2019 & 2032
- Table 116: United Kingdom Insect Growth Regulator Industry Volume (Kiloton) Forecast, by Application 2019 & 2032
- Table 117: France Insect Growth Regulator Industry Revenue (Million) Forecast, by Application 2019 & 2032
- Table 118: France Insect Growth Regulator Industry Volume (Kiloton) Forecast, by Application 2019 & 2032
- Table 119: Russia Insect Growth Regulator Industry Revenue (Million) Forecast, by Application 2019 & 2032
- Table 120: Russia Insect Growth Regulator Industry Volume (Kiloton) Forecast, by Application 2019 & 2032
- Table 121: Spain Insect Growth Regulator Industry Revenue (Million) Forecast, by Application 2019 & 2032
- Table 122: Spain Insect Growth Regulator Industry Volume (Kiloton) Forecast, by Application 2019 & 2032
- Table 123: Rest of Europe Insect Growth Regulator Industry Revenue (Million) Forecast, by Application 2019 & 2032
- Table 124: Rest of Europe Insect Growth Regulator Industry Volume (Kiloton) Forecast, by Application 2019 & 2032
- Table 125: Global Insect Growth Regulator Industry Revenue Million Forecast, by Application 2019 & 2032
- Table 126: Global Insect Growth Regulator Industry Volume Kiloton Forecast, by Application 2019 & 2032
- Table 127: Global Insect Growth Regulator Industry Revenue Million Forecast, by Control Method 2019 & 2032
- Table 128: Global Insect Growth Regulator Industry Volume Kiloton Forecast, by Control Method 2019 & 2032
- Table 129: Global Insect Growth Regulator Industry Revenue Million Forecast, by Product Type 2019 & 2032
- Table 130: Global Insect Growth Regulator Industry Volume Kiloton Forecast, by Product Type 2019 & 2032
- Table 131: Global Insect Growth Regulator Industry Revenue Million Forecast, by Target Insect 2019 & 2032
- Table 132: Global Insect Growth Regulator Industry Volume Kiloton Forecast, by Target Insect 2019 & 2032
- Table 133: Global Insect Growth Regulator Industry Revenue Million Forecast, by Application 2019 & 2032
- Table 134: Global Insect Growth Regulator Industry Volume Kiloton Forecast, by Application 2019 & 2032
- Table 135: Global Insect Growth Regulator Industry Revenue Million Forecast, by Control Method 2019 & 2032
- Table 136: Global Insect Growth Regulator Industry Volume Kiloton Forecast, by Control Method 2019 & 2032
- Table 137: Global Insect Growth Regulator Industry Revenue Million Forecast, by Product Type 2019 & 2032
- Table 138: Global Insect Growth Regulator Industry Volume Kiloton Forecast, by Product Type 2019 & 2032
- Table 139: Global Insect Growth Regulator Industry Revenue Million Forecast, by Target Insect 2019 & 2032
- Table 140: Global Insect Growth Regulator Industry Volume Kiloton Forecast, by Target Insect 2019 & 2032
- Table 141: Global Insect Growth Regulator Industry Revenue Million Forecast, by Country 2019 & 2032
- Table 142: Global Insect Growth Regulator Industry Volume Kiloton Forecast, by Country 2019 & 2032
- Table 143: India Insect Growth Regulator Industry Revenue (Million) Forecast, by Application 2019 & 2032
- Table 144: India Insect Growth Regulator Industry Volume (Kiloton) Forecast, by Application 2019 & 2032
- Table 145: China Insect Growth Regulator Industry Revenue (Million) Forecast, by Application 2019 & 2032
- Table 146: China Insect Growth Regulator Industry Volume (Kiloton) Forecast, by Application 2019 & 2032
- Table 147: Japan Insect Growth Regulator Industry Revenue (Million) Forecast, by Application 2019 & 2032
- Table 148: Japan Insect Growth Regulator Industry Volume (Kiloton) Forecast, by Application 2019 & 2032
- Table 149: Rest of the Asia Pacific Insect Growth Regulator Industry Revenue (Million) Forecast, by Application 2019 & 2032
- Table 150: Rest of the Asia Pacific Insect Growth Regulator Industry Volume (Kiloton) Forecast, by Application 2019 & 2032
- Table 151: Global Insect Growth Regulator Industry Revenue Million Forecast, by Application 2019 & 2032
- Table 152: Global Insect Growth Regulator Industry Volume Kiloton Forecast, by Application 2019 & 2032
- Table 153: Global Insect Growth Regulator Industry Revenue Million Forecast, by Control Method 2019 & 2032
- Table 154: Global Insect Growth Regulator Industry Volume Kiloton Forecast, by Control Method 2019 & 2032
- Table 155: Global Insect Growth Regulator Industry Revenue Million Forecast, by Product Type 2019 & 2032
- Table 156: Global Insect Growth Regulator Industry Volume Kiloton Forecast, by Product Type 2019 & 2032
- Table 157: Global Insect Growth Regulator Industry Revenue Million Forecast, by Target Insect 2019 & 2032
- Table 158: Global Insect Growth Regulator Industry Volume Kiloton Forecast, by Target Insect 2019 & 2032
- Table 159: Global Insect Growth Regulator Industry Revenue Million Forecast, by Application 2019 & 2032
- Table 160: Global Insect Growth Regulator Industry Volume Kiloton Forecast, by Application 2019 & 2032
- Table 161: Global Insect Growth Regulator Industry Revenue Million Forecast, by Control Method 2019 & 2032
- Table 162: Global Insect Growth Regulator Industry Volume Kiloton Forecast, by Control Method 2019 & 2032
- Table 163: Global Insect Growth Regulator Industry Revenue Million Forecast, by Product Type 2019 & 2032
- Table 164: Global Insect Growth Regulator Industry Volume Kiloton Forecast, by Product Type 2019 & 2032
- Table 165: Global Insect Growth Regulator Industry Revenue Million Forecast, by Target Insect 2019 & 2032
- Table 166: Global Insect Growth Regulator Industry Volume Kiloton Forecast, by Target Insect 2019 & 2032
- Table 167: Global Insect Growth Regulator Industry Revenue Million Forecast, by Country 2019 & 2032
- Table 168: Global Insect Growth Regulator Industry Volume Kiloton Forecast, by Country 2019 & 2032
- Table 169: Brazil Insect Growth Regulator Industry Revenue (Million) Forecast, by Application 2019 & 2032
- Table 170: Brazil Insect Growth Regulator Industry Volume (Kiloton) Forecast, by Application 2019 & 2032
- Table 171: Argentina Insect Growth Regulator Industry Revenue (Million) Forecast, by Application 2019 & 2032
- Table 172: Argentina Insect Growth Regulator Industry Volume (Kiloton) Forecast, by Application 2019 & 2032
- Table 173: Rest of South America Insect Growth Regulator Industry Revenue (Million) Forecast, by Application 2019 & 2032
- Table 174: Rest of South America Insect Growth Regulator Industry Volume (Kiloton) Forecast, by Application 2019 & 2032
- Table 175: Global Insect Growth Regulator Industry Revenue Million Forecast, by Application 2019 & 2032
- Table 176: Global Insect Growth Regulator Industry Volume Kiloton Forecast, by Application 2019 & 2032
- Table 177: Global Insect Growth Regulator Industry Revenue Million Forecast, by Control Method 2019 & 2032
- Table 178: Global Insect Growth Regulator Industry Volume Kiloton Forecast, by Control Method 2019 & 2032
- Table 179: Global Insect Growth Regulator Industry Revenue Million Forecast, by Product Type 2019 & 2032
- Table 180: Global Insect Growth Regulator Industry Volume Kiloton Forecast, by Product Type 2019 & 2032
- Table 181: Global Insect Growth Regulator Industry Revenue Million Forecast, by Target Insect 2019 & 2032
- Table 182: Global Insect Growth Regulator Industry Volume Kiloton Forecast, by Target Insect 2019 & 2032
- Table 183: Global Insect Growth Regulator Industry Revenue Million Forecast, by Application 2019 & 2032
- Table 184: Global Insect Growth Regulator Industry Volume Kiloton Forecast, by Application 2019 & 2032
- Table 185: Global Insect Growth Regulator Industry Revenue Million Forecast, by Control Method 2019 & 2032
- Table 186: Global Insect Growth Regulator Industry Volume Kiloton Forecast, by Control Method 2019 & 2032
- Table 187: Global Insect Growth Regulator Industry Revenue Million Forecast, by Product Type 2019 & 2032
- Table 188: Global Insect Growth Regulator Industry Volume Kiloton Forecast, by Product Type 2019 & 2032
- Table 189: Global Insect Growth Regulator Industry Revenue Million Forecast, by Target Insect 2019 & 2032
- Table 190: Global Insect Growth Regulator Industry Volume Kiloton Forecast, by Target Insect 2019 & 2032
- Table 191: Global Insect Growth Regulator Industry Revenue Million Forecast, by Country 2019 & 2032
- Table 192: Global Insect Growth Regulator Industry Volume Kiloton Forecast, by Country 2019 & 2032
- Table 193: South Africa Insect Growth Regulator Industry Revenue (Million) Forecast, by Application 2019 & 2032
- Table 194: South Africa Insect Growth Regulator Industry Volume (Kiloton) Forecast, by Application 2019 & 2032
- Table 195: Rest of Africa Insect Growth Regulator Industry Revenue (Million) Forecast, by Application 2019 & 2032
- Table 196: Rest of Africa Insect Growth Regulator Industry Volume (Kiloton) Forecast, by Application 2019 & 2032
Frequently Asked Questions
1. What is the projected Compound Annual Growth Rate (CAGR) of the Insect Growth Regulator Industry?
The projected CAGR is approximately 5.70%.
2. Which companies are prominent players in the Insect Growth Regulator Industry?
Key companies in the market include Russell IPM, Eli Lily and Company, Certis, Sumitomo Chemical, Syngent, Adama, Nufarm, BASF, Central Garden & Pet Co, Summit Chemical.
3. What are the main segments of the Insect Growth Regulator Industry?
The market segments include Application, Control Method, Product Type, Target Insect, Application, Control Method, Product Type, Target Insect.
4. Can you provide details about the market size?
The market size is estimated to be USD 0.95 Million as of 2022.
5. What are some drivers contributing to market growth?
Seed Treatment As A Solution To Enhance Yield; Growing Awareness For Seed Treatment Among The Farmers; Rising Trend Of Organic Farming.
6. What are the notable trends driving market growth?
Mosquito-borne Diseases Drive the Larvicides Market.
7. Are there any restraints impacting market growth?
Limitations Across Farm-Level Seed Treatment; Rising Environmental Concerns.
8. Can you provide examples of recent developments in the market?
N/A
9. What pricing options are available for accessing the report?
Pricing options include single-user, multi-user, and enterprise licenses priced at USD 4750, USD 5250, and USD 8750 respectively.
10. Is the market size provided in terms of value or volume?
The market size is provided in terms of value, measured in Million and volume, measured in Kiloton.
11. Are there any specific market keywords associated with the report?
Yes, the market keyword associated with the report is "Insect Growth Regulator Industry," which aids in identifying and referencing the specific market segment covered.
12. How do I determine which pricing option suits my needs best?
The pricing options vary based on user requirements and access needs. Individual users may opt for single-user licenses, while businesses requiring broader access may choose multi-user or enterprise licenses for cost-effective access to the report.
13. Are there any additional resources or data provided in the Insect Growth Regulator Industry report?
While the report offers comprehensive insights, it's advisable to review the specific contents or supplementary materials provided to ascertain if additional resources or data are available.
14. How can I stay updated on further developments or reports in the Insect Growth Regulator Industry?
To stay informed about further developments, trends, and reports in the Insect Growth Regulator Industry, consider subscribing to industry newsletters, following relevant companies and organizations, or regularly checking reputable industry news sources and publications.
Methodology
Step 1 - Identification of Relevant Samples Size from Population Database


Step 2 - Approaches for Defining Global Market Size (Value, Volume* & Price*)

Note*: In applicable scenarios
Step 3 - Data Sources
Primary Research
- Web Analytics
- Survey Reports
- Research Institute
- Latest Research Reports
- Opinion Leaders
Secondary Research
- Annual Reports
- White Paper
- Latest Press Release
- Industry Association
- Paid Database
- Investor Presentations

Step 4 - Data Triangulation
Involves using different sources of information in order to increase the validity of a study
These sources are likely to be stakeholders in a program - participants, other researchers, program staff, other community members, and so on.
Then we put all data in single framework & apply various statistical tools to find out the dynamic on the market.
During the analysis stage, feedback from the stakeholder groups would be compared to determine areas of agreement as well as areas of divergence


