
Key Insights
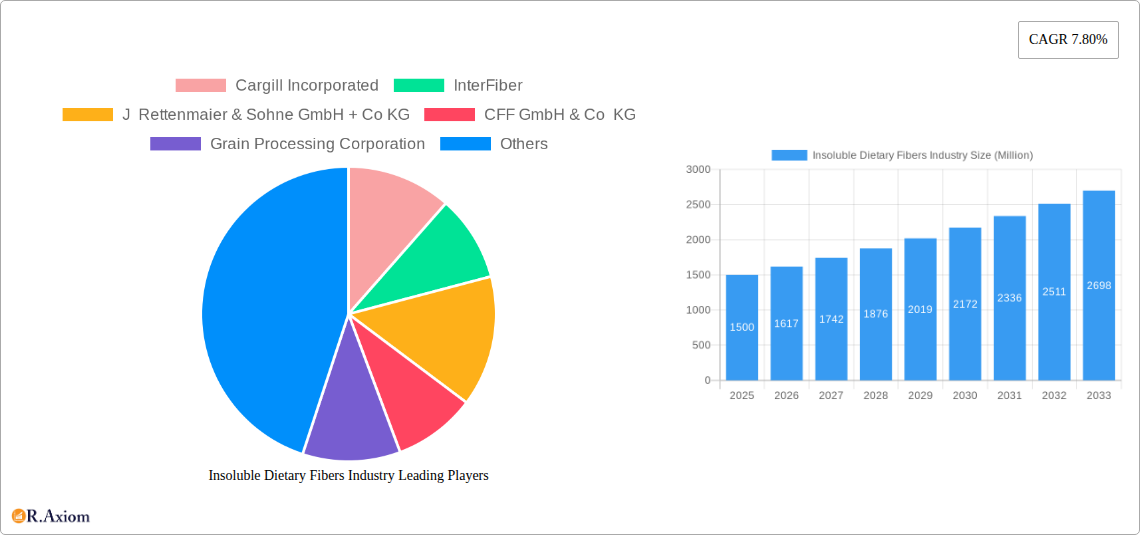
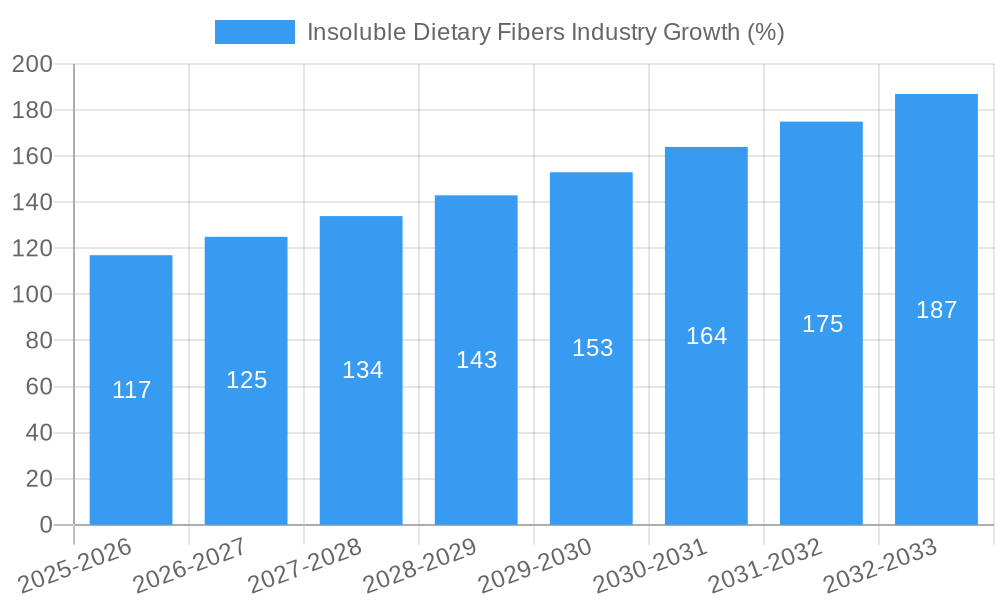
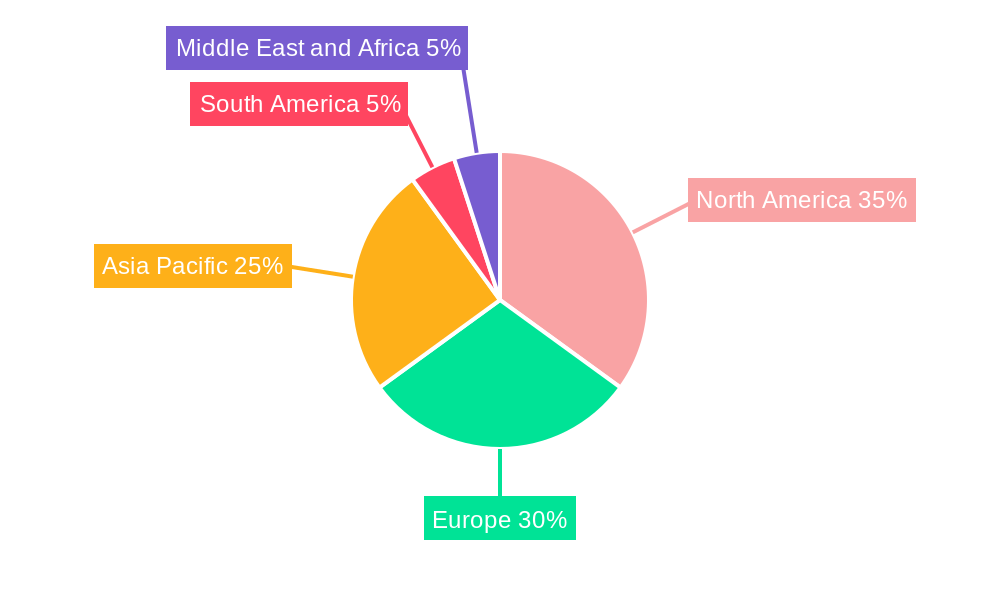
The global insoluble dietary fiber market, valued at approximately $XX million in 2025, is projected to experience robust growth, exhibiting a compound annual growth rate (CAGR) of 7.80% from 2025 to 2033. This expansion is fueled by several key drivers. The increasing prevalence of chronic diseases like diabetes and heart disease, directly linked to dietary fiber intake, is significantly boosting demand for insoluble fiber supplements and fiber-rich functional foods. Furthermore, growing consumer awareness of gut health and its impact on overall well-being is driving the adoption of fiber-enriched products across various food and beverage categories. The functional food and beverage segment is expected to remain a major application area, followed by the pharmaceutical and animal feed sectors. While the market is experiencing considerable growth, challenges such as fluctuating raw material prices and potential supply chain disruptions could act as restraints. The market is segmented by source (fruits & vegetables, cereals & grains, others) and application, reflecting the diversity of usage across different industries. Major players like Cargill Incorporated, Ingredion Incorporated, and DuPont are driving innovation and expanding their product portfolios to meet the burgeoning demand. Regional growth is expected to be robust across North America and Europe, driven by high consumer awareness and established product markets. Asia-Pacific, however, presents significant growth potential due to rising disposable incomes and increasing health consciousness in developing economies.
The market's segmentation offers opportunities for targeted product development. For instance, the growing interest in plant-based diets is increasing demand for fiber sources from fruits and vegetables, while the cereals and grains segment benefits from the continued popularity of whole grains. The pharmaceutical industry is likely to witness increased use of insoluble fiber in various formulations aimed at managing digestive issues and improving overall health outcomes. The sustained focus on sustainability and eco-friendly production methods within the food and beverage sector is influencing the sourcing and processing of insoluble dietary fibers, creating demand for suppliers who can align with these practices. Competition is expected to intensify with the entry of new players and the continued innovation by established companies focused on delivering higher quality, more functional, and sustainably produced insoluble fiber products. The forecast period suggests continued growth, with the market's size potentially exceeding $YY million by 2033 (assuming a consistent CAGR).
Insoluble Dietary Fibers Industry: A Comprehensive Market Report (2019-2033)
This detailed report provides a comprehensive analysis of the Insoluble Dietary Fibers industry, offering valuable insights for stakeholders seeking to understand market dynamics, growth opportunities, and competitive landscapes. The report covers the period from 2019 to 2033, with a focus on the forecast period of 2025-2033 and a base year of 2025. The global market size is projected at xx Million in 2025 and is expected to grow at a CAGR of xx% during the forecast period.
Insoluble Dietary Fibers Industry Market Concentration & Innovation
This section analyzes the market concentration, examining market share held by key players like Cargill Incorporated, InterFiber, J Rettenmaier & Sohne GmbH + Co KG, CFF GmbH & Co KG, Grain Processing Corporation, DuPont, Ingredion Incorporated, and SunOpta Inc. We assess the level of competition, identifying any dominant players and exploring the presence of barriers to entry. Innovation is a key focus, analyzing the drivers of new product development, including technological advancements in extraction and purification methods. The report explores regulatory frameworks governing the production and use of insoluble dietary fibers, examining their impact on market growth and innovation. Furthermore, the analysis delves into the existence and impact of product substitutes, as well as evolving end-user trends, and M&A activities within the industry, quantifying deal values where available (e.g., xx Million for a specific merger).
- Market Concentration: Cargill and Ingredion are estimated to hold a combined market share of approximately xx%, indicating a moderately concentrated market.
- Innovation Drivers: Growing consumer demand for healthier foods, advancements in extraction technologies, and the development of novel applications are key drivers of innovation.
- Regulatory Landscape: Regulations related to food safety and labeling significantly influence the industry.
- M&A Activity: Consolidation is anticipated, with potential for larger players acquiring smaller companies to expand their product portfolios and market reach.
Insoluble Dietary Fibers Industry Industry Trends & Insights
This section provides a deep dive into the trends shaping the insoluble dietary fiber market. It analyzes market growth drivers such as rising consumer awareness of gut health, the increasing prevalence of chronic diseases, and the growing demand for functional foods. Technological disruptions, such as advancements in extraction and purification processes and the development of novel fiber sources, are also explored. The report examines consumer preferences for natural and clean-label products and analyzes the competitive dynamics within the industry, including pricing strategies, product differentiation, and branding. The analysis includes a detailed assessment of the CAGR (Compound Annual Growth Rate) and market penetration rates across various segments and geographies.
Dominant Markets & Segments in Insoluble Dietary Fibers Industry
This section pinpoints the leading regions, countries, and segments within the insoluble dietary fiber market. It examines dominance by source (Fruits & Vegetables, Cereals & Grains, Others) and application (Functional food and beverages, Pharmaceuticals, Animal feed). Key drivers within each dominant segment are detailed using bullet points, focusing on economic policies, infrastructural development, and consumer preferences. A comprehensive analysis of the factors contributing to the dominance of specific regions and segments is provided.
- By Source: Cereals and grains are expected to be the dominant source of insoluble dietary fiber due to high production volumes and lower cost.
- By Application: The functional food and beverage sector is projected to be the largest application segment, driven by increasing consumer demand for health-conscious products.
Insoluble Dietary Fibers Industry Product Developments
This section offers a concise overview of recent product innovations, highlighting advancements in fiber extraction, purification, and modification techniques. It discusses how these innovations are enhancing product functionality, addressing consumer preferences, and creating competitive advantages for industry players. The emphasis is placed on understanding how technological advancements translate into improved market fit and consumer acceptance.
Report Scope & Segmentation Analysis
This section outlines the detailed segmentation of the Insoluble Dietary Fibers industry across various dimensions:
- By Source: Fruits & Vegetables, Cereals & Grains, Others – Each segment's growth projections, market sizes, and competitive landscapes are explored.
- By Application: Functional food and beverages, Pharmaceuticals, Animal feed – Each segment's growth trajectories, competitive forces, and market sizing are presented.
Each segment is analyzed independently, offering insights into its current status and future potential.
Key Drivers of Insoluble Dietary Fibers Industry Growth
Key growth drivers include increasing health consciousness among consumers, the rising prevalence of chronic diseases linked to poor diet, and growing demand for functional foods and beverages enriched with dietary fiber. Technological advancements in fiber extraction and modification, coupled with supportive government regulations promoting healthier diets, further fuel market growth.
Challenges in the Insoluble Dietary Fibers Industry Sector
Challenges include fluctuating raw material prices, supply chain disruptions, intense competition from existing and emerging players, and stringent regulatory requirements. These factors can create uncertainties and potentially impact profitability. For example, supply chain disruptions could lead to increased costs and decreased availability of raw materials.
Emerging Opportunities in Insoluble Dietary Fibers Industry
Emerging opportunities exist in expanding into new markets (especially developing economies with rising disposable incomes), developing innovative fiber-based products, and capitalizing on the growing demand for personalized nutrition and gut health solutions. New technologies in fiber modification will lead to improved functionality and novel applications.
Leading Players in the Insoluble Dietary Fibers Industry Market
- Cargill Incorporated https://www.cargill.com/
- InterFiber
- J Rettenmaier & Sohne GmbH + Co KG
- CFF GmbH & Co KG
- Grain Processing Corporation https://www.grainprocessing.com/
- DuPont https://www.dupont.com/
- Ingredion Incorporated https://www.ingredion.com/
- SunOpta Inc https://www.sunopta.com/
Key Developments in Insoluble Dietary Fibers Industry Industry
- 2021: Cargill expands its insoluble dietary fiber production capacity to meet growing demand.
- 2022: InterFiber launches a new range of high-purity insoluble dietary fibers.
- 2023: J Rettenmaier & Sohne GmbH + Co KG invests in a new insoluble dietary fiber extraction facility.
These developments demonstrate the industry's commitment to innovation and expansion, catering to the escalating global demand for insoluble dietary fibers.
Strategic Outlook for Insoluble Dietary Fibers Industry Market
The insoluble dietary fiber market is poised for robust growth driven by increasing consumer awareness of health benefits, technological advancements, and favorable regulatory support. Companies focusing on innovation, sustainability, and strategic partnerships will be well-positioned to capitalize on the expanding market opportunities. The focus on clean-label products and novel applications will be critical for success in the future.
Insoluble Dietary Fibers Industry Segmentation
-
1. source
- 1.1. Fruits & Vegetables
- 1.2. Cereals & Grains
- 1.3. Others
-
2. application
- 2.1. Functional food and beverages
- 2.2. Pharmaceuticals
- 2.3. Animal feed
Insoluble Dietary Fibers Industry Segmentation By Geography
-
1. North America
- 1.1. United States
- 1.2. Canada
- 1.3. Mexico
- 1.4. Rest of North America
-
2. Europe
- 2.1. Spain
- 2.2. United Kingdom
- 2.3. Germany
- 2.4. France
- 2.5. Italy
- 2.6. Russia
- 2.7. Rest of Europe
-
3. Asia Pacific
- 3.1. China
- 3.2. Japan
- 3.3. India
- 3.4. Australia
- 3.5. Rest of Asia Pacific
-
4. South America
- 4.1. Brazil
- 4.2. Argentina
- 4.3. Rest of South America
-
5. Middle East and Africa
- 5.1. South Africa
- 5.2. United Arab Emirates
- 5.3. Rest of Middle East and Africa
Insoluble Dietary Fibers Industry REPORT HIGHLIGHTS
| Aspects | Details |
|---|---|
| Study Period | 2019-2033 |
| Base Year | 2024 |
| Estimated Year | 2025 |
| Forecast Period | 2025-2033 |
| Historical Period | 2019-2024 |
| Growth Rate | CAGR of 7.80% from 2019-2033 |
| Segmentation |
|
Table of Contents
- 1. Introduction
- 1.1. Research Scope
- 1.2. Market Segmentation
- 1.3. Research Methodology
- 1.4. Definitions and Assumptions
- 2. Executive Summary
- 2.1. Introduction
- 3. Market Dynamics
- 3.1. Introduction
- 3.2. Market Drivers
- 3.2.1. Wide Applications and Functionality; Demand For Gluten-Free Products
- 3.3. Market Restrains
- 3.3.1. Easy Availability of Economically Feasible Alternatives
- 3.4. Market Trends
- 3.4.1. Increased demand for insoluble dietary fiber supplements
- 4. Market Factor Analysis
- 4.1. Porters Five Forces
- 4.2. Supply/Value Chain
- 4.3. PESTEL analysis
- 4.4. Market Entropy
- 4.5. Patent/Trademark Analysis
- 5. Global Insoluble Dietary Fibers Industry Analysis, Insights and Forecast, 2019-2031
- 5.1. Market Analysis, Insights and Forecast - by source
- 5.1.1. Fruits & Vegetables
- 5.1.2. Cereals & Grains
- 5.1.3. Others
- 5.2. Market Analysis, Insights and Forecast - by application
- 5.2.1. Functional food and beverages
- 5.2.2. Pharmaceuticals
- 5.2.3. Animal feed
- 5.3. Market Analysis, Insights and Forecast - by Region
- 5.3.1. North America
- 5.3.2. Europe
- 5.3.3. Asia Pacific
- 5.3.4. South America
- 5.3.5. Middle East and Africa
- 5.1. Market Analysis, Insights and Forecast - by source
- 6. North America Insoluble Dietary Fibers Industry Analysis, Insights and Forecast, 2019-2031
- 6.1. Market Analysis, Insights and Forecast - by source
- 6.1.1. Fruits & Vegetables
- 6.1.2. Cereals & Grains
- 6.1.3. Others
- 6.2. Market Analysis, Insights and Forecast - by application
- 6.2.1. Functional food and beverages
- 6.2.2. Pharmaceuticals
- 6.2.3. Animal feed
- 6.1. Market Analysis, Insights and Forecast - by source
- 7. Europe Insoluble Dietary Fibers Industry Analysis, Insights and Forecast, 2019-2031
- 7.1. Market Analysis, Insights and Forecast - by source
- 7.1.1. Fruits & Vegetables
- 7.1.2. Cereals & Grains
- 7.1.3. Others
- 7.2. Market Analysis, Insights and Forecast - by application
- 7.2.1. Functional food and beverages
- 7.2.2. Pharmaceuticals
- 7.2.3. Animal feed
- 7.1. Market Analysis, Insights and Forecast - by source
- 8. Asia Pacific Insoluble Dietary Fibers Industry Analysis, Insights and Forecast, 2019-2031
- 8.1. Market Analysis, Insights and Forecast - by source
- 8.1.1. Fruits & Vegetables
- 8.1.2. Cereals & Grains
- 8.1.3. Others
- 8.2. Market Analysis, Insights and Forecast - by application
- 8.2.1. Functional food and beverages
- 8.2.2. Pharmaceuticals
- 8.2.3. Animal feed
- 8.1. Market Analysis, Insights and Forecast - by source
- 9. South America Insoluble Dietary Fibers Industry Analysis, Insights and Forecast, 2019-2031
- 9.1. Market Analysis, Insights and Forecast - by source
- 9.1.1. Fruits & Vegetables
- 9.1.2. Cereals & Grains
- 9.1.3. Others
- 9.2. Market Analysis, Insights and Forecast - by application
- 9.2.1. Functional food and beverages
- 9.2.2. Pharmaceuticals
- 9.2.3. Animal feed
- 9.1. Market Analysis, Insights and Forecast - by source
- 10. Middle East and Africa Insoluble Dietary Fibers Industry Analysis, Insights and Forecast, 2019-2031
- 10.1. Market Analysis, Insights and Forecast - by source
- 10.1.1. Fruits & Vegetables
- 10.1.2. Cereals & Grains
- 10.1.3. Others
- 10.2. Market Analysis, Insights and Forecast - by application
- 10.2.1. Functional food and beverages
- 10.2.2. Pharmaceuticals
- 10.2.3. Animal feed
- 10.1. Market Analysis, Insights and Forecast - by source
- 11. North America Insoluble Dietary Fibers Industry Analysis, Insights and Forecast, 2019-2031
- 11.1. Market Analysis, Insights and Forecast - By Country/Sub-region
- 11.1.1 United States
- 11.1.2 Canada
- 11.1.3 Mexico
- 11.1.4 Rest of North America
- 12. Europe Insoluble Dietary Fibers Industry Analysis, Insights and Forecast, 2019-2031
- 12.1. Market Analysis, Insights and Forecast - By Country/Sub-region
- 12.1.1 Spain
- 12.1.2 United Kingdom
- 12.1.3 Germany
- 12.1.4 France
- 12.1.5 Italy
- 12.1.6 Russia
- 12.1.7 Rest of Europe
- 13. Asia Pacific Insoluble Dietary Fibers Industry Analysis, Insights and Forecast, 2019-2031
- 13.1. Market Analysis, Insights and Forecast - By Country/Sub-region
- 13.1.1 China
- 13.1.2 Japan
- 13.1.3 India
- 13.1.4 Australia
- 13.1.5 Rest of Asia Pacific
- 14. South America Insoluble Dietary Fibers Industry Analysis, Insights and Forecast, 2019-2031
- 14.1. Market Analysis, Insights and Forecast - By Country/Sub-region
- 14.1.1 Brazil
- 14.1.2 Argentina
- 14.1.3 Rest of South America
- 15. Middle East and Africa Insoluble Dietary Fibers Industry Analysis, Insights and Forecast, 2019-2031
- 15.1. Market Analysis, Insights and Forecast - By Country/Sub-region
- 15.1.1 South Africa
- 15.1.2 United Arab Emirates
- 15.1.3 Rest of Middle East and Africa
- 16. Competitive Analysis
- 16.1. Global Market Share Analysis 2024
- 16.2. Company Profiles
- 16.2.1 Cargill Incorporated
- 16.2.1.1. Overview
- 16.2.1.2. Products
- 16.2.1.3. SWOT Analysis
- 16.2.1.4. Recent Developments
- 16.2.1.5. Financials (Based on Availability)
- 16.2.2 InterFiber
- 16.2.2.1. Overview
- 16.2.2.2. Products
- 16.2.2.3. SWOT Analysis
- 16.2.2.4. Recent Developments
- 16.2.2.5. Financials (Based on Availability)
- 16.2.3 J Rettenmaier & Sohne GmbH + Co KG
- 16.2.3.1. Overview
- 16.2.3.2. Products
- 16.2.3.3. SWOT Analysis
- 16.2.3.4. Recent Developments
- 16.2.3.5. Financials (Based on Availability)
- 16.2.4 CFF GmbH & Co KG
- 16.2.4.1. Overview
- 16.2.4.2. Products
- 16.2.4.3. SWOT Analysis
- 16.2.4.4. Recent Developments
- 16.2.4.5. Financials (Based on Availability)
- 16.2.5 Grain Processing Corporation
- 16.2.5.1. Overview
- 16.2.5.2. Products
- 16.2.5.3. SWOT Analysis
- 16.2.5.4. Recent Developments
- 16.2.5.5. Financials (Based on Availability)
- 16.2.6 DuPont
- 16.2.6.1. Overview
- 16.2.6.2. Products
- 16.2.6.3. SWOT Analysis
- 16.2.6.4. Recent Developments
- 16.2.6.5. Financials (Based on Availability)
- 16.2.7 Ingredion Incorporated
- 16.2.7.1. Overview
- 16.2.7.2. Products
- 16.2.7.3. SWOT Analysis
- 16.2.7.4. Recent Developments
- 16.2.7.5. Financials (Based on Availability)
- 16.2.8 SunOpta Inc
- 16.2.8.1. Overview
- 16.2.8.2. Products
- 16.2.8.3. SWOT Analysis
- 16.2.8.4. Recent Developments
- 16.2.8.5. Financials (Based on Availability)
- 16.2.1 Cargill Incorporated
List of Figures
- Figure 1: Global Insoluble Dietary Fibers Industry Revenue Breakdown (Million, %) by Region 2024 & 2032
- Figure 2: North America Insoluble Dietary Fibers Industry Revenue (Million), by Country 2024 & 2032
- Figure 3: North America Insoluble Dietary Fibers Industry Revenue Share (%), by Country 2024 & 2032
- Figure 4: Europe Insoluble Dietary Fibers Industry Revenue (Million), by Country 2024 & 2032
- Figure 5: Europe Insoluble Dietary Fibers Industry Revenue Share (%), by Country 2024 & 2032
- Figure 6: Asia Pacific Insoluble Dietary Fibers Industry Revenue (Million), by Country 2024 & 2032
- Figure 7: Asia Pacific Insoluble Dietary Fibers Industry Revenue Share (%), by Country 2024 & 2032
- Figure 8: South America Insoluble Dietary Fibers Industry Revenue (Million), by Country 2024 & 2032
- Figure 9: South America Insoluble Dietary Fibers Industry Revenue Share (%), by Country 2024 & 2032
- Figure 10: Middle East and Africa Insoluble Dietary Fibers Industry Revenue (Million), by Country 2024 & 2032
- Figure 11: Middle East and Africa Insoluble Dietary Fibers Industry Revenue Share (%), by Country 2024 & 2032
- Figure 12: North America Insoluble Dietary Fibers Industry Revenue (Million), by source 2024 & 2032
- Figure 13: North America Insoluble Dietary Fibers Industry Revenue Share (%), by source 2024 & 2032
- Figure 14: North America Insoluble Dietary Fibers Industry Revenue (Million), by application 2024 & 2032
- Figure 15: North America Insoluble Dietary Fibers Industry Revenue Share (%), by application 2024 & 2032
- Figure 16: North America Insoluble Dietary Fibers Industry Revenue (Million), by Country 2024 & 2032
- Figure 17: North America Insoluble Dietary Fibers Industry Revenue Share (%), by Country 2024 & 2032
- Figure 18: Europe Insoluble Dietary Fibers Industry Revenue (Million), by source 2024 & 2032
- Figure 19: Europe Insoluble Dietary Fibers Industry Revenue Share (%), by source 2024 & 2032
- Figure 20: Europe Insoluble Dietary Fibers Industry Revenue (Million), by application 2024 & 2032
- Figure 21: Europe Insoluble Dietary Fibers Industry Revenue Share (%), by application 2024 & 2032
- Figure 22: Europe Insoluble Dietary Fibers Industry Revenue (Million), by Country 2024 & 2032
- Figure 23: Europe Insoluble Dietary Fibers Industry Revenue Share (%), by Country 2024 & 2032
- Figure 24: Asia Pacific Insoluble Dietary Fibers Industry Revenue (Million), by source 2024 & 2032
- Figure 25: Asia Pacific Insoluble Dietary Fibers Industry Revenue Share (%), by source 2024 & 2032
- Figure 26: Asia Pacific Insoluble Dietary Fibers Industry Revenue (Million), by application 2024 & 2032
- Figure 27: Asia Pacific Insoluble Dietary Fibers Industry Revenue Share (%), by application 2024 & 2032
- Figure 28: Asia Pacific Insoluble Dietary Fibers Industry Revenue (Million), by Country 2024 & 2032
- Figure 29: Asia Pacific Insoluble Dietary Fibers Industry Revenue Share (%), by Country 2024 & 2032
- Figure 30: South America Insoluble Dietary Fibers Industry Revenue (Million), by source 2024 & 2032
- Figure 31: South America Insoluble Dietary Fibers Industry Revenue Share (%), by source 2024 & 2032
- Figure 32: South America Insoluble Dietary Fibers Industry Revenue (Million), by application 2024 & 2032
- Figure 33: South America Insoluble Dietary Fibers Industry Revenue Share (%), by application 2024 & 2032
- Figure 34: South America Insoluble Dietary Fibers Industry Revenue (Million), by Country 2024 & 2032
- Figure 35: South America Insoluble Dietary Fibers Industry Revenue Share (%), by Country 2024 & 2032
- Figure 36: Middle East and Africa Insoluble Dietary Fibers Industry Revenue (Million), by source 2024 & 2032
- Figure 37: Middle East and Africa Insoluble Dietary Fibers Industry Revenue Share (%), by source 2024 & 2032
- Figure 38: Middle East and Africa Insoluble Dietary Fibers Industry Revenue (Million), by application 2024 & 2032
- Figure 39: Middle East and Africa Insoluble Dietary Fibers Industry Revenue Share (%), by application 2024 & 2032
- Figure 40: Middle East and Africa Insoluble Dietary Fibers Industry Revenue (Million), by Country 2024 & 2032
- Figure 41: Middle East and Africa Insoluble Dietary Fibers Industry Revenue Share (%), by Country 2024 & 2032
List of Tables
- Table 1: Global Insoluble Dietary Fibers Industry Revenue Million Forecast, by Region 2019 & 2032
- Table 2: Global Insoluble Dietary Fibers Industry Revenue Million Forecast, by source 2019 & 2032
- Table 3: Global Insoluble Dietary Fibers Industry Revenue Million Forecast, by application 2019 & 2032
- Table 4: Global Insoluble Dietary Fibers Industry Revenue Million Forecast, by Region 2019 & 2032
- Table 5: Global Insoluble Dietary Fibers Industry Revenue Million Forecast, by Country 2019 & 2032
- Table 6: United States Insoluble Dietary Fibers Industry Revenue (Million) Forecast, by Application 2019 & 2032
- Table 7: Canada Insoluble Dietary Fibers Industry Revenue (Million) Forecast, by Application 2019 & 2032
- Table 8: Mexico Insoluble Dietary Fibers Industry Revenue (Million) Forecast, by Application 2019 & 2032
- Table 9: Rest of North America Insoluble Dietary Fibers Industry Revenue (Million) Forecast, by Application 2019 & 2032
- Table 10: Global Insoluble Dietary Fibers Industry Revenue Million Forecast, by Country 2019 & 2032
- Table 11: Spain Insoluble Dietary Fibers Industry Revenue (Million) Forecast, by Application 2019 & 2032
- Table 12: United Kingdom Insoluble Dietary Fibers Industry Revenue (Million) Forecast, by Application 2019 & 2032
- Table 13: Germany Insoluble Dietary Fibers Industry Revenue (Million) Forecast, by Application 2019 & 2032
- Table 14: France Insoluble Dietary Fibers Industry Revenue (Million) Forecast, by Application 2019 & 2032
- Table 15: Italy Insoluble Dietary Fibers Industry Revenue (Million) Forecast, by Application 2019 & 2032
- Table 16: Russia Insoluble Dietary Fibers Industry Revenue (Million) Forecast, by Application 2019 & 2032
- Table 17: Rest of Europe Insoluble Dietary Fibers Industry Revenue (Million) Forecast, by Application 2019 & 2032
- Table 18: Global Insoluble Dietary Fibers Industry Revenue Million Forecast, by Country 2019 & 2032
- Table 19: China Insoluble Dietary Fibers Industry Revenue (Million) Forecast, by Application 2019 & 2032
- Table 20: Japan Insoluble Dietary Fibers Industry Revenue (Million) Forecast, by Application 2019 & 2032
- Table 21: India Insoluble Dietary Fibers Industry Revenue (Million) Forecast, by Application 2019 & 2032
- Table 22: Australia Insoluble Dietary Fibers Industry Revenue (Million) Forecast, by Application 2019 & 2032
- Table 23: Rest of Asia Pacific Insoluble Dietary Fibers Industry Revenue (Million) Forecast, by Application 2019 & 2032
- Table 24: Global Insoluble Dietary Fibers Industry Revenue Million Forecast, by Country 2019 & 2032
- Table 25: Brazil Insoluble Dietary Fibers Industry Revenue (Million) Forecast, by Application 2019 & 2032
- Table 26: Argentina Insoluble Dietary Fibers Industry Revenue (Million) Forecast, by Application 2019 & 2032
- Table 27: Rest of South America Insoluble Dietary Fibers Industry Revenue (Million) Forecast, by Application 2019 & 2032
- Table 28: Global Insoluble Dietary Fibers Industry Revenue Million Forecast, by Country 2019 & 2032
- Table 29: South Africa Insoluble Dietary Fibers Industry Revenue (Million) Forecast, by Application 2019 & 2032
- Table 30: United Arab Emirates Insoluble Dietary Fibers Industry Revenue (Million) Forecast, by Application 2019 & 2032
- Table 31: Rest of Middle East and Africa Insoluble Dietary Fibers Industry Revenue (Million) Forecast, by Application 2019 & 2032
- Table 32: Global Insoluble Dietary Fibers Industry Revenue Million Forecast, by source 2019 & 2032
- Table 33: Global Insoluble Dietary Fibers Industry Revenue Million Forecast, by application 2019 & 2032
- Table 34: Global Insoluble Dietary Fibers Industry Revenue Million Forecast, by Country 2019 & 2032
- Table 35: United States Insoluble Dietary Fibers Industry Revenue (Million) Forecast, by Application 2019 & 2032
- Table 36: Canada Insoluble Dietary Fibers Industry Revenue (Million) Forecast, by Application 2019 & 2032
- Table 37: Mexico Insoluble Dietary Fibers Industry Revenue (Million) Forecast, by Application 2019 & 2032
- Table 38: Rest of North America Insoluble Dietary Fibers Industry Revenue (Million) Forecast, by Application 2019 & 2032
- Table 39: Global Insoluble Dietary Fibers Industry Revenue Million Forecast, by source 2019 & 2032
- Table 40: Global Insoluble Dietary Fibers Industry Revenue Million Forecast, by application 2019 & 2032
- Table 41: Global Insoluble Dietary Fibers Industry Revenue Million Forecast, by Country 2019 & 2032
- Table 42: Spain Insoluble Dietary Fibers Industry Revenue (Million) Forecast, by Application 2019 & 2032
- Table 43: United Kingdom Insoluble Dietary Fibers Industry Revenue (Million) Forecast, by Application 2019 & 2032
- Table 44: Germany Insoluble Dietary Fibers Industry Revenue (Million) Forecast, by Application 2019 & 2032
- Table 45: France Insoluble Dietary Fibers Industry Revenue (Million) Forecast, by Application 2019 & 2032
- Table 46: Italy Insoluble Dietary Fibers Industry Revenue (Million) Forecast, by Application 2019 & 2032
- Table 47: Russia Insoluble Dietary Fibers Industry Revenue (Million) Forecast, by Application 2019 & 2032
- Table 48: Rest of Europe Insoluble Dietary Fibers Industry Revenue (Million) Forecast, by Application 2019 & 2032
- Table 49: Global Insoluble Dietary Fibers Industry Revenue Million Forecast, by source 2019 & 2032
- Table 50: Global Insoluble Dietary Fibers Industry Revenue Million Forecast, by application 2019 & 2032
- Table 51: Global Insoluble Dietary Fibers Industry Revenue Million Forecast, by Country 2019 & 2032
- Table 52: China Insoluble Dietary Fibers Industry Revenue (Million) Forecast, by Application 2019 & 2032
- Table 53: Japan Insoluble Dietary Fibers Industry Revenue (Million) Forecast, by Application 2019 & 2032
- Table 54: India Insoluble Dietary Fibers Industry Revenue (Million) Forecast, by Application 2019 & 2032
- Table 55: Australia Insoluble Dietary Fibers Industry Revenue (Million) Forecast, by Application 2019 & 2032
- Table 56: Rest of Asia Pacific Insoluble Dietary Fibers Industry Revenue (Million) Forecast, by Application 2019 & 2032
- Table 57: Global Insoluble Dietary Fibers Industry Revenue Million Forecast, by source 2019 & 2032
- Table 58: Global Insoluble Dietary Fibers Industry Revenue Million Forecast, by application 2019 & 2032
- Table 59: Global Insoluble Dietary Fibers Industry Revenue Million Forecast, by Country 2019 & 2032
- Table 60: Brazil Insoluble Dietary Fibers Industry Revenue (Million) Forecast, by Application 2019 & 2032
- Table 61: Argentina Insoluble Dietary Fibers Industry Revenue (Million) Forecast, by Application 2019 & 2032
- Table 62: Rest of South America Insoluble Dietary Fibers Industry Revenue (Million) Forecast, by Application 2019 & 2032
- Table 63: Global Insoluble Dietary Fibers Industry Revenue Million Forecast, by source 2019 & 2032
- Table 64: Global Insoluble Dietary Fibers Industry Revenue Million Forecast, by application 2019 & 2032
- Table 65: Global Insoluble Dietary Fibers Industry Revenue Million Forecast, by Country 2019 & 2032
- Table 66: South Africa Insoluble Dietary Fibers Industry Revenue (Million) Forecast, by Application 2019 & 2032
- Table 67: United Arab Emirates Insoluble Dietary Fibers Industry Revenue (Million) Forecast, by Application 2019 & 2032
- Table 68: Rest of Middle East and Africa Insoluble Dietary Fibers Industry Revenue (Million) Forecast, by Application 2019 & 2032
Frequently Asked Questions
1. What is the projected Compound Annual Growth Rate (CAGR) of the Insoluble Dietary Fibers Industry?
The projected CAGR is approximately 7.80%.
2. Which companies are prominent players in the Insoluble Dietary Fibers Industry?
Key companies in the market include Cargill Incorporated, InterFiber, J Rettenmaier & Sohne GmbH + Co KG, CFF GmbH & Co KG, Grain Processing Corporation, DuPont, Ingredion Incorporated, SunOpta Inc.
3. What are the main segments of the Insoluble Dietary Fibers Industry?
The market segments include source, application.
4. Can you provide details about the market size?
The market size is estimated to be USD XX Million as of 2022.
5. What are some drivers contributing to market growth?
Wide Applications and Functionality; Demand For Gluten-Free Products.
6. What are the notable trends driving market growth?
Increased demand for insoluble dietary fiber supplements.
7. Are there any restraints impacting market growth?
Easy Availability of Economically Feasible Alternatives.
8. Can you provide examples of recent developments in the market?
1. Cargill expands its insoluble dietary fiber production capacity to meet growing demand (2021) 2. InterFiber launches a new range of high-purity insoluble dietary fibers (2022) 3. J Rettenmaier & Sohne GmbH + Co KG invests in a new insoluble dietary fiber extraction facility (2023)
9. What pricing options are available for accessing the report?
Pricing options include single-user, multi-user, and enterprise licenses priced at USD 4750, USD 5250, and USD 8750 respectively.
10. Is the market size provided in terms of value or volume?
The market size is provided in terms of value, measured in Million.
11. Are there any specific market keywords associated with the report?
Yes, the market keyword associated with the report is "Insoluble Dietary Fibers Industry," which aids in identifying and referencing the specific market segment covered.
12. How do I determine which pricing option suits my needs best?
The pricing options vary based on user requirements and access needs. Individual users may opt for single-user licenses, while businesses requiring broader access may choose multi-user or enterprise licenses for cost-effective access to the report.
13. Are there any additional resources or data provided in the Insoluble Dietary Fibers Industry report?
While the report offers comprehensive insights, it's advisable to review the specific contents or supplementary materials provided to ascertain if additional resources or data are available.
14. How can I stay updated on further developments or reports in the Insoluble Dietary Fibers Industry?
To stay informed about further developments, trends, and reports in the Insoluble Dietary Fibers Industry, consider subscribing to industry newsletters, following relevant companies and organizations, or regularly checking reputable industry news sources and publications.
Methodology
Step 1 - Identification of Relevant Samples Size from Population Database


Step 2 - Approaches for Defining Global Market Size (Value, Volume* & Price*)

Note*: In applicable scenarios
Step 3 - Data Sources
Primary Research
- Web Analytics
- Survey Reports
- Research Institute
- Latest Research Reports
- Opinion Leaders
Secondary Research
- Annual Reports
- White Paper
- Latest Press Release
- Industry Association
- Paid Database
- Investor Presentations

Step 4 - Data Triangulation
Involves using different sources of information in order to increase the validity of a study
These sources are likely to be stakeholders in a program - participants, other researchers, program staff, other community members, and so on.
Then we put all data in single framework & apply various statistical tools to find out the dynamic on the market.
During the analysis stage, feedback from the stakeholder groups would be compared to determine areas of agreement as well as areas of divergence


