

Key Insights
The global market for Interactive Wayfinding Solutions is poised for substantial growth, projected to reach an estimated $9.45 billion by 2025, driven by an impressive Compound Annual Growth Rate (CAGR) of 13.16% through 2033. This robust expansion is fueled by the increasing adoption of digital signage and interactive kiosks across various public and private spaces. As urban populations continue to grow and the complexity of large venues like shopping malls, airports, and universities escalates, the demand for intuitive and efficient navigation systems becomes paramount. The integration of advanced technologies such as AI-powered search, personalized route planning, and real-time updates is transforming the way individuals navigate unfamiliar environments, enhancing user experience and operational efficiency for venue managers. Furthermore, the ongoing digital transformation across industries is creating fertile ground for these solutions, enabling businesses to provide a seamless and engaging visitor journey.
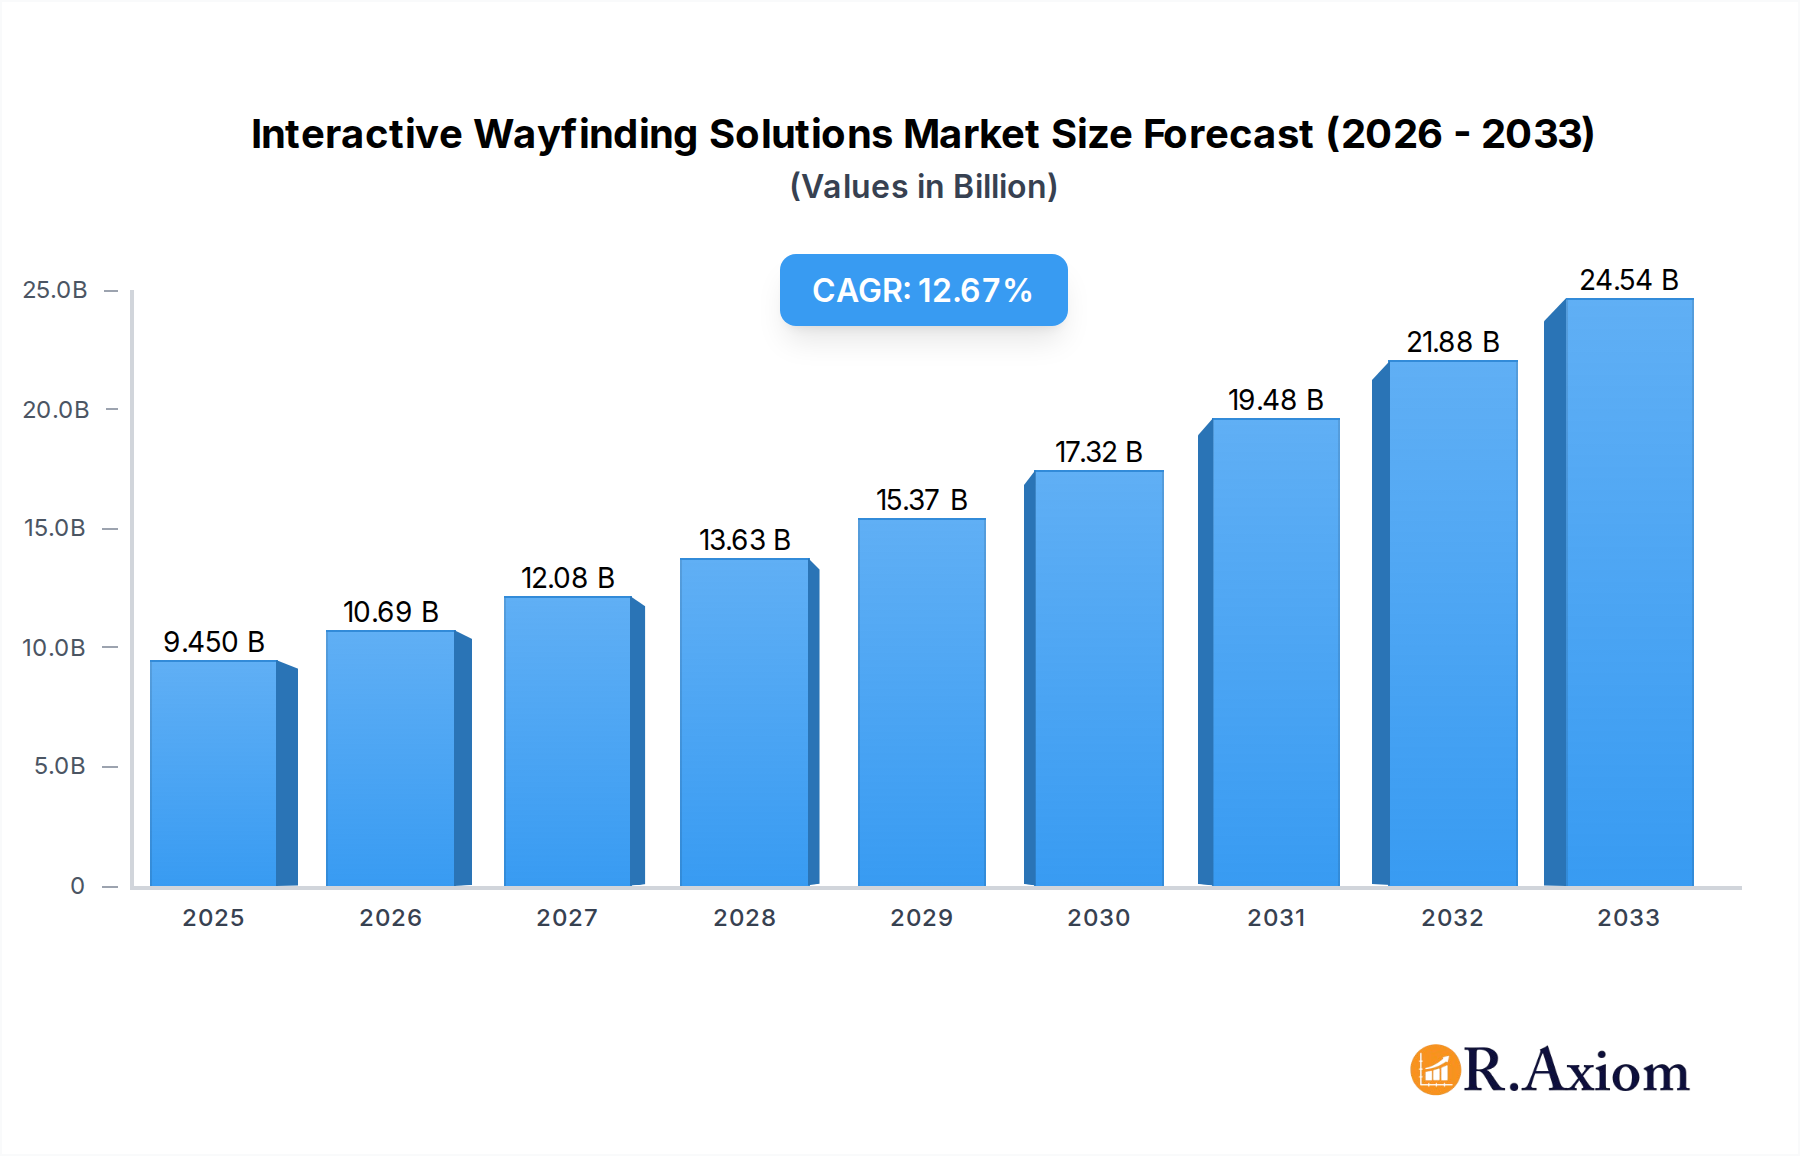
Interactive Wayfinding Solutions Market Size (In Billion)
Key drivers propelling this market include the escalating need for improved customer experience, the burgeoning smart city initiatives, and the growing investment in digital infrastructure. The rising popularity of mobile wayfinding applications, offering personalized and on-the-go navigation, is a significant trend, complementing the deployment of static kiosk solutions. While the market experiences strong tailwinds, certain restraints, such as the initial high cost of implementation for some advanced systems and the need for ongoing maintenance and content updates, could present challenges. However, the long-term benefits in terms of increased footfall, enhanced operational management, and improved brand perception are likely to outweigh these concerns. Companies are actively investing in research and development to offer more sophisticated, user-friendly, and cost-effective solutions, further solidifying the growth trajectory of the interactive wayfinding market. The market is segmented by application, with shopping malls and airports being prominent sectors, and by type, with mobile wayfinding and kiosks dominating the landscape.

Interactive Wayfinding Solutions Company Market Share
Interactive Wayfinding Solutions Market Concentration & Innovation
The global interactive wayfinding solutions market exhibits moderate concentration, with a dynamic interplay between established players and emerging innovators. Key companies like Sensory Technologies, Kiosk Innova, TrouDigital, Express Image, LamasaTech, Advertise Me, Point HD, Mvix Digital, Convergent, SignCast, Morrow Technologies Corporation, Trueform Digital, Mindspace Digital Signage, and Jarma Technologies are actively shaping the market landscape. Innovation is primarily driven by advancements in digital signage, touch screen technology, AI-powered navigation, augmented reality (AR) integration, and the increasing demand for personalized user experiences. Regulatory frameworks, particularly those related to data privacy and accessibility, are becoming increasingly important considerations for solution providers. Product substitutes, while present in simpler forms like static signage, are largely being superseded by the superior functionality and engagement offered by interactive solutions. End-user trends highlight a growing preference for seamless, intuitive navigation in high-traffic public spaces, emphasizing convenience and efficiency. Mergers and acquisitions (M&A) activities, valued at approximately $5 billion in the historical period, are expected to see continued momentum as companies seek to expand their technological capabilities, market reach, and customer base. This strategic consolidation aims to capture a larger share of the projected $150 billion market by 2033.
Interactive Wayfinding Solutions Industry Trends & Insights
The interactive wayfinding solutions industry is poised for robust growth, projected to expand at a compound annual growth rate (CAGR) of approximately 18.5% from 2025 to 2033. This significant expansion is fueled by a confluence of technological advancements, evolving consumer expectations, and increasing adoption across diverse sectors. The proliferation of smartphones and the increasing reliance on mobile devices for information access have catalyzed the development and adoption of mobile wayfinding solutions, which are seamlessly integrated with physical installations. The evolution of Artificial Intelligence (AI) and Machine Learning (ML) is enabling more personalized and intelligent navigation experiences, allowing for real-time updates, predictive routing, and proactive assistance. Augmented Reality (AR) technology is emerging as a transformative force, overlaying digital information onto the real world, providing an immersive and highly intuitive wayfinding experience. The demand for hyper-personalized content and engagement is driving the integration of interactive kiosks with dynamic digital signage, offering tailored information, promotions, and interactive experiences. Market penetration is rapidly increasing in sectors such as retail, healthcare, and transportation, where efficient navigation significantly enhances customer satisfaction and operational efficiency. The competitive landscape is characterized by intense innovation, with companies continuously striving to offer more sophisticated features, user-friendly interfaces, and cost-effective solutions. The global market size, estimated at around $50 billion in the base year of 2025, is projected to reach an impressive $150 billion by the end of the forecast period in 2033, underscoring the immense growth potential of this sector. This upward trajectory is further supported by increasing investments in smart city initiatives and the digitalization of public spaces worldwide.
Dominant Markets & Segments in Interactive Wayfinding Solutions
The interactive wayfinding solutions market is witnessing significant dominance from the Shopping Mall application segment, which is expected to command approximately 35% of the total market share by 2033. This dominance is driven by the complex layouts of modern retail spaces and the consumer desire for efficient navigation to find specific stores, amenities, and promotions. Economic policies encouraging retail development and increased consumer spending power in key regions further bolster this segment. Airports represent another substantial market, accounting for an estimated 25% of the market share. The critical need for efficient passenger flow, information dissemination, and enhanced travel experiences in high-pressure environments like airports makes interactive wayfinding indispensable. Infrastructure development and government investments in airport modernization are key drivers.
The University segment is projected to capture around 15% of the market share, propelled by the need to guide students, faculty, and visitors across large, often sprawling campuses. Universities are investing in digital signage and mobile solutions to improve campus navigation, streamline access to facilities, and enhance student engagement. Regulatory frameworks supporting digital transformation in education also contribute to this growth. Museums and Parks, while smaller in market share at approximately 10% and 5% respectively, are increasingly recognizing the value of interactive wayfinding to enrich visitor experiences. Museums use it to provide context and information about exhibits, while parks leverage it for trail guidance and information about natural attractions. The "Others" segment, encompassing hospitals, corporate campuses, and entertainment venues, collectively holds the remaining 10% and represents a growing area for interactive wayfinding adoption, driven by the universal need for efficient and engaging navigation.
In terms of types, Wayfinding Kiosks currently dominate the market, holding an estimated 60% share due to their established presence and versatility in providing static and dynamic information. However, Mobile Wayfinding solutions are experiencing rapid growth, projected to capture 40% of the market by 2033, driven by the ubiquity of smartphones and the demand for personalized, on-the-go navigation.
Interactive Wayfinding Solutions Product Developments
Product development in interactive wayfinding solutions is currently focused on enhancing user experience through AI-powered personalization, augmented reality overlays, and seamless integration across multiple devices. Innovations include intuitive touch interfaces, voice-activated navigation, and real-time traffic flow analysis to optimize routes. Solutions are increasingly incorporating digital advertising capabilities, transforming wayfinding kiosks into revenue-generating platforms. Competitive advantages are being built around offering robust analytics for venue managers, customizable branding, and scalable deployment options.
Report Scope & Segmentation Analysis
This report provides a comprehensive analysis of the interactive wayfinding solutions market, segmented by Application and Type. The Shopping Mall application segment is a significant revenue generator, expected to grow at a CAGR of 19% from 2025-2033, driven by increasing retail space digitalization. Airport applications are projected to grow at a CAGR of 17%, fueled by global travel recovery and infrastructure upgrades. University applications are anticipated to expand at a CAGR of 16%, supporting campus digitalization efforts. Museum and Park applications, while smaller, are showing strong growth potential with CAGRs of 15% and 14% respectively, as these venues focus on enhancing visitor engagement. The Others segment, including healthcare and corporate facilities, is expected to grow at 16.5%. In terms of Types, Wayfinding Kiosks are projected to maintain market leadership with a 15% CAGR, while Mobile Wayfinding is set to outpace growth with an impressive 22% CAGR, reflecting a shift towards personalized digital experiences.
Key Drivers of Interactive Wayfinding Solutions Growth
The primary drivers propelling the interactive wayfinding solutions market include the escalating demand for enhanced customer experiences in public spaces, significant technological advancements in digital signage and AI, and the growing trend of smart city development globally. The increasing adoption of mobile devices for navigation and information access, coupled with the need for efficient crowd management in high-traffic venues like airports and shopping malls, further fuel market expansion. Economic incentives supporting digitalization initiatives and a focus on improving operational efficiency in various sectors are also key contributing factors.
Challenges in the Interactive Wayfinding Solutions Sector
Despite strong growth prospects, the interactive wayfinding solutions sector faces several challenges. High initial investment costs for hardware and software can be a barrier for smaller organizations. Ensuring seamless integration with existing infrastructure and overcoming potential interoperability issues across different platforms remain complex. Cybersecurity concerns and the need to protect sensitive user data are paramount, requiring robust security protocols. Furthermore, the rapid pace of technological change necessitates continuous updates and maintenance, adding to the total cost of ownership. Evolving regulatory landscapes regarding data privacy and accessibility also present compliance hurdles for solution providers.
Emerging Opportunities in Interactive Wayfinding Solutions
Emerging opportunities in the interactive wayfinding solutions market are centered around leveraging advanced technologies and catering to new use cases. The integration of AI for predictive analytics and personalized content delivery presents a significant growth avenue. The increasing adoption of Augmented Reality (AR) for immersive wayfinding experiences offers a compelling competitive advantage. Expansion into emerging markets and untapped sectors like public transportation hubs, large-scale event venues, and healthcare facilities holds substantial promise. The growing demand for sustainable and energy-efficient solutions also opens up new product development opportunities.
Leading Players in the Interactive Wayfinding Solutions Market
- Sensory Technologies
- Kiosk Innova
- TrouDigital
- Express Image
- LamasaTech
- Advertise Me
- Point HD
- Mvix Digital
- Convergent
- SignCast
- Morrow Technologies Corporation
- Trueform Digital
- Mindspace Digital Signage
- Jarma Technologies
Key Developments in Interactive Wayfinding Solutions Industry
- 2023 May: Kiosk Innova launched an AI-powered interactive kiosk with advanced analytics for retail environments.
- 2023 August: LamasaTech introduced a new AR-enabled mobile wayfinding app for universities.
- 2023 November: Mvix Digital announced a partnership with a major airport operator to deploy digital signage solutions.
- 2024 January: Trueform Digital acquired a smaller competitor to expand its service offerings in the European market.
- 2024 March: Sensory Technologies showcased its latest cloud-based wayfinding platform at an industry expo, highlighting scalability and remote management capabilities.
Strategic Outlook for Interactive Wayfinding Solutions Market
The strategic outlook for the interactive wayfinding solutions market is overwhelmingly positive, driven by continuous innovation and an expanding application base. The focus will remain on delivering highly personalized, intuitive, and engaging user experiences through the integration of AI, AR, and IoT technologies. Market players are expected to prioritize partnerships and collaborations to enhance their technological capabilities and broaden their market reach. The increasing trend towards smart city initiatives and the digitalization of public spaces will create sustained demand. Companies that can offer comprehensive, scalable, and cost-effective solutions with robust data analytics will be well-positioned for future success and to capture a significant share of the projected market growth.
Interactive Wayfinding Solutions Segmentation
-
1. Application
- 1.1. Shopping Mall
- 1.2. Airport
- 1.3. University
- 1.4. Museum
- 1.5. Park
- 1.6. Others
-
2. Types
- 2.1. Mobile Wayfinding
- 2.2. Wayfinding Kiosks
Interactive Wayfinding Solutions Segmentation By Geography
-
1. North America
- 1.1. United States
- 1.2. Canada
- 1.3. Mexico
-
2. South America
- 2.1. Brazil
- 2.2. Argentina
- 2.3. Rest of South America
-
3. Europe
- 3.1. United Kingdom
- 3.2. Germany
- 3.3. France
- 3.4. Italy
- 3.5. Spain
- 3.6. Russia
- 3.7. Benelux
- 3.8. Nordics
- 3.9. Rest of Europe
-
4. Middle East & Africa
- 4.1. Turkey
- 4.2. Israel
- 4.3. GCC
- 4.4. North Africa
- 4.5. South Africa
- 4.6. Rest of Middle East & Africa
-
5. Asia Pacific
- 5.1. China
- 5.2. India
- 5.3. Japan
- 5.4. South Korea
- 5.5. ASEAN
- 5.6. Oceania
- 5.7. Rest of Asia Pacific
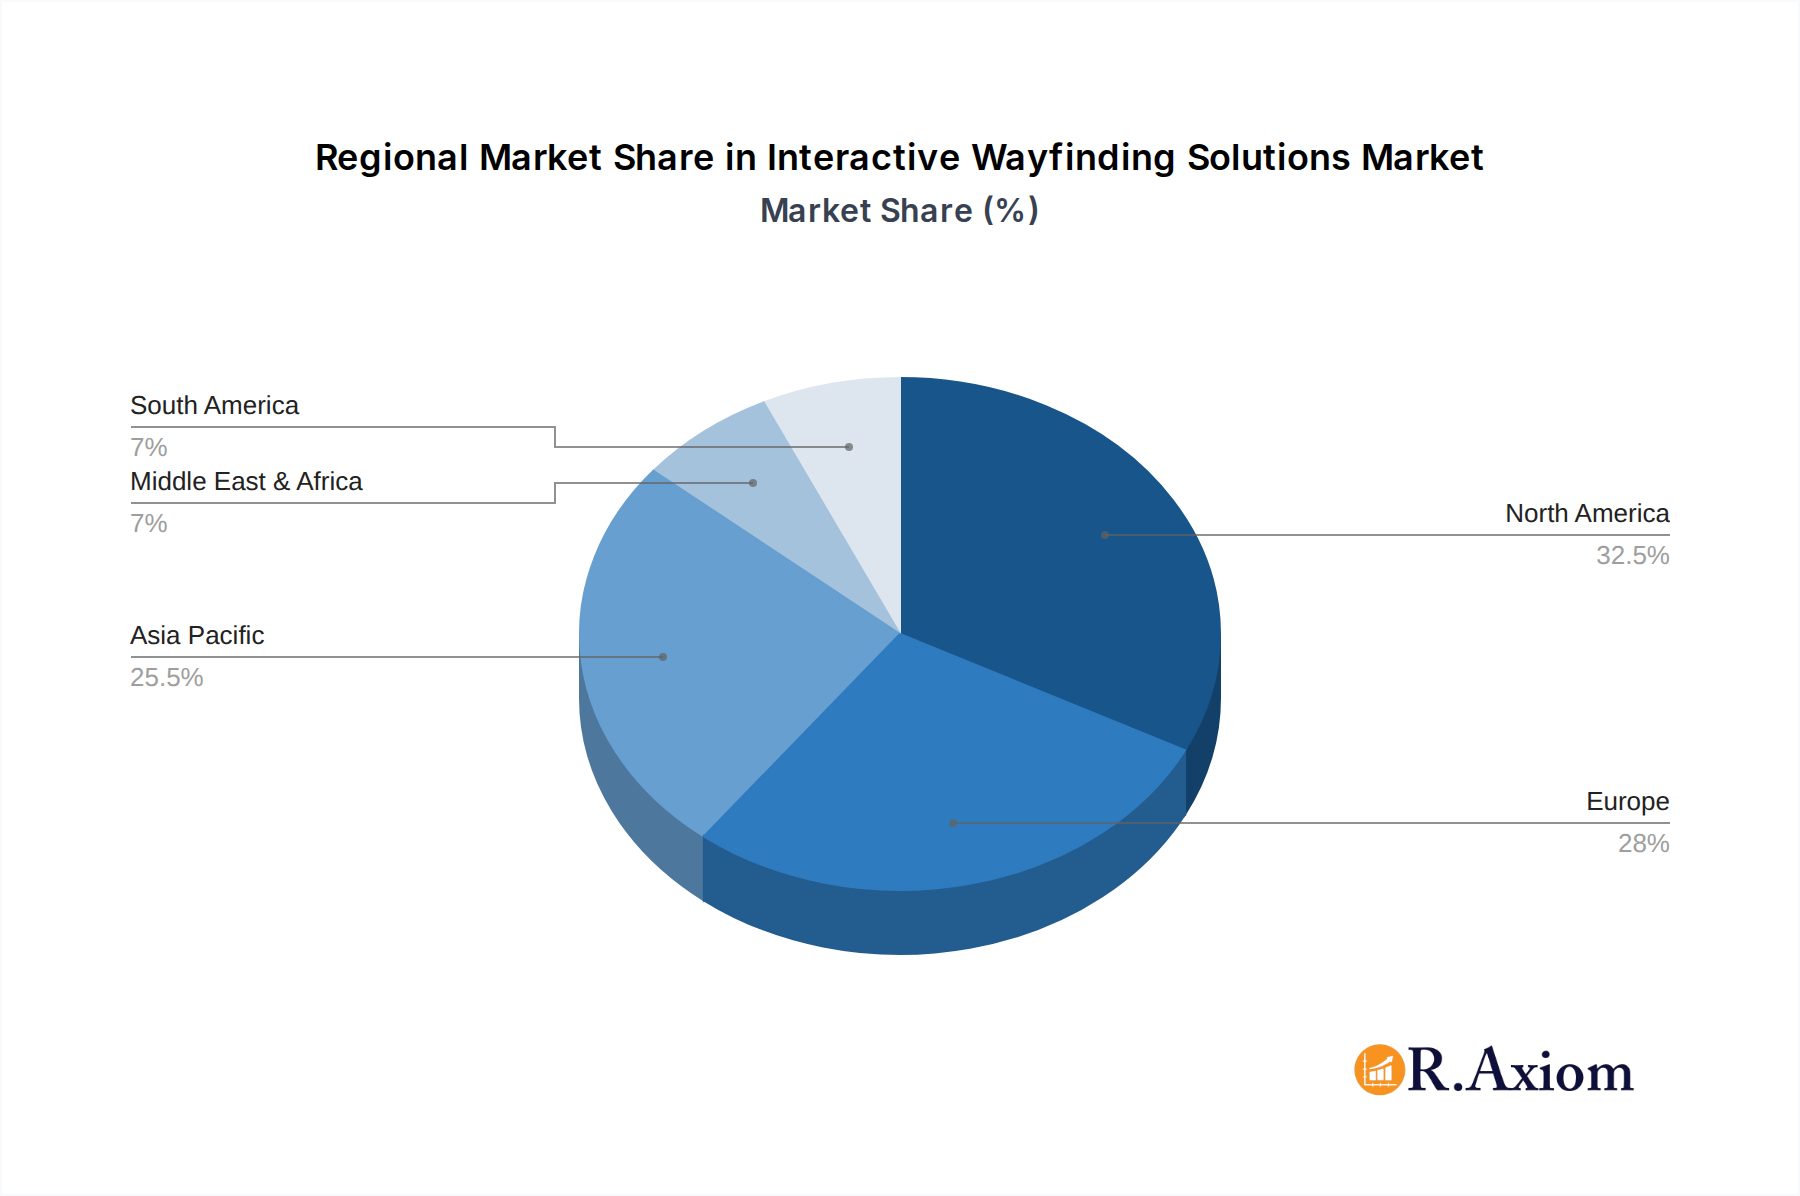
Interactive Wayfinding Solutions Regional Market Share
Geographic Coverage of Interactive Wayfinding Solutions
Interactive Wayfinding Solutions REPORT HIGHLIGHTS
| Aspects | Details |
|---|---|
| Study Period | 2020-2034 |
| Base Year | 2025 |
| Estimated Year | 2026 |
| Forecast Period | 2026-2034 |
| Historical Period | 2020-2025 |
| Growth Rate | CAGR of 13.16% from 2020-2034 |
| Segmentation |
|
Table of Contents
- 1. Introduction
- 1.1. Research Scope
- 1.2. Market Segmentation
- 1.3. Research Methodology
- 1.4. Definitions and Assumptions
- 2. Executive Summary
- 2.1. Introduction
- 3. Market Dynamics
- 3.1. Introduction
- 3.2. Market Drivers
- 3.3. Market Restrains
- 3.4. Market Trends
- 4. Market Factor Analysis
- 4.1. Porters Five Forces
- 4.2. Supply/Value Chain
- 4.3. PESTEL analysis
- 4.4. Market Entropy
- 4.5. Patent/Trademark Analysis
- 5. Global Interactive Wayfinding Solutions Analysis, Insights and Forecast, 2020-2032
- 5.1. Market Analysis, Insights and Forecast - by Application
- 5.1.1. Shopping Mall
- 5.1.2. Airport
- 5.1.3. University
- 5.1.4. Museum
- 5.1.5. Park
- 5.1.6. Others
- 5.2. Market Analysis, Insights and Forecast - by Types
- 5.2.1. Mobile Wayfinding
- 5.2.2. Wayfinding Kiosks
- 5.3. Market Analysis, Insights and Forecast - by Region
- 5.3.1. North America
- 5.3.2. South America
- 5.3.3. Europe
- 5.3.4. Middle East & Africa
- 5.3.5. Asia Pacific
- 5.1. Market Analysis, Insights and Forecast - by Application
- 6. North America Interactive Wayfinding Solutions Analysis, Insights and Forecast, 2020-2032
- 6.1. Market Analysis, Insights and Forecast - by Application
- 6.1.1. Shopping Mall
- 6.1.2. Airport
- 6.1.3. University
- 6.1.4. Museum
- 6.1.5. Park
- 6.1.6. Others
- 6.2. Market Analysis, Insights and Forecast - by Types
- 6.2.1. Mobile Wayfinding
- 6.2.2. Wayfinding Kiosks
- 6.1. Market Analysis, Insights and Forecast - by Application
- 7. South America Interactive Wayfinding Solutions Analysis, Insights and Forecast, 2020-2032
- 7.1. Market Analysis, Insights and Forecast - by Application
- 7.1.1. Shopping Mall
- 7.1.2. Airport
- 7.1.3. University
- 7.1.4. Museum
- 7.1.5. Park
- 7.1.6. Others
- 7.2. Market Analysis, Insights and Forecast - by Types
- 7.2.1. Mobile Wayfinding
- 7.2.2. Wayfinding Kiosks
- 7.1. Market Analysis, Insights and Forecast - by Application
- 8. Europe Interactive Wayfinding Solutions Analysis, Insights and Forecast, 2020-2032
- 8.1. Market Analysis, Insights and Forecast - by Application
- 8.1.1. Shopping Mall
- 8.1.2. Airport
- 8.1.3. University
- 8.1.4. Museum
- 8.1.5. Park
- 8.1.6. Others
- 8.2. Market Analysis, Insights and Forecast - by Types
- 8.2.1. Mobile Wayfinding
- 8.2.2. Wayfinding Kiosks
- 8.1. Market Analysis, Insights and Forecast - by Application
- 9. Middle East & Africa Interactive Wayfinding Solutions Analysis, Insights and Forecast, 2020-2032
- 9.1. Market Analysis, Insights and Forecast - by Application
- 9.1.1. Shopping Mall
- 9.1.2. Airport
- 9.1.3. University
- 9.1.4. Museum
- 9.1.5. Park
- 9.1.6. Others
- 9.2. Market Analysis, Insights and Forecast - by Types
- 9.2.1. Mobile Wayfinding
- 9.2.2. Wayfinding Kiosks
- 9.1. Market Analysis, Insights and Forecast - by Application
- 10. Asia Pacific Interactive Wayfinding Solutions Analysis, Insights and Forecast, 2020-2032
- 10.1. Market Analysis, Insights and Forecast - by Application
- 10.1.1. Shopping Mall
- 10.1.2. Airport
- 10.1.3. University
- 10.1.4. Museum
- 10.1.5. Park
- 10.1.6. Others
- 10.2. Market Analysis, Insights and Forecast - by Types
- 10.2.1. Mobile Wayfinding
- 10.2.2. Wayfinding Kiosks
- 10.1. Market Analysis, Insights and Forecast - by Application
- 11. Competitive Analysis
- 11.1. Global Market Share Analysis 2025
- 11.2. Company Profiles
- 11.2.1 Sensory Technologies
- 11.2.1.1. Overview
- 11.2.1.2. Products
- 11.2.1.3. SWOT Analysis
- 11.2.1.4. Recent Developments
- 11.2.1.5. Financials (Based on Availability)
- 11.2.2 Kiosk Innova
- 11.2.2.1. Overview
- 11.2.2.2. Products
- 11.2.2.3. SWOT Analysis
- 11.2.2.4. Recent Developments
- 11.2.2.5. Financials (Based on Availability)
- 11.2.3 TrouDigital
- 11.2.3.1. Overview
- 11.2.3.2. Products
- 11.2.3.3. SWOT Analysis
- 11.2.3.4. Recent Developments
- 11.2.3.5. Financials (Based on Availability)
- 11.2.4 Express Image
- 11.2.4.1. Overview
- 11.2.4.2. Products
- 11.2.4.3. SWOT Analysis
- 11.2.4.4. Recent Developments
- 11.2.4.5. Financials (Based on Availability)
- 11.2.5 LamasaTech
- 11.2.5.1. Overview
- 11.2.5.2. Products
- 11.2.5.3. SWOT Analysis
- 11.2.5.4. Recent Developments
- 11.2.5.5. Financials (Based on Availability)
- 11.2.6 Advertise Me
- 11.2.6.1. Overview
- 11.2.6.2. Products
- 11.2.6.3. SWOT Analysis
- 11.2.6.4. Recent Developments
- 11.2.6.5. Financials (Based on Availability)
- 11.2.7 Point HD
- 11.2.7.1. Overview
- 11.2.7.2. Products
- 11.2.7.3. SWOT Analysis
- 11.2.7.4. Recent Developments
- 11.2.7.5. Financials (Based on Availability)
- 11.2.8 Mvix Digital
- 11.2.8.1. Overview
- 11.2.8.2. Products
- 11.2.8.3. SWOT Analysis
- 11.2.8.4. Recent Developments
- 11.2.8.5. Financials (Based on Availability)
- 11.2.9 Convergent
- 11.2.9.1. Overview
- 11.2.9.2. Products
- 11.2.9.3. SWOT Analysis
- 11.2.9.4. Recent Developments
- 11.2.9.5. Financials (Based on Availability)
- 11.2.10 SignCast
- 11.2.10.1. Overview
- 11.2.10.2. Products
- 11.2.10.3. SWOT Analysis
- 11.2.10.4. Recent Developments
- 11.2.10.5. Financials (Based on Availability)
- 11.2.11 Morrow Technologies Corporation
- 11.2.11.1. Overview
- 11.2.11.2. Products
- 11.2.11.3. SWOT Analysis
- 11.2.11.4. Recent Developments
- 11.2.11.5. Financials (Based on Availability)
- 11.2.12 Trueform Digital
- 11.2.12.1. Overview
- 11.2.12.2. Products
- 11.2.12.3. SWOT Analysis
- 11.2.12.4. Recent Developments
- 11.2.12.5. Financials (Based on Availability)
- 11.2.13 Mindspace Digital Signage
- 11.2.13.1. Overview
- 11.2.13.2. Products
- 11.2.13.3. SWOT Analysis
- 11.2.13.4. Recent Developments
- 11.2.13.5. Financials (Based on Availability)
- 11.2.14 Jarma Technologies
- 11.2.14.1. Overview
- 11.2.14.2. Products
- 11.2.14.3. SWOT Analysis
- 11.2.14.4. Recent Developments
- 11.2.14.5. Financials (Based on Availability)
- 11.2.1 Sensory Technologies
List of Figures
- Figure 1: Global Interactive Wayfinding Solutions Revenue Breakdown (billion, %) by Region 2025 & 2033
- Figure 2: North America Interactive Wayfinding Solutions Revenue (billion), by Application 2025 & 2033
- Figure 3: North America Interactive Wayfinding Solutions Revenue Share (%), by Application 2025 & 2033
- Figure 4: North America Interactive Wayfinding Solutions Revenue (billion), by Types 2025 & 2033
- Figure 5: North America Interactive Wayfinding Solutions Revenue Share (%), by Types 2025 & 2033
- Figure 6: North America Interactive Wayfinding Solutions Revenue (billion), by Country 2025 & 2033
- Figure 7: North America Interactive Wayfinding Solutions Revenue Share (%), by Country 2025 & 2033
- Figure 8: South America Interactive Wayfinding Solutions Revenue (billion), by Application 2025 & 2033
- Figure 9: South America Interactive Wayfinding Solutions Revenue Share (%), by Application 2025 & 2033
- Figure 10: South America Interactive Wayfinding Solutions Revenue (billion), by Types 2025 & 2033
- Figure 11: South America Interactive Wayfinding Solutions Revenue Share (%), by Types 2025 & 2033
- Figure 12: South America Interactive Wayfinding Solutions Revenue (billion), by Country 2025 & 2033
- Figure 13: South America Interactive Wayfinding Solutions Revenue Share (%), by Country 2025 & 2033
- Figure 14: Europe Interactive Wayfinding Solutions Revenue (billion), by Application 2025 & 2033
- Figure 15: Europe Interactive Wayfinding Solutions Revenue Share (%), by Application 2025 & 2033
- Figure 16: Europe Interactive Wayfinding Solutions Revenue (billion), by Types 2025 & 2033
- Figure 17: Europe Interactive Wayfinding Solutions Revenue Share (%), by Types 2025 & 2033
- Figure 18: Europe Interactive Wayfinding Solutions Revenue (billion), by Country 2025 & 2033
- Figure 19: Europe Interactive Wayfinding Solutions Revenue Share (%), by Country 2025 & 2033
- Figure 20: Middle East & Africa Interactive Wayfinding Solutions Revenue (billion), by Application 2025 & 2033
- Figure 21: Middle East & Africa Interactive Wayfinding Solutions Revenue Share (%), by Application 2025 & 2033
- Figure 22: Middle East & Africa Interactive Wayfinding Solutions Revenue (billion), by Types 2025 & 2033
- Figure 23: Middle East & Africa Interactive Wayfinding Solutions Revenue Share (%), by Types 2025 & 2033
- Figure 24: Middle East & Africa Interactive Wayfinding Solutions Revenue (billion), by Country 2025 & 2033
- Figure 25: Middle East & Africa Interactive Wayfinding Solutions Revenue Share (%), by Country 2025 & 2033
- Figure 26: Asia Pacific Interactive Wayfinding Solutions Revenue (billion), by Application 2025 & 2033
- Figure 27: Asia Pacific Interactive Wayfinding Solutions Revenue Share (%), by Application 2025 & 2033
- Figure 28: Asia Pacific Interactive Wayfinding Solutions Revenue (billion), by Types 2025 & 2033
- Figure 29: Asia Pacific Interactive Wayfinding Solutions Revenue Share (%), by Types 2025 & 2033
- Figure 30: Asia Pacific Interactive Wayfinding Solutions Revenue (billion), by Country 2025 & 2033
- Figure 31: Asia Pacific Interactive Wayfinding Solutions Revenue Share (%), by Country 2025 & 2033
List of Tables
- Table 1: Global Interactive Wayfinding Solutions Revenue billion Forecast, by Application 2020 & 2033
- Table 2: Global Interactive Wayfinding Solutions Revenue billion Forecast, by Types 2020 & 2033
- Table 3: Global Interactive Wayfinding Solutions Revenue billion Forecast, by Region 2020 & 2033
- Table 4: Global Interactive Wayfinding Solutions Revenue billion Forecast, by Application 2020 & 2033
- Table 5: Global Interactive Wayfinding Solutions Revenue billion Forecast, by Types 2020 & 2033
- Table 6: Global Interactive Wayfinding Solutions Revenue billion Forecast, by Country 2020 & 2033
- Table 7: United States Interactive Wayfinding Solutions Revenue (billion) Forecast, by Application 2020 & 2033
- Table 8: Canada Interactive Wayfinding Solutions Revenue (billion) Forecast, by Application 2020 & 2033
- Table 9: Mexico Interactive Wayfinding Solutions Revenue (billion) Forecast, by Application 2020 & 2033
- Table 10: Global Interactive Wayfinding Solutions Revenue billion Forecast, by Application 2020 & 2033
- Table 11: Global Interactive Wayfinding Solutions Revenue billion Forecast, by Types 2020 & 2033
- Table 12: Global Interactive Wayfinding Solutions Revenue billion Forecast, by Country 2020 & 2033
- Table 13: Brazil Interactive Wayfinding Solutions Revenue (billion) Forecast, by Application 2020 & 2033
- Table 14: Argentina Interactive Wayfinding Solutions Revenue (billion) Forecast, by Application 2020 & 2033
- Table 15: Rest of South America Interactive Wayfinding Solutions Revenue (billion) Forecast, by Application 2020 & 2033
- Table 16: Global Interactive Wayfinding Solutions Revenue billion Forecast, by Application 2020 & 2033
- Table 17: Global Interactive Wayfinding Solutions Revenue billion Forecast, by Types 2020 & 2033
- Table 18: Global Interactive Wayfinding Solutions Revenue billion Forecast, by Country 2020 & 2033
- Table 19: United Kingdom Interactive Wayfinding Solutions Revenue (billion) Forecast, by Application 2020 & 2033
- Table 20: Germany Interactive Wayfinding Solutions Revenue (billion) Forecast, by Application 2020 & 2033
- Table 21: France Interactive Wayfinding Solutions Revenue (billion) Forecast, by Application 2020 & 2033
- Table 22: Italy Interactive Wayfinding Solutions Revenue (billion) Forecast, by Application 2020 & 2033
- Table 23: Spain Interactive Wayfinding Solutions Revenue (billion) Forecast, by Application 2020 & 2033
- Table 24: Russia Interactive Wayfinding Solutions Revenue (billion) Forecast, by Application 2020 & 2033
- Table 25: Benelux Interactive Wayfinding Solutions Revenue (billion) Forecast, by Application 2020 & 2033
- Table 26: Nordics Interactive Wayfinding Solutions Revenue (billion) Forecast, by Application 2020 & 2033
- Table 27: Rest of Europe Interactive Wayfinding Solutions Revenue (billion) Forecast, by Application 2020 & 2033
- Table 28: Global Interactive Wayfinding Solutions Revenue billion Forecast, by Application 2020 & 2033
- Table 29: Global Interactive Wayfinding Solutions Revenue billion Forecast, by Types 2020 & 2033
- Table 30: Global Interactive Wayfinding Solutions Revenue billion Forecast, by Country 2020 & 2033
- Table 31: Turkey Interactive Wayfinding Solutions Revenue (billion) Forecast, by Application 2020 & 2033
- Table 32: Israel Interactive Wayfinding Solutions Revenue (billion) Forecast, by Application 2020 & 2033
- Table 33: GCC Interactive Wayfinding Solutions Revenue (billion) Forecast, by Application 2020 & 2033
- Table 34: North Africa Interactive Wayfinding Solutions Revenue (billion) Forecast, by Application 2020 & 2033
- Table 35: South Africa Interactive Wayfinding Solutions Revenue (billion) Forecast, by Application 2020 & 2033
- Table 36: Rest of Middle East & Africa Interactive Wayfinding Solutions Revenue (billion) Forecast, by Application 2020 & 2033
- Table 37: Global Interactive Wayfinding Solutions Revenue billion Forecast, by Application 2020 & 2033
- Table 38: Global Interactive Wayfinding Solutions Revenue billion Forecast, by Types 2020 & 2033
- Table 39: Global Interactive Wayfinding Solutions Revenue billion Forecast, by Country 2020 & 2033
- Table 40: China Interactive Wayfinding Solutions Revenue (billion) Forecast, by Application 2020 & 2033
- Table 41: India Interactive Wayfinding Solutions Revenue (billion) Forecast, by Application 2020 & 2033
- Table 42: Japan Interactive Wayfinding Solutions Revenue (billion) Forecast, by Application 2020 & 2033
- Table 43: South Korea Interactive Wayfinding Solutions Revenue (billion) Forecast, by Application 2020 & 2033
- Table 44: ASEAN Interactive Wayfinding Solutions Revenue (billion) Forecast, by Application 2020 & 2033
- Table 45: Oceania Interactive Wayfinding Solutions Revenue (billion) Forecast, by Application 2020 & 2033
- Table 46: Rest of Asia Pacific Interactive Wayfinding Solutions Revenue (billion) Forecast, by Application 2020 & 2033
Frequently Asked Questions
1. What is the projected Compound Annual Growth Rate (CAGR) of the Interactive Wayfinding Solutions?
The projected CAGR is approximately 13.16%.
2. Which companies are prominent players in the Interactive Wayfinding Solutions?
Key companies in the market include Sensory Technologies, Kiosk Innova, TrouDigital, Express Image, LamasaTech, Advertise Me, Point HD, Mvix Digital, Convergent, SignCast, Morrow Technologies Corporation, Trueform Digital, Mindspace Digital Signage, Jarma Technologies.
3. What are the main segments of the Interactive Wayfinding Solutions?
The market segments include Application, Types.
4. Can you provide details about the market size?
The market size is estimated to be USD 9.45 billion as of 2022.
5. What are some drivers contributing to market growth?
N/A
6. What are the notable trends driving market growth?
N/A
7. Are there any restraints impacting market growth?
N/A
8. Can you provide examples of recent developments in the market?
N/A
9. What pricing options are available for accessing the report?
Pricing options include single-user, multi-user, and enterprise licenses priced at USD 3350.00, USD 5025.00, and USD 6700.00 respectively.
10. Is the market size provided in terms of value or volume?
The market size is provided in terms of value, measured in billion.
11. Are there any specific market keywords associated with the report?
Yes, the market keyword associated with the report is "Interactive Wayfinding Solutions," which aids in identifying and referencing the specific market segment covered.
12. How do I determine which pricing option suits my needs best?
The pricing options vary based on user requirements and access needs. Individual users may opt for single-user licenses, while businesses requiring broader access may choose multi-user or enterprise licenses for cost-effective access to the report.
13. Are there any additional resources or data provided in the Interactive Wayfinding Solutions report?
While the report offers comprehensive insights, it's advisable to review the specific contents or supplementary materials provided to ascertain if additional resources or data are available.
14. How can I stay updated on further developments or reports in the Interactive Wayfinding Solutions?
To stay informed about further developments, trends, and reports in the Interactive Wayfinding Solutions, consider subscribing to industry newsletters, following relevant companies and organizations, or regularly checking reputable industry news sources and publications.
Methodology
Step 1 - Identification of Relevant Samples Size from Population Database


Step 2 - Approaches for Defining Global Market Size (Value, Volume* & Price*)

Note*: In applicable scenarios
Step 3 - Data Sources
Primary Research
- Web Analytics
- Survey Reports
- Research Institute
- Latest Research Reports
- Opinion Leaders
Secondary Research
- Annual Reports
- White Paper
- Latest Press Release
- Industry Association
- Paid Database
- Investor Presentations

Step 4 - Data Triangulation
Involves using different sources of information in order to increase the validity of a study
These sources are likely to be stakeholders in a program - participants, other researchers, program staff, other community members, and so on.
Then we put all data in single framework & apply various statistical tools to find out the dynamic on the market.
During the analysis stage, feedback from the stakeholder groups would be compared to determine areas of agreement as well as areas of divergence