
Key Insights
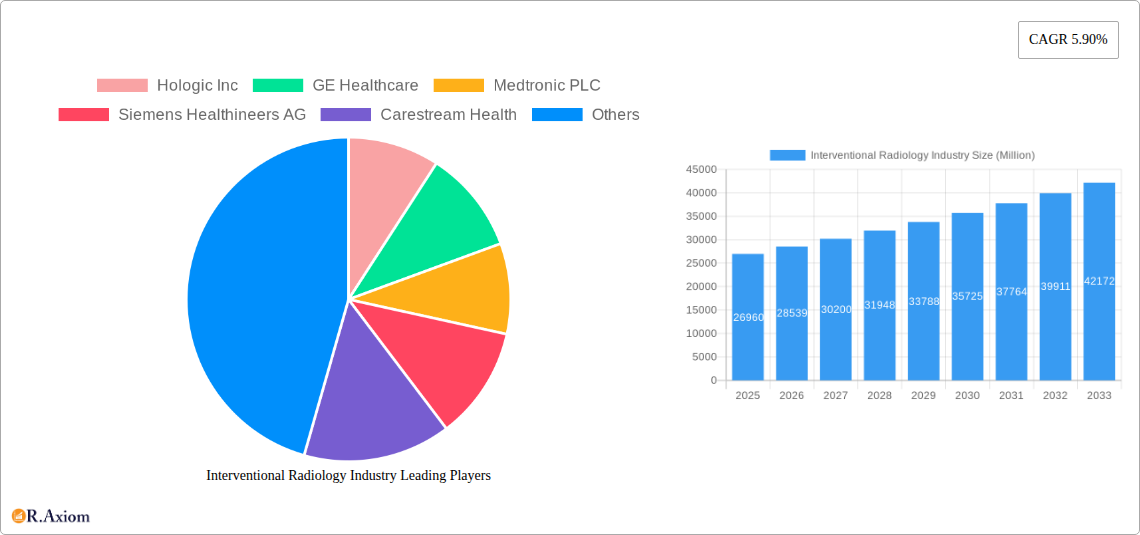
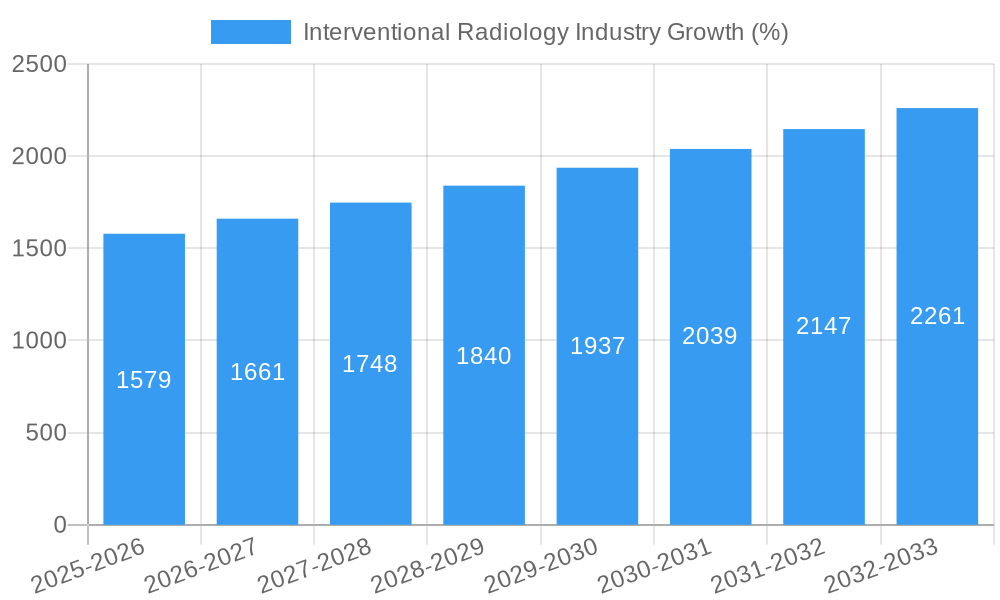
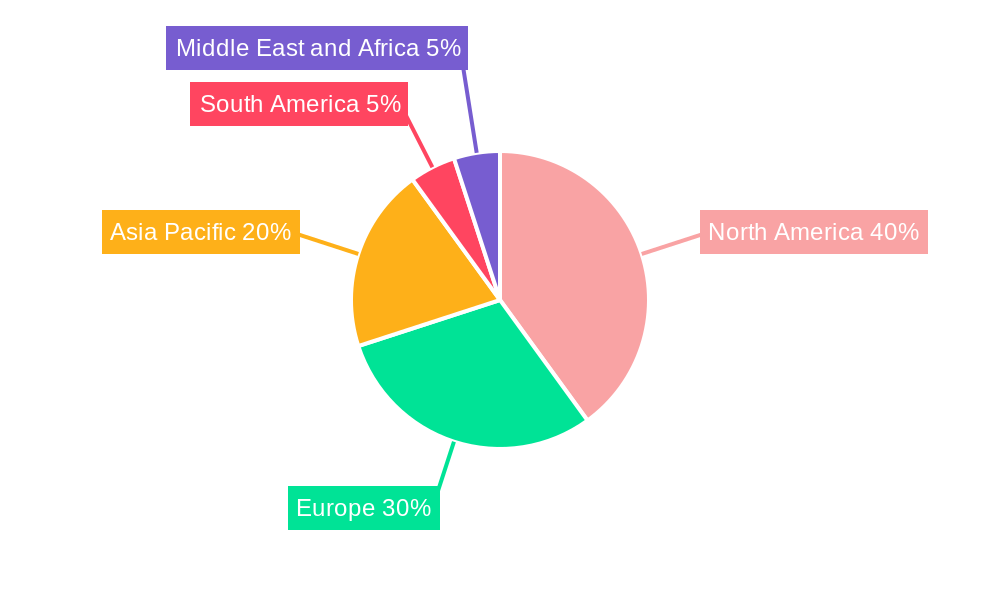
The Interventional Radiology market, valued at $26.96 billion in 2025, is projected to experience robust growth, driven by a Compound Annual Growth Rate (CAGR) of 5.90% from 2025 to 2033. This expansion is fueled by several key factors. Technological advancements in imaging systems like MRI, CT scanners, and ultrasound, coupled with minimally invasive procedures, are leading to improved patient outcomes and reduced recovery times. The aging global population, increasing prevalence of chronic diseases such as cardiovascular disorders and cancer, and a rising demand for less-invasive treatment options are significant market drivers. Furthermore, the increasing adoption of advanced imaging techniques like angiography and fluoroscopy, along with the development of sophisticated biopsy devices, is contributing to market growth. However, high equipment costs, stringent regulatory approvals, and the need for skilled professionals can pose challenges to market expansion. Geographic distribution reveals strong growth in regions like North America and Asia-Pacific, driven by substantial healthcare investments and increasing healthcare awareness. The market is segmented by product (MRI, Ultrasound, CT, Angiography, Fluoroscopy, Biopsy devices, others) and application (Cardiology, Urology & Nephrology, Oncology, Gastroenterology, others), allowing for targeted market penetration strategies. Competition is intense among key players like GE Healthcare, Siemens Healthineers, and Philips, driving innovation and price competitiveness.
The forecast period (2025-2033) anticipates continued market expansion, although the CAGR might see slight fluctuations based on economic factors and technological breakthroughs. Specific growth within segments will likely be influenced by advancements in specific imaging modalities and their applications within various specialties. For instance, the development of AI-powered diagnostic tools integrated with interventional radiology procedures could significantly impact future market growth. Similarly, the increasing adoption of telehealth and remote monitoring technologies might reshape service delivery models and further drive market expansion. Strategic partnerships and mergers & acquisitions among market players are expected to remain significant strategic moves influencing market consolidation and innovation. Ultimately, the Interventional Radiology market is poised for considerable growth, driven by technological progress, demographic shifts, and an increasing focus on minimally invasive procedures.
Interventional Radiology Industry Market Report: 2019-2033
This comprehensive report provides a detailed analysis of the Interventional Radiology industry, covering market size, segmentation, growth drivers, challenges, and key players. The study period spans 2019-2033, with 2025 as the base and estimated year. The report offers actionable insights for industry stakeholders, including manufacturers, investors, and healthcare professionals. The market is projected to reach xx Million by 2033.
Interventional Radiology Industry Market Concentration & Innovation
The Interventional Radiology market exhibits a moderately concentrated landscape, with a handful of multinational corporations holding significant market share. Key players such as GE Healthcare, Philips, and Siemens Healthineers dominate various segments through their extensive product portfolios and global reach. However, smaller, specialized companies are also making inroads, particularly in niche areas like minimally invasive procedures and advanced imaging technologies. The market share of the top five players is estimated at approximately 60% in 2025.
Innovation is a crucial driver, fueled by advancements in medical imaging, minimally invasive techniques, and data analytics. Regulatory frameworks, such as those set by the FDA and other global health authorities, heavily influence product development and market access. The industry constantly faces pressure from substitute technologies, especially in areas where non-invasive methods are being developed. End-user trends towards less invasive procedures and personalized medicine are significantly impacting market growth. M&A activity has been relatively robust in recent years, with deal values exceeding xx Million annually. This consolidates market share and accelerates technology integration.
- Market Share: Top 5 players - 60% (2025 estimate)
- M&A Deal Value: > xx Million annually (average over past 5 years)
- Key Innovation Drivers: AI-powered image analysis, robotic-assisted interventions, minimally invasive techniques.
- Regulatory Influences: FDA approvals, CE markings, reimbursement policies.
Interventional Radiology Industry Industry Trends & Insights
The Interventional Radiology market is experiencing robust growth, driven by several factors. The aging global population, rising prevalence of chronic diseases, and increasing demand for minimally invasive procedures are major contributors to market expansion. Technological advancements, such as AI-powered image analysis and robotic assistance, are improving diagnostic accuracy and treatment efficacy, further driving adoption. Consumer preferences are shifting towards faster recovery times and reduced hospital stays, aligning perfectly with the benefits of interventional radiology. However, the market is not without its competitive challenges. Intense competition among established players and emerging companies is leading to price pressures and the need for continuous innovation. The market is expected to witness a Compound Annual Growth Rate (CAGR) of xx% during the forecast period (2025-2033). Market penetration is currently at xx% in developed nations and is expected to grow to xx% by 2033.
Dominant Markets & Segments in Interventional Radiology Industry
The North American region currently holds the largest market share in Interventional Radiology, driven by factors such as high healthcare expenditure, advanced medical infrastructure, and a large aging population. Within the product segments, Angiography Systems and Ultrasound Imaging Systems are the largest revenue generators. In applications, Cardiology and Oncology represent major market segments.
Key Drivers of Regional Dominance (North America):
- High healthcare expenditure.
- Advanced medical infrastructure.
- Large aging population.
- Favorable regulatory environment.
Dominant Product Segments:
- Angiography Systems: High demand due to its crucial role in various procedures.
- Ultrasound Imaging Systems: Versatility and relatively lower cost compared to other imaging modalities contribute to its widespread adoption.
Dominant Application Segments:
- Cardiology: High incidence of cardiovascular diseases fuels demand for interventional procedures.
- Oncology: Growing cancer prevalence and adoption of minimally invasive cancer treatments drive market growth.
Interventional Radiology Industry Product Developments
Recent product innovations are focused on enhancing image quality, improving procedural precision, and minimizing invasiveness. Advances in AI, robotics, and 3D imaging are transforming the field, leading to better diagnostic accuracy and treatment outcomes. New products often integrate multiple technologies, such as combining advanced imaging with minimally invasive devices, creating more efficient and effective solutions. These developments are shaping the competitive landscape, with companies striving for a balance between innovation and affordability.
Report Scope & Segmentation Analysis
This report segments the Interventional Radiology market by product (MRI Systems, Ultrasound Imaging Systems, CT Scanners, Angiography Systems, Fluoroscopy Systems, Biopsy Devices, Other Products) and application (Cardiology, Urology and Nephrology, Oncology, Gastroenterology, Other Applications). Each segment’s growth projections, market sizes, and competitive dynamics are thoroughly analyzed. For example, the Angiography Systems segment is expected to experience significant growth due to technological advancements and increased demand. The Oncology application segment is witnessing robust growth due to the rise in cancer prevalence.
Key Drivers of Interventional Radiology Industry Growth
Technological advancements in imaging, minimally invasive techniques, and data analytics are paramount. The aging global population increases demand for cardiovascular and cancer treatments. Favorable reimbursement policies and government initiatives supporting healthcare infrastructure are boosting market growth. Rising healthcare expenditure and increasing disposable incomes in developing nations contribute positively to the industry’s expansion.
Challenges in the Interventional Radiology Industry Sector
Regulatory hurdles for product approvals can delay market entry. Supply chain disruptions can impact the availability of essential components. High capital investment requirements for advanced equipment can limit market entry for smaller players. Intense competition among established players necessitates continuous innovation to maintain a competitive edge.
Emerging Opportunities in Interventional Radiology Industry
The development of AI-powered image analysis tools presents significant opportunities for improved diagnostic accuracy. Robotic-assisted interventions are expanding the capabilities of minimally invasive procedures. Tele-radiology is enabling remote access to expert consultations, increasing accessibility. Personalized medicine and targeted therapies are creating new applications for interventional radiology.
Leading Players in the Interventional Radiology Industry Market
- Hologic Inc
- GE Healthcare
- Medtronic PLC
- Siemens Healthineers AG
- Carestream Health
- Koninklijke Philips NV
- Canon Medical Systems Corporation
- Cook Medical
- Esaote SPA
- Shimadzu Corporation
- Samsung Medison (Samsung Electronics Co Ltd)
- Fujifilm Holdings Corporation
Key Developments in Interventional Radiology Industry Industry
- November 2022: Konica Minolta Healthcare Americas launched the Sonimage MX1 Platinum point-of-care ultrasound system. This launch expands access to ultrasound technology in various settings.
- November 2022: Fujifilm Healthcare Americas Corporation launched the Scenaria View Focus Edition CT system with Cardio StillShot technology. This enhances cardiac imaging capabilities.
- October 2022: GE Healthcare launched the Omni Legend all-digital PET/CT platform, improving operational efficiency and image quality.
Strategic Outlook for Interventional Radiology Industry Market
The Interventional Radiology market is poised for sustained growth, driven by technological advancements and increasing demand for minimally invasive procedures. Strategic investments in R&D, strategic partnerships, and expansion into emerging markets will be crucial for maintaining a competitive edge. The focus on personalized medicine and AI integration will define the future of this dynamic sector, creating opportunities for innovative companies.
Interventional Radiology Industry Segmentation
-
1. Product
- 1.1. MRI Systems
- 1.2. Ultrasound Imaging Systems
- 1.3. CT Scanners
- 1.4. Angiography Systems
- 1.5. Fluoroscopy Systems
- 1.6. Biopsy Devices
- 1.7. Other Products
-
2. Application
- 2.1. Cardiology
- 2.2. Urology and Nephrology
- 2.3. Oncology
- 2.4. Gastroenterology
- 2.5. Other Applications
Interventional Radiology Industry Segmentation By Geography
-
1. North America
- 1.1. United States
- 1.2. Canada
- 1.3. Mexico
-
2. Europe
- 2.1. Germany
- 2.2. United Kingdom
- 2.3. France
- 2.4. Italy
- 2.5. Spain
- 2.6. Rest of Europe
-
3. Asia Pacific
- 3.1. China
- 3.2. Japan
- 3.3. India
- 3.4. Australia
- 3.5. South Korea
- 3.6. Rest of Asia Pacific
-
4. Middle East and Africa
- 4.1. GCC
- 4.2. South Africa
- 4.3. Rest of Middle East and Africa
-
5. South America
- 5.1. Brazil
- 5.2. Argentina
- 5.3. Rest of South America
Interventional Radiology Industry REPORT HIGHLIGHTS
| Aspects | Details |
|---|---|
| Study Period | 2019-2033 |
| Base Year | 2024 |
| Estimated Year | 2025 |
| Forecast Period | 2025-2033 |
| Historical Period | 2019-2024 |
| Growth Rate | CAGR of 5.90% from 2019-2033 |
| Segmentation |
|
Table of Contents
- 1. Introduction
- 1.1. Research Scope
- 1.2. Market Segmentation
- 1.3. Research Methodology
- 1.4. Definitions and Assumptions
- 2. Executive Summary
- 2.1. Introduction
- 3. Market Dynamics
- 3.1. Introduction
- 3.2. Market Drivers
- 3.2.1. Increasing Burden of Chronic Diseases; Technological Advancements in Interventional Radiology Devices
- 3.3. Market Restrains
- 3.3.1. Risk of High Radiation Exposure; High Cost of Equipment
- 3.4. Market Trends
- 3.4.1. The Cardiology Application is Expected to Witness High Growth Over the Forecast Period
- 4. Market Factor Analysis
- 4.1. Porters Five Forces
- 4.2. Supply/Value Chain
- 4.3. PESTEL analysis
- 4.4. Market Entropy
- 4.5. Patent/Trademark Analysis
- 5. Global Interventional Radiology Industry Analysis, Insights and Forecast, 2019-2031
- 5.1. Market Analysis, Insights and Forecast - by Product
- 5.1.1. MRI Systems
- 5.1.2. Ultrasound Imaging Systems
- 5.1.3. CT Scanners
- 5.1.4. Angiography Systems
- 5.1.5. Fluoroscopy Systems
- 5.1.6. Biopsy Devices
- 5.1.7. Other Products
- 5.2. Market Analysis, Insights and Forecast - by Application
- 5.2.1. Cardiology
- 5.2.2. Urology and Nephrology
- 5.2.3. Oncology
- 5.2.4. Gastroenterology
- 5.2.5. Other Applications
- 5.3. Market Analysis, Insights and Forecast - by Region
- 5.3.1. North America
- 5.3.2. Europe
- 5.3.3. Asia Pacific
- 5.3.4. Middle East and Africa
- 5.3.5. South America
- 5.1. Market Analysis, Insights and Forecast - by Product
- 6. North America Interventional Radiology Industry Analysis, Insights and Forecast, 2019-2031
- 6.1. Market Analysis, Insights and Forecast - by Product
- 6.1.1. MRI Systems
- 6.1.2. Ultrasound Imaging Systems
- 6.1.3. CT Scanners
- 6.1.4. Angiography Systems
- 6.1.5. Fluoroscopy Systems
- 6.1.6. Biopsy Devices
- 6.1.7. Other Products
- 6.2. Market Analysis, Insights and Forecast - by Application
- 6.2.1. Cardiology
- 6.2.2. Urology and Nephrology
- 6.2.3. Oncology
- 6.2.4. Gastroenterology
- 6.2.5. Other Applications
- 6.1. Market Analysis, Insights and Forecast - by Product
- 7. Europe Interventional Radiology Industry Analysis, Insights and Forecast, 2019-2031
- 7.1. Market Analysis, Insights and Forecast - by Product
- 7.1.1. MRI Systems
- 7.1.2. Ultrasound Imaging Systems
- 7.1.3. CT Scanners
- 7.1.4. Angiography Systems
- 7.1.5. Fluoroscopy Systems
- 7.1.6. Biopsy Devices
- 7.1.7. Other Products
- 7.2. Market Analysis, Insights and Forecast - by Application
- 7.2.1. Cardiology
- 7.2.2. Urology and Nephrology
- 7.2.3. Oncology
- 7.2.4. Gastroenterology
- 7.2.5. Other Applications
- 7.1. Market Analysis, Insights and Forecast - by Product
- 8. Asia Pacific Interventional Radiology Industry Analysis, Insights and Forecast, 2019-2031
- 8.1. Market Analysis, Insights and Forecast - by Product
- 8.1.1. MRI Systems
- 8.1.2. Ultrasound Imaging Systems
- 8.1.3. CT Scanners
- 8.1.4. Angiography Systems
- 8.1.5. Fluoroscopy Systems
- 8.1.6. Biopsy Devices
- 8.1.7. Other Products
- 8.2. Market Analysis, Insights and Forecast - by Application
- 8.2.1. Cardiology
- 8.2.2. Urology and Nephrology
- 8.2.3. Oncology
- 8.2.4. Gastroenterology
- 8.2.5. Other Applications
- 8.1. Market Analysis, Insights and Forecast - by Product
- 9. Middle East and Africa Interventional Radiology Industry Analysis, Insights and Forecast, 2019-2031
- 9.1. Market Analysis, Insights and Forecast - by Product
- 9.1.1. MRI Systems
- 9.1.2. Ultrasound Imaging Systems
- 9.1.3. CT Scanners
- 9.1.4. Angiography Systems
- 9.1.5. Fluoroscopy Systems
- 9.1.6. Biopsy Devices
- 9.1.7. Other Products
- 9.2. Market Analysis, Insights and Forecast - by Application
- 9.2.1. Cardiology
- 9.2.2. Urology and Nephrology
- 9.2.3. Oncology
- 9.2.4. Gastroenterology
- 9.2.5. Other Applications
- 9.1. Market Analysis, Insights and Forecast - by Product
- 10. South America Interventional Radiology Industry Analysis, Insights and Forecast, 2019-2031
- 10.1. Market Analysis, Insights and Forecast - by Product
- 10.1.1. MRI Systems
- 10.1.2. Ultrasound Imaging Systems
- 10.1.3. CT Scanners
- 10.1.4. Angiography Systems
- 10.1.5. Fluoroscopy Systems
- 10.1.6. Biopsy Devices
- 10.1.7. Other Products
- 10.2. Market Analysis, Insights and Forecast - by Application
- 10.2.1. Cardiology
- 10.2.2. Urology and Nephrology
- 10.2.3. Oncology
- 10.2.4. Gastroenterology
- 10.2.5. Other Applications
- 10.1. Market Analysis, Insights and Forecast - by Product
- 11. North America Interventional Radiology Industry Analysis, Insights and Forecast, 2019-2031
- 11.1. Market Analysis, Insights and Forecast - By Country/Sub-region
- 11.1.1 United States
- 11.1.2 Canada
- 11.1.3 Mexico
- 12. Europe Interventional Radiology Industry Analysis, Insights and Forecast, 2019-2031
- 12.1. Market Analysis, Insights and Forecast - By Country/Sub-region
- 12.1.1 Germany
- 12.1.2 United Kingdom
- 12.1.3 France
- 12.1.4 Italy
- 12.1.5 Spain
- 12.1.6 Rest of Europe
- 13. Asia Pacific Interventional Radiology Industry Analysis, Insights and Forecast, 2019-2031
- 13.1. Market Analysis, Insights and Forecast - By Country/Sub-region
- 13.1.1 China
- 13.1.2 Japan
- 13.1.3 India
- 13.1.4 Australia
- 13.1.5 South Korea
- 13.1.6 Rest of Asia Pacific
- 14. South America Interventional Radiology Industry Analysis, Insights and Forecast, 2019-2031
- 14.1. Market Analysis, Insights and Forecast - By Country/Sub-region
- 14.1.1 Brazil
- 14.1.2 Argentina
- 14.1.3 Rest of South America
- 15. Middle East and Africa Interventional Radiology Industry Analysis, Insights and Forecast, 2019-2031
- 15.1. Market Analysis, Insights and Forecast - By Country/Sub-region
- 15.1.1 GCC
- 15.1.2 South Africa
- 15.1.3 Rest of Middle East and Africa
- 16. Competitive Analysis
- 16.1. Global Market Share Analysis 2024
- 16.2. Company Profiles
- 16.2.1 Hologic Inc
- 16.2.1.1. Overview
- 16.2.1.2. Products
- 16.2.1.3. SWOT Analysis
- 16.2.1.4. Recent Developments
- 16.2.1.5. Financials (Based on Availability)
- 16.2.2 GE Healthcare
- 16.2.2.1. Overview
- 16.2.2.2. Products
- 16.2.2.3. SWOT Analysis
- 16.2.2.4. Recent Developments
- 16.2.2.5. Financials (Based on Availability)
- 16.2.3 Medtronic PLC
- 16.2.3.1. Overview
- 16.2.3.2. Products
- 16.2.3.3. SWOT Analysis
- 16.2.3.4. Recent Developments
- 16.2.3.5. Financials (Based on Availability)
- 16.2.4 Siemens Healthineers AG
- 16.2.4.1. Overview
- 16.2.4.2. Products
- 16.2.4.3. SWOT Analysis
- 16.2.4.4. Recent Developments
- 16.2.4.5. Financials (Based on Availability)
- 16.2.5 Carestream Health
- 16.2.5.1. Overview
- 16.2.5.2. Products
- 16.2.5.3. SWOT Analysis
- 16.2.5.4. Recent Developments
- 16.2.5.5. Financials (Based on Availability)
- 16.2.6 Koninklijke Philips NV
- 16.2.6.1. Overview
- 16.2.6.2. Products
- 16.2.6.3. SWOT Analysis
- 16.2.6.4. Recent Developments
- 16.2.6.5. Financials (Based on Availability)
- 16.2.7 Canon Medical Systems Corporation
- 16.2.7.1. Overview
- 16.2.7.2. Products
- 16.2.7.3. SWOT Analysis
- 16.2.7.4. Recent Developments
- 16.2.7.5. Financials (Based on Availability)
- 16.2.8 Cook Medical
- 16.2.8.1. Overview
- 16.2.8.2. Products
- 16.2.8.3. SWOT Analysis
- 16.2.8.4. Recent Developments
- 16.2.8.5. Financials (Based on Availability)
- 16.2.9 Esaote SPA
- 16.2.9.1. Overview
- 16.2.9.2. Products
- 16.2.9.3. SWOT Analysis
- 16.2.9.4. Recent Developments
- 16.2.9.5. Financials (Based on Availability)
- 16.2.10 Shimadzu Corporation
- 16.2.10.1. Overview
- 16.2.10.2. Products
- 16.2.10.3. SWOT Analysis
- 16.2.10.4. Recent Developments
- 16.2.10.5. Financials (Based on Availability)
- 16.2.11 Samsung Medison (Samsung Electronics Co Ltd)
- 16.2.11.1. Overview
- 16.2.11.2. Products
- 16.2.11.3. SWOT Analysis
- 16.2.11.4. Recent Developments
- 16.2.11.5. Financials (Based on Availability)
- 16.2.12 Fujifilm Holdings Corporation
- 16.2.12.1. Overview
- 16.2.12.2. Products
- 16.2.12.3. SWOT Analysis
- 16.2.12.4. Recent Developments
- 16.2.12.5. Financials (Based on Availability)
- 16.2.1 Hologic Inc
List of Figures
- Figure 1: Global Interventional Radiology Industry Revenue Breakdown (Million, %) by Region 2024 & 2032
- Figure 2: North America Interventional Radiology Industry Revenue (Million), by Country 2024 & 2032
- Figure 3: North America Interventional Radiology Industry Revenue Share (%), by Country 2024 & 2032
- Figure 4: Europe Interventional Radiology Industry Revenue (Million), by Country 2024 & 2032
- Figure 5: Europe Interventional Radiology Industry Revenue Share (%), by Country 2024 & 2032
- Figure 6: Asia Pacific Interventional Radiology Industry Revenue (Million), by Country 2024 & 2032
- Figure 7: Asia Pacific Interventional Radiology Industry Revenue Share (%), by Country 2024 & 2032
- Figure 8: South America Interventional Radiology Industry Revenue (Million), by Country 2024 & 2032
- Figure 9: South America Interventional Radiology Industry Revenue Share (%), by Country 2024 & 2032
- Figure 10: Middle East and Africa Interventional Radiology Industry Revenue (Million), by Country 2024 & 2032
- Figure 11: Middle East and Africa Interventional Radiology Industry Revenue Share (%), by Country 2024 & 2032
- Figure 12: North America Interventional Radiology Industry Revenue (Million), by Product 2024 & 2032
- Figure 13: North America Interventional Radiology Industry Revenue Share (%), by Product 2024 & 2032
- Figure 14: North America Interventional Radiology Industry Revenue (Million), by Application 2024 & 2032
- Figure 15: North America Interventional Radiology Industry Revenue Share (%), by Application 2024 & 2032
- Figure 16: North America Interventional Radiology Industry Revenue (Million), by Country 2024 & 2032
- Figure 17: North America Interventional Radiology Industry Revenue Share (%), by Country 2024 & 2032
- Figure 18: Europe Interventional Radiology Industry Revenue (Million), by Product 2024 & 2032
- Figure 19: Europe Interventional Radiology Industry Revenue Share (%), by Product 2024 & 2032
- Figure 20: Europe Interventional Radiology Industry Revenue (Million), by Application 2024 & 2032
- Figure 21: Europe Interventional Radiology Industry Revenue Share (%), by Application 2024 & 2032
- Figure 22: Europe Interventional Radiology Industry Revenue (Million), by Country 2024 & 2032
- Figure 23: Europe Interventional Radiology Industry Revenue Share (%), by Country 2024 & 2032
- Figure 24: Asia Pacific Interventional Radiology Industry Revenue (Million), by Product 2024 & 2032
- Figure 25: Asia Pacific Interventional Radiology Industry Revenue Share (%), by Product 2024 & 2032
- Figure 26: Asia Pacific Interventional Radiology Industry Revenue (Million), by Application 2024 & 2032
- Figure 27: Asia Pacific Interventional Radiology Industry Revenue Share (%), by Application 2024 & 2032
- Figure 28: Asia Pacific Interventional Radiology Industry Revenue (Million), by Country 2024 & 2032
- Figure 29: Asia Pacific Interventional Radiology Industry Revenue Share (%), by Country 2024 & 2032
- Figure 30: Middle East and Africa Interventional Radiology Industry Revenue (Million), by Product 2024 & 2032
- Figure 31: Middle East and Africa Interventional Radiology Industry Revenue Share (%), by Product 2024 & 2032
- Figure 32: Middle East and Africa Interventional Radiology Industry Revenue (Million), by Application 2024 & 2032
- Figure 33: Middle East and Africa Interventional Radiology Industry Revenue Share (%), by Application 2024 & 2032
- Figure 34: Middle East and Africa Interventional Radiology Industry Revenue (Million), by Country 2024 & 2032
- Figure 35: Middle East and Africa Interventional Radiology Industry Revenue Share (%), by Country 2024 & 2032
- Figure 36: South America Interventional Radiology Industry Revenue (Million), by Product 2024 & 2032
- Figure 37: South America Interventional Radiology Industry Revenue Share (%), by Product 2024 & 2032
- Figure 38: South America Interventional Radiology Industry Revenue (Million), by Application 2024 & 2032
- Figure 39: South America Interventional Radiology Industry Revenue Share (%), by Application 2024 & 2032
- Figure 40: South America Interventional Radiology Industry Revenue (Million), by Country 2024 & 2032
- Figure 41: South America Interventional Radiology Industry Revenue Share (%), by Country 2024 & 2032
List of Tables
- Table 1: Global Interventional Radiology Industry Revenue Million Forecast, by Region 2019 & 2032
- Table 2: Global Interventional Radiology Industry Revenue Million Forecast, by Product 2019 & 2032
- Table 3: Global Interventional Radiology Industry Revenue Million Forecast, by Application 2019 & 2032
- Table 4: Global Interventional Radiology Industry Revenue Million Forecast, by Region 2019 & 2032
- Table 5: Global Interventional Radiology Industry Revenue Million Forecast, by Country 2019 & 2032
- Table 6: United States Interventional Radiology Industry Revenue (Million) Forecast, by Application 2019 & 2032
- Table 7: Canada Interventional Radiology Industry Revenue (Million) Forecast, by Application 2019 & 2032
- Table 8: Mexico Interventional Radiology Industry Revenue (Million) Forecast, by Application 2019 & 2032
- Table 9: Global Interventional Radiology Industry Revenue Million Forecast, by Country 2019 & 2032
- Table 10: Germany Interventional Radiology Industry Revenue (Million) Forecast, by Application 2019 & 2032
- Table 11: United Kingdom Interventional Radiology Industry Revenue (Million) Forecast, by Application 2019 & 2032
- Table 12: France Interventional Radiology Industry Revenue (Million) Forecast, by Application 2019 & 2032
- Table 13: Italy Interventional Radiology Industry Revenue (Million) Forecast, by Application 2019 & 2032
- Table 14: Spain Interventional Radiology Industry Revenue (Million) Forecast, by Application 2019 & 2032
- Table 15: Rest of Europe Interventional Radiology Industry Revenue (Million) Forecast, by Application 2019 & 2032
- Table 16: Global Interventional Radiology Industry Revenue Million Forecast, by Country 2019 & 2032
- Table 17: China Interventional Radiology Industry Revenue (Million) Forecast, by Application 2019 & 2032
- Table 18: Japan Interventional Radiology Industry Revenue (Million) Forecast, by Application 2019 & 2032
- Table 19: India Interventional Radiology Industry Revenue (Million) Forecast, by Application 2019 & 2032
- Table 20: Australia Interventional Radiology Industry Revenue (Million) Forecast, by Application 2019 & 2032
- Table 21: South Korea Interventional Radiology Industry Revenue (Million) Forecast, by Application 2019 & 2032
- Table 22: Rest of Asia Pacific Interventional Radiology Industry Revenue (Million) Forecast, by Application 2019 & 2032
- Table 23: Global Interventional Radiology Industry Revenue Million Forecast, by Country 2019 & 2032
- Table 24: Brazil Interventional Radiology Industry Revenue (Million) Forecast, by Application 2019 & 2032
- Table 25: Argentina Interventional Radiology Industry Revenue (Million) Forecast, by Application 2019 & 2032
- Table 26: Rest of South America Interventional Radiology Industry Revenue (Million) Forecast, by Application 2019 & 2032
- Table 27: Global Interventional Radiology Industry Revenue Million Forecast, by Country 2019 & 2032
- Table 28: GCC Interventional Radiology Industry Revenue (Million) Forecast, by Application 2019 & 2032
- Table 29: South Africa Interventional Radiology Industry Revenue (Million) Forecast, by Application 2019 & 2032
- Table 30: Rest of Middle East and Africa Interventional Radiology Industry Revenue (Million) Forecast, by Application 2019 & 2032
- Table 31: Global Interventional Radiology Industry Revenue Million Forecast, by Product 2019 & 2032
- Table 32: Global Interventional Radiology Industry Revenue Million Forecast, by Application 2019 & 2032
- Table 33: Global Interventional Radiology Industry Revenue Million Forecast, by Country 2019 & 2032
- Table 34: United States Interventional Radiology Industry Revenue (Million) Forecast, by Application 2019 & 2032
- Table 35: Canada Interventional Radiology Industry Revenue (Million) Forecast, by Application 2019 & 2032
- Table 36: Mexico Interventional Radiology Industry Revenue (Million) Forecast, by Application 2019 & 2032
- Table 37: Global Interventional Radiology Industry Revenue Million Forecast, by Product 2019 & 2032
- Table 38: Global Interventional Radiology Industry Revenue Million Forecast, by Application 2019 & 2032
- Table 39: Global Interventional Radiology Industry Revenue Million Forecast, by Country 2019 & 2032
- Table 40: Germany Interventional Radiology Industry Revenue (Million) Forecast, by Application 2019 & 2032
- Table 41: United Kingdom Interventional Radiology Industry Revenue (Million) Forecast, by Application 2019 & 2032
- Table 42: France Interventional Radiology Industry Revenue (Million) Forecast, by Application 2019 & 2032
- Table 43: Italy Interventional Radiology Industry Revenue (Million) Forecast, by Application 2019 & 2032
- Table 44: Spain Interventional Radiology Industry Revenue (Million) Forecast, by Application 2019 & 2032
- Table 45: Rest of Europe Interventional Radiology Industry Revenue (Million) Forecast, by Application 2019 & 2032
- Table 46: Global Interventional Radiology Industry Revenue Million Forecast, by Product 2019 & 2032
- Table 47: Global Interventional Radiology Industry Revenue Million Forecast, by Application 2019 & 2032
- Table 48: Global Interventional Radiology Industry Revenue Million Forecast, by Country 2019 & 2032
- Table 49: China Interventional Radiology Industry Revenue (Million) Forecast, by Application 2019 & 2032
- Table 50: Japan Interventional Radiology Industry Revenue (Million) Forecast, by Application 2019 & 2032
- Table 51: India Interventional Radiology Industry Revenue (Million) Forecast, by Application 2019 & 2032
- Table 52: Australia Interventional Radiology Industry Revenue (Million) Forecast, by Application 2019 & 2032
- Table 53: South Korea Interventional Radiology Industry Revenue (Million) Forecast, by Application 2019 & 2032
- Table 54: Rest of Asia Pacific Interventional Radiology Industry Revenue (Million) Forecast, by Application 2019 & 2032
- Table 55: Global Interventional Radiology Industry Revenue Million Forecast, by Product 2019 & 2032
- Table 56: Global Interventional Radiology Industry Revenue Million Forecast, by Application 2019 & 2032
- Table 57: Global Interventional Radiology Industry Revenue Million Forecast, by Country 2019 & 2032
- Table 58: GCC Interventional Radiology Industry Revenue (Million) Forecast, by Application 2019 & 2032
- Table 59: South Africa Interventional Radiology Industry Revenue (Million) Forecast, by Application 2019 & 2032
- Table 60: Rest of Middle East and Africa Interventional Radiology Industry Revenue (Million) Forecast, by Application 2019 & 2032
- Table 61: Global Interventional Radiology Industry Revenue Million Forecast, by Product 2019 & 2032
- Table 62: Global Interventional Radiology Industry Revenue Million Forecast, by Application 2019 & 2032
- Table 63: Global Interventional Radiology Industry Revenue Million Forecast, by Country 2019 & 2032
- Table 64: Brazil Interventional Radiology Industry Revenue (Million) Forecast, by Application 2019 & 2032
- Table 65: Argentina Interventional Radiology Industry Revenue (Million) Forecast, by Application 2019 & 2032
- Table 66: Rest of South America Interventional Radiology Industry Revenue (Million) Forecast, by Application 2019 & 2032
Frequently Asked Questions
1. What is the projected Compound Annual Growth Rate (CAGR) of the Interventional Radiology Industry?
The projected CAGR is approximately 5.90%.
2. Which companies are prominent players in the Interventional Radiology Industry?
Key companies in the market include Hologic Inc, GE Healthcare, Medtronic PLC, Siemens Healthineers AG, Carestream Health, Koninklijke Philips NV, Canon Medical Systems Corporation, Cook Medical, Esaote SPA, Shimadzu Corporation, Samsung Medison (Samsung Electronics Co Ltd), Fujifilm Holdings Corporation.
3. What are the main segments of the Interventional Radiology Industry?
The market segments include Product, Application.
4. Can you provide details about the market size?
The market size is estimated to be USD 26.96 Million as of 2022.
5. What are some drivers contributing to market growth?
Increasing Burden of Chronic Diseases; Technological Advancements in Interventional Radiology Devices.
6. What are the notable trends driving market growth?
The Cardiology Application is Expected to Witness High Growth Over the Forecast Period.
7. Are there any restraints impacting market growth?
Risk of High Radiation Exposure; High Cost of Equipment.
8. Can you provide examples of recent developments in the market?
November 2022: Konica Minolta Healthcare Americas launched a new point-of-care ultrasound system called Sonimage MX1 Platinum.
9. What pricing options are available for accessing the report?
Pricing options include single-user, multi-user, and enterprise licenses priced at USD 4750, USD 5250, and USD 8750 respectively.
10. Is the market size provided in terms of value or volume?
The market size is provided in terms of value, measured in Million.
11. Are there any specific market keywords associated with the report?
Yes, the market keyword associated with the report is "Interventional Radiology Industry," which aids in identifying and referencing the specific market segment covered.
12. How do I determine which pricing option suits my needs best?
The pricing options vary based on user requirements and access needs. Individual users may opt for single-user licenses, while businesses requiring broader access may choose multi-user or enterprise licenses for cost-effective access to the report.
13. Are there any additional resources or data provided in the Interventional Radiology Industry report?
While the report offers comprehensive insights, it's advisable to review the specific contents or supplementary materials provided to ascertain if additional resources or data are available.
14. How can I stay updated on further developments or reports in the Interventional Radiology Industry?
To stay informed about further developments, trends, and reports in the Interventional Radiology Industry, consider subscribing to industry newsletters, following relevant companies and organizations, or regularly checking reputable industry news sources and publications.
Methodology
Step 1 - Identification of Relevant Samples Size from Population Database


Step 2 - Approaches for Defining Global Market Size (Value, Volume* & Price*)

Note*: In applicable scenarios
Step 3 - Data Sources
Primary Research
- Web Analytics
- Survey Reports
- Research Institute
- Latest Research Reports
- Opinion Leaders
Secondary Research
- Annual Reports
- White Paper
- Latest Press Release
- Industry Association
- Paid Database
- Investor Presentations

Step 4 - Data Triangulation
Involves using different sources of information in order to increase the validity of a study
These sources are likely to be stakeholders in a program - participants, other researchers, program staff, other community members, and so on.
Then we put all data in single framework & apply various statistical tools to find out the dynamic on the market.
During the analysis stage, feedback from the stakeholder groups would be compared to determine areas of agreement as well as areas of divergence


