

Key Insights
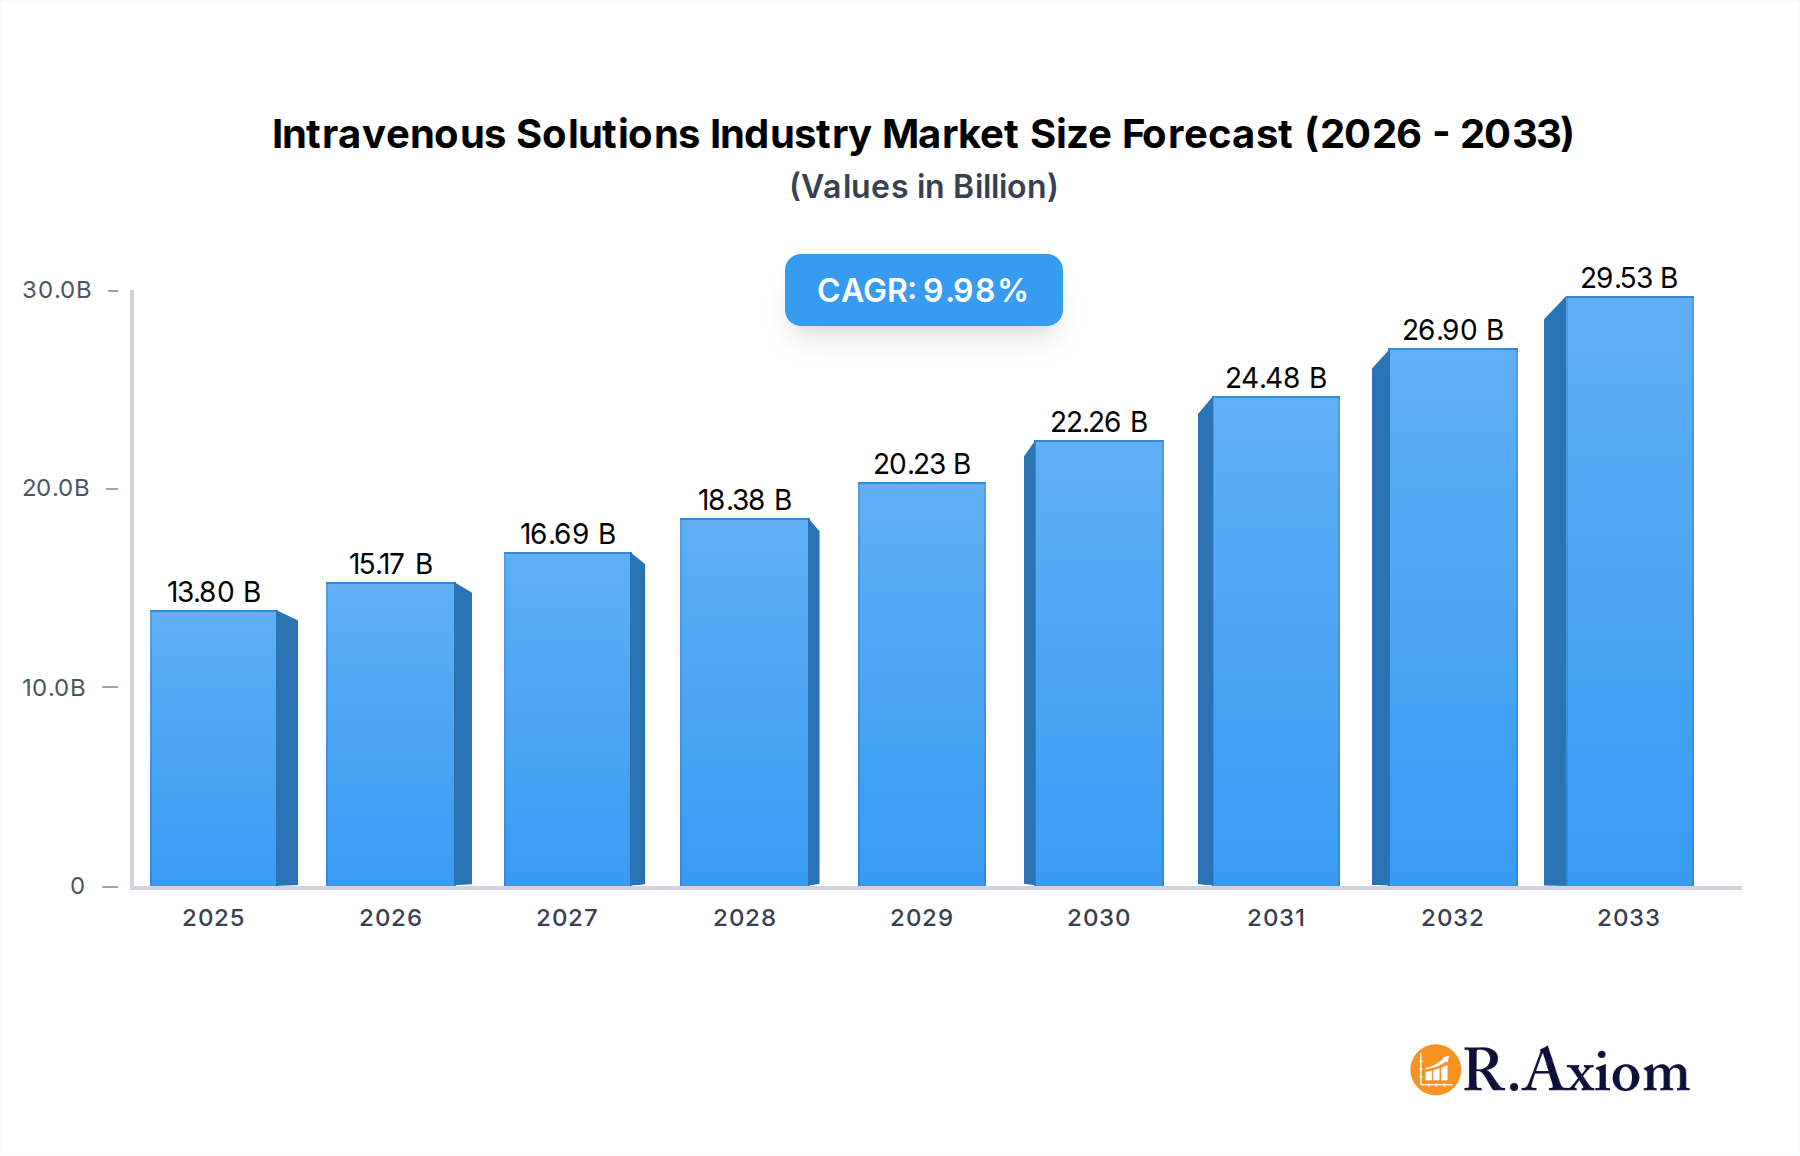
The global Intravenous Solutions market is poised for substantial expansion, projected to reach an estimated $13.8 billion in 2025. This robust growth is underpinned by a compelling Compound Annual Growth Rate (CAGR) of 9.57% from 2019 to 2033, indicating sustained momentum. Key drivers fueling this upward trajectory include the increasing prevalence of chronic diseases, a growing elderly population with higher healthcare needs, and advancements in parenteral nutrition formulations. The rising demand for specialized nutritional support in critical care settings, coupled with a greater awareness of the benefits of early nutritional intervention, are further propelling market expansion. Furthermore, the ongoing development of novel drug delivery systems and the expanding applications of intravenous solutions in various therapeutic areas are contributing significantly to market dynamism. The market is segmented into Total Parenteral Nutrition (TPN) and Peripheral Parenteral Nutrition (PPN), with TPN segments expected to dominate due to its critical role in managing complex nutritional deficiencies and severe illnesses.

Intravenous Solutions Industry Market Size (In Billion)
The Intravenous Solutions market is experiencing significant trends, including a surge in demand for customized parenteral nutrition solutions tailored to individual patient needs, and the growing adoption of pre-mixed and ready-to-use IV solutions to enhance efficiency and reduce medication errors in healthcare facilities. Innovations in solution composition, such as the development of lipid-based nutrient emulsions and specialized amino acid profiles, are catering to evolving clinical requirements. However, the market faces certain restraints, including stringent regulatory frameworks governing the approval and manufacturing of IV solutions, and the potential for supply chain disruptions. Despite these challenges, the market's growth potential remains strong, driven by continuous research and development efforts by leading companies like Baxter International, Fresenius Kabi AG, and B. Braun Melsungen AG, alongside expanding healthcare infrastructure, particularly in the Asia Pacific and Rest of Europe regions.
Intravenous Solutions Industry Company Market Share
Intravenous Solutions Industry Market Concentration & Innovation
The intravenous solutions market is characterized by a moderate to high level of concentration, with a few key players holding significant market share. Global market share is dominated by a mix of established pharmaceutical giants and specialized medical device manufacturers. Major companies such as Baxter International, Fresenius Kabi AG, Grifols, and B. Braun Melsungen AG command substantial portions of the market due to their extensive product portfolios, robust distribution networks, and strong brand recognition. Innovation is a critical driver, fueled by the increasing demand for specialized formulations, improved delivery systems, and enhanced patient safety features. Regulatory frameworks, particularly stringent FDA and EMA approvals, play a pivotal role in shaping innovation and market entry. Product substitutes, while limited for core IV solutions, exist in the form of alternative fluid therapies or drug delivery methods in specific clinical scenarios. End-user trends are leaning towards more personalized nutrition solutions and advanced infusion technologies for home healthcare. Mergers and acquisitions (M&A) activities, with deal values often in the hundreds of billions, are common as larger companies seek to expand their product offerings, geographic reach, and technological capabilities. Recent M&A activities indicate a strategic consolidation aimed at achieving economies of scale and addressing evolving healthcare needs. The market is projected to witness continued strategic alliances and acquisitions to fortify market positions and drive future growth, with an estimated xx billion in M&A deal value during the forecast period.
Intravenous Solutions Industry Industry Trends & Insights
The global intravenous solutions market is experiencing robust growth, driven by a confluence of factors that are reshaping healthcare delivery and patient care. The Compound Annual Growth Rate (CAGR) for the forecast period is estimated at xx%, indicating a significant expansion in market value, projected to reach over xxx billion by 2033. This expansion is propelled by the increasing global prevalence of chronic diseases such as diabetes, cardiovascular disorders, and cancer, all of which often require intravenous fluid and nutrient management. Furthermore, the rising aging population worldwide significantly contributes to the demand for IV solutions, as elderly individuals are more susceptible to conditions requiring this form of therapy. Technological disruptions are playing a transformative role. The development of advanced infusion pumps with smart monitoring capabilities, automated dosage adjustments, and remote patient monitoring features is enhancing treatment efficacy and patient safety. The integration of nanotechnology for targeted drug delivery within IV solutions is another emerging frontier. Consumer preferences are evolving towards more convenient and less invasive treatment options. This is evidenced by the growing demand for home healthcare services, which in turn fuels the need for a steady supply of IV solutions and associated administration devices that can be safely used outside traditional hospital settings. The competitive dynamics are intense, with established players continuously innovating to maintain market leadership and new entrants striving to carve out niche markets. The focus on cost-effectiveness and value-based healthcare is also influencing market strategies, pushing manufacturers to develop efficient production processes and high-quality, affordable solutions. Market penetration is expected to deepen across both developed and emerging economies, with significant growth opportunities in regions with expanding healthcare infrastructure and increasing access to medical treatments. The ongoing shift towards evidence-based medicine and personalized treatment plans further emphasizes the need for a diverse and sophisticated range of intravenous solutions to meet specific patient needs. The market penetration is expected to reach xx% by 2033.
Dominant Markets & Segments in Intravenous Solutions Industry
The intravenous solutions market exhibits distinct dominance across various geographical regions and product segments, reflecting differing healthcare needs, economic development, and regulatory environments.
Leading Region: North America currently holds a dominant position in the global intravenous solutions market, estimated at over xx billion in 2025.
- Key Drivers:
- Advanced Healthcare Infrastructure: The presence of well-established hospitals, clinics, and research institutions with state-of-the-art technology supports high utilization of IV therapies.
- High Incidence of Chronic Diseases: A significant patient population suffering from chronic conditions necessitates regular and specialized IV fluid management.
- Robust Research & Development: Continuous investment in pharmaceutical and medical device R&D fosters the development and adoption of innovative IV solutions.
- Favorable Reimbursement Policies: Generally robust insurance coverage and reimbursement frameworks encourage the use of advanced medical treatments, including intravenous therapies.
Dominant Segment by Type: Total Parenteral Nutrition (TPN) is a significant and growing segment, valued at approximately xx billion in 2025.
- Key Drivers:
- Increasing Patient Population Requiring Nutritional Support: A rise in individuals unable to absorb nutrients orally due to gastrointestinal disorders, critical illnesses, or post-surgery recovery drives TPN demand.
- Advancements in Formulations: Development of more complex and customized TPN formulations catering to specific nutritional and metabolic needs.
- Home TPN Programs: Expansion of homecare services allows patients to receive TPN at home, increasing convenience and reducing hospital stays.
Dominant Segment by Solution Composition: Saline solutions, particularly 0.9% Sodium Chloride, remain the most widely used and a foundational component of the IV solutions market, projected to be worth xx billion in 2025.
- Key Drivers:
- Universality in Hydration and Electrolyte Balance: Saline is a cornerstone for fluid replacement, electrolyte correction, and as a diluent for various medications.
- Cost-Effectiveness and Availability: Its low cost of production and widespread availability make it the first-line choice in numerous clinical settings.
- Established Safety Profile: Decades of use have established a well-understood safety profile, making it a reliable choice for healthcare professionals.
The dominance of these segments and regions is underpinned by strong economic policies that support healthcare investment, robust supply chain infrastructure ensuring product availability, and a continuous focus on improving patient outcomes through effective and accessible intravenous therapies.
Intravenous Solutions Industry Product Developments
The intravenous solutions market is witnessing a surge in product innovations aimed at enhancing therapeutic efficacy, patient safety, and delivery convenience. Companies are developing advanced formulations for specialized nutrition, incorporating micronutrients and amino acids tailored for specific patient conditions. Innovations in infusion technology are leading to smarter, more user-friendly administration sets and pumps, featuring automated features and improved connectivity for better monitoring. Competitive advantages are being gained through the development of solutions with extended shelf lives, improved stability, and reduced risk of contamination. The market fit for these products is driven by the increasing demand for personalized medicine and the growing trend towards home-based healthcare, where efficacy and ease of use are paramount.
Report Scope & Segmentation Analysis
This report provides a comprehensive analysis of the global intravenous solutions market, segmented by Type and Solution Composition. The market segmentation includes:
By Type:
- Total Parenteral Nutrition (TPN): This segment focuses on complete nutritional support delivered intravenously, crucial for patients unable to obtain adequate nutrition through oral or enteral routes. The market size for TPN is projected to reach xx billion by 2033, driven by increasing incidences of malabsorption disorders and critical illnesses.
- Peripheral Parenteral Nutrition (PPN): PPN provides partial nutritional support through peripheral veins. While smaller than TPN, it serves a vital role in bridging nutritional gaps. This segment is expected to grow to xx billion by 2033.
By Solution Composition:
- Saline: Comprising essential electrolytes, saline solutions remain a fundamental component for hydration and as a vehicle for drug delivery. This segment is estimated to reach xx billion by 2033 due to its widespread use.
- Carbohydrates: Primarily dextrose, these solutions provide energy for patients. This segment is projected to grow to xx billion by 2033, supporting metabolic needs.
- Vitamins and Minerals: These are often added to basic solutions to address specific deficiencies or support metabolic processes. The market for these specialized additives is expected to reach xx billion by 2033.
- Other Solution Compositions: This broad category includes specialized solutions, drug admixtures, and other therapeutic fluids. This segment is projected to expand to xx billion by 2033, reflecting the growing diversity of IV therapies.
Key Drivers of Intravenous Solutions Industry Growth
Several key factors are propelling the growth of the intravenous solutions industry. Technologically, advancements in infusion technology, such as smart pumps and advanced drug delivery systems, are enhancing patient safety and treatment efficacy, leading to increased adoption. Economically, rising healthcare expenditures globally, particularly in emerging economies with expanding healthcare access, are creating a larger patient pool requiring IV therapies. Regulatory factors, while sometimes a barrier, also drive growth by mandating higher standards for product quality and safety, thus fostering innovation and the development of superior solutions. The increasing prevalence of chronic diseases like diabetes, cancer, and cardiovascular ailments necessitates long-term and critical care, often involving extensive use of IV solutions. Furthermore, the burgeoning home healthcare market is a significant driver, as it requires convenient and safe IV delivery systems for patient comfort and reduced hospital burden.
Challenges in the Intravenous Solutions Industry Sector
Despite robust growth, the intravenous solutions industry faces several significant challenges. Regulatory hurdles, including stringent approval processes and evolving compliance standards from bodies like the FDA and EMA, can lead to lengthy development timelines and increased costs for new products. Supply chain disruptions, exacerbated by geopolitical events, natural disasters, and raw material availability issues, pose a constant threat to production and distribution, potentially leading to shortages. Intense competitive pressures from both established global players and emerging regional manufacturers can lead to price erosion and impact profit margins. Furthermore, the threat of counterfeit products entering the market compromises patient safety and brand reputation, requiring continuous vigilance and robust security measures. The increasing emphasis on cost containment within healthcare systems also puts pressure on manufacturers to deliver high-quality solutions at competitive price points.
Emerging Opportunities in Intravenous Solutions Industry
The intravenous solutions industry is ripe with emerging opportunities. The growing demand for personalized medicine presents a significant avenue for developing customized IV formulations tailored to individual patient needs, genetic profiles, and specific disease states. Advancements in nanotechnology offer potential for developing novel drug delivery systems integrated into IV solutions for targeted therapies and improved bioavailability. The expanding home healthcare market, driven by patient preference and cost-effectiveness, creates a substantial opportunity for the development of user-friendly, portable, and smart IV infusion devices and solutions. Furthermore, the burgeoning markets in developing economies, with their increasing healthcare investments and improving access to medical services, represent untapped potential for market penetration and growth. The development of bio-compatible and biodegradable IV components also presents an environmentally conscious opportunity.
Leading Players in the Intravenous Solutions Industry Market
- Ajinomoto
- ICU Medical Inc
- Grifols
- Omnicare
- Fresenius Kabi AG
- Anhui Medipharm Co Ltd
- Wuhan Uni-Pharma Bio-Tech Co Ltd
- B Braun Melsungen AG
- Vifor Pharma
- Baxter International
Key Developments in Intravenous Solutions Industry Industry
- February 2022: B. Braun Medical received the US FDA approval to begin operations at its new IV saline solution manufacturing facility in Daytona Beach, Florida, significantly boosting its production capacity and supply chain resilience.
- September 2021: B. Braun Medical Inc. launched CARESAFE IV Administration Sets with an Optional AirStop component, enhancing patient safety by minimizing the risk of air embolism during infusions.
Strategic Outlook for Intravenous Solutions Industry Market
The strategic outlook for the intravenous solutions industry is highly optimistic, driven by sustained demand from aging populations and the increasing burden of chronic diseases globally. Future growth catalysts lie in the continued innovation of specialized nutritional formulations and advanced drug delivery systems. The expansion of home healthcare services will necessitate the development of more integrated and user-friendly IV therapy solutions. Furthermore, strategic collaborations and acquisitions will continue to be key strategies for market players to broaden their portfolios, enhance technological capabilities, and expand their geographic reach, particularly in emerging markets. The industry is poised for significant expansion, with an estimated market value reaching over xxx billion by 2033, fueled by a commitment to patient-centric care and technological advancements.
Intravenous Solutions Industry Segmentation
-
1. Type
- 1.1. Total Parenteral Nutrition
- 1.2. Peripheral Parenteral Nutrition
-
2. Solution Composition
- 2.1. Saline
- 2.2. Carbohydrates
- 2.3. Vitamins and Minerals
- 2.4. Other Solution Compositions
Intravenous Solutions Industry Segmentation By Geography
-
1. North America
- 1.1. United States
- 1.2. Canada
- 1.3. Mexico
-
2. Europe
- 2.1. Germany
- 2.2. United Kingdom
- 2.3. France
- 2.4. Italy
- 2.5. Spain
- 2.6. Rest of Europe
-
3. Asia Pacific
- 3.1. China
- 3.2. Japan
- 3.3. India
- 3.4. Australia
- 3.5. South Korea
- 3.6. Rest of Asia Pacific
-
4. Middle East and Africa
- 4.1. GCC
- 4.2. South Africa
- 4.3. Rest of Middle East and Africa
-
5. South America
- 5.1. Brazil
- 5.2. Argentina
- 5.3. Rest of South America
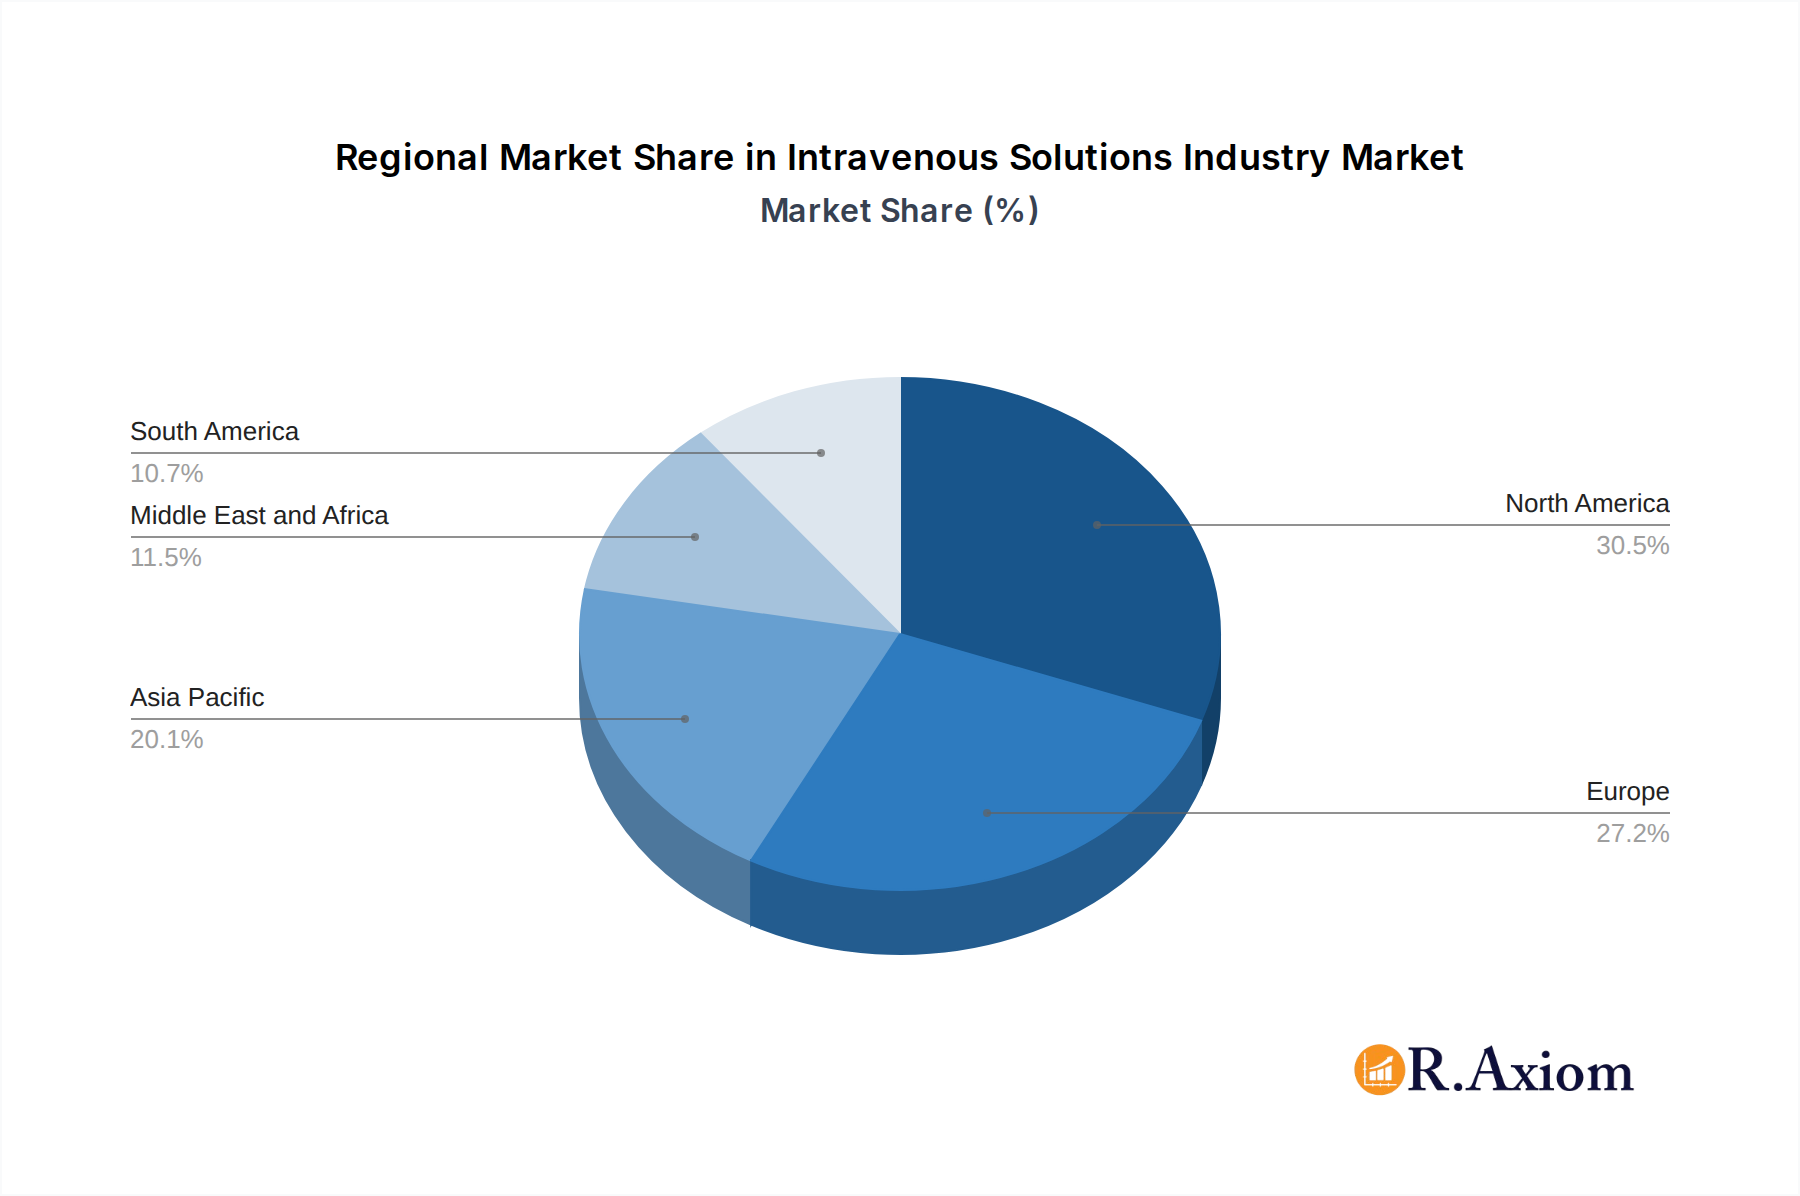
Intravenous Solutions Industry Regional Market Share
Geographic Coverage of Intravenous Solutions Industry
Intravenous Solutions Industry REPORT HIGHLIGHTS
| Aspects | Details |
|---|---|
| Study Period | 2020-2034 |
| Base Year | 2025 |
| Estimated Year | 2026 |
| Forecast Period | 2026-2034 |
| Historical Period | 2020-2025 |
| Growth Rate | CAGR of 9.57% from 2020-2034 |
| Segmentation |
|
Table of Contents
- 1. Introduction
- 1.1. Research Scope
- 1.2. Market Segmentation
- 1.3. Research Objective
- 1.4. Definitions and Assumptions
- 2. Executive Summary
- 2.1. Market Snapshot
- 3. Market Dynamics
- 3.1. Market Drivers
- 3.2. Market Restrains
- 3.3. Market Trends
- 3.4. Market Opportunities
- 4. Market Factor Analysis
- 4.1. Porters Five Forces
- 4.1.1. Bargaining Power of Suppliers
- 4.1.2. Bargaining Power of Buyers
- 4.1.3. Threat of New Entrants
- 4.1.4. Threat of Substitutes
- 4.1.5. Competitive Rivalry
- 4.2. PESTEL analysis
- 4.3. BCG Analysis
- 4.3.1. Stars (High Growth, High Market Share)
- 4.3.2. Cash Cows (Low Growth, High Market Share)
- 4.3.3. Question Mark (High Growth, Low Market Share)
- 4.3.4. Dogs (Low Growth, Low Market Share)
- 4.4. Ansoff Matrix Analysis
- 4.5. Supply Chain Analysis
- 4.6. Regulatory Landscape
- 4.7. Current Market Potential and Opportunity Assessment (TAM–SAM–SOM Framework)
- 4.8. RAX Analyst Note
- 4.1. Porters Five Forces
- 5. Market Analysis, Insights and Forecast 2021-2033
- 5.1. Market Analysis, Insights and Forecast - by Type
- 5.1.1. Total Parenteral Nutrition
- 5.1.2. Peripheral Parenteral Nutrition
- 5.2. Market Analysis, Insights and Forecast - by Solution Composition
- 5.2.1. Saline
- 5.2.2. Carbohydrates
- 5.2.3. Vitamins and Minerals
- 5.2.4. Other Solution Compositions
- 5.3. Market Analysis, Insights and Forecast - by Region
- 5.3.1. North America
- 5.3.2. Europe
- 5.3.3. Asia Pacific
- 5.3.4. Middle East and Africa
- 5.3.5. South America
- 5.1. Market Analysis, Insights and Forecast - by Type
- 6. Global Intravenous Solutions Industry Analysis, Insights and Forecast, 2021-2033
- 6.1. Market Analysis, Insights and Forecast - by Type
- 6.1.1. Total Parenteral Nutrition
- 6.1.2. Peripheral Parenteral Nutrition
- 6.2. Market Analysis, Insights and Forecast - by Solution Composition
- 6.2.1. Saline
- 6.2.2. Carbohydrates
- 6.2.3. Vitamins and Minerals
- 6.2.4. Other Solution Compositions
- 6.1. Market Analysis, Insights and Forecast - by Type
- 7. North America Intravenous Solutions Industry Analysis, Insights and Forecast, 2020-2032
- 7.1. Market Analysis, Insights and Forecast - by Type
- 7.1.1. Total Parenteral Nutrition
- 7.1.2. Peripheral Parenteral Nutrition
- 7.2. Market Analysis, Insights and Forecast - by Solution Composition
- 7.2.1. Saline
- 7.2.2. Carbohydrates
- 7.2.3. Vitamins and Minerals
- 7.2.4. Other Solution Compositions
- 7.1. Market Analysis, Insights and Forecast - by Type
- 8. Europe Intravenous Solutions Industry Analysis, Insights and Forecast, 2020-2032
- 8.1. Market Analysis, Insights and Forecast - by Type
- 8.1.1. Total Parenteral Nutrition
- 8.1.2. Peripheral Parenteral Nutrition
- 8.2. Market Analysis, Insights and Forecast - by Solution Composition
- 8.2.1. Saline
- 8.2.2. Carbohydrates
- 8.2.3. Vitamins and Minerals
- 8.2.4. Other Solution Compositions
- 8.1. Market Analysis, Insights and Forecast - by Type
- 9. Asia Pacific Intravenous Solutions Industry Analysis, Insights and Forecast, 2020-2032
- 9.1. Market Analysis, Insights and Forecast - by Type
- 9.1.1. Total Parenteral Nutrition
- 9.1.2. Peripheral Parenteral Nutrition
- 9.2. Market Analysis, Insights and Forecast - by Solution Composition
- 9.2.1. Saline
- 9.2.2. Carbohydrates
- 9.2.3. Vitamins and Minerals
- 9.2.4. Other Solution Compositions
- 9.1. Market Analysis, Insights and Forecast - by Type
- 10. Middle East and Africa Intravenous Solutions Industry Analysis, Insights and Forecast, 2020-2032
- 10.1. Market Analysis, Insights and Forecast - by Type
- 10.1.1. Total Parenteral Nutrition
- 10.1.2. Peripheral Parenteral Nutrition
- 10.2. Market Analysis, Insights and Forecast - by Solution Composition
- 10.2.1. Saline
- 10.2.2. Carbohydrates
- 10.2.3. Vitamins and Minerals
- 10.2.4. Other Solution Compositions
- 10.1. Market Analysis, Insights and Forecast - by Type
- 11. South America Intravenous Solutions Industry Analysis, Insights and Forecast, 2020-2032
- 11.1. Market Analysis, Insights and Forecast - by Type
- 11.1.1. Total Parenteral Nutrition
- 11.1.2. Peripheral Parenteral Nutrition
- 11.2. Market Analysis, Insights and Forecast - by Solution Composition
- 11.2.1. Saline
- 11.2.2. Carbohydrates
- 11.2.3. Vitamins and Minerals
- 11.2.4. Other Solution Compositions
- 11.1. Market Analysis, Insights and Forecast - by Type
- 12. Competitive Analysis
- 12.1. Company Profiles
- 12.1.1 Ajinomoto
- 12.1.1.1. Company Overview
- 12.1.1.2. Products
- 12.1.1.3. Company Financials
- 12.1.1.4. SWOT Analysis
- 12.1.2 ICU Medical Inc
- 12.1.2.1. Company Overview
- 12.1.2.2. Products
- 12.1.2.3. Company Financials
- 12.1.2.4. SWOT Analysis
- 12.1.3 Grifols
- 12.1.3.1. Company Overview
- 12.1.3.2. Products
- 12.1.3.3. Company Financials
- 12.1.3.4. SWOT Analysis
- 12.1.4 Omnicare
- 12.1.4.1. Company Overview
- 12.1.4.2. Products
- 12.1.4.3. Company Financials
- 12.1.4.4. SWOT Analysis
- 12.1.5 Fresenius Kabi AG
- 12.1.5.1. Company Overview
- 12.1.5.2. Products
- 12.1.5.3. Company Financials
- 12.1.5.4. SWOT Analysis
- 12.1.6 Anhui Medipharm Co Ltd
- 12.1.6.1. Company Overview
- 12.1.6.2. Products
- 12.1.6.3. Company Financials
- 12.1.6.4. SWOT Analysis
- 12.1.7 Wuhan Uni-Pharma Bio-Tech Co Ltd
- 12.1.7.1. Company Overview
- 12.1.7.2. Products
- 12.1.7.3. Company Financials
- 12.1.7.4. SWOT Analysis
- 12.1.8 B Braun Melsungen AG
- 12.1.8.1. Company Overview
- 12.1.8.2. Products
- 12.1.8.3. Company Financials
- 12.1.8.4. SWOT Analysis
- 12.1.9 Vifor Pharma
- 12.1.9.1. Company Overview
- 12.1.9.2. Products
- 12.1.9.3. Company Financials
- 12.1.9.4. SWOT Analysis
- 12.1.10 Baxter International
- 12.1.10.1. Company Overview
- 12.1.10.2. Products
- 12.1.10.3. Company Financials
- 12.1.10.4. SWOT Analysis
- 12.1.1 Ajinomoto
- 12.2. Market Entropy
- 12.2.1 Company's Key Areas Served
- 12.2.2 Recent Developments
- 12.3. Company Market Share Analysis 2025
- 12.3.1 Top 5 Companies Market Share Analysis
- 12.3.2 Top 3 Companies Market Share Analysis
- 12.4. List of Potential Customers
- 13. Research Methodology
List of Figures
- Figure 1: Global Intravenous Solutions Industry Revenue Breakdown (billion, %) by Region 2025 & 2033
- Figure 2: Global Intravenous Solutions Industry Volume Breakdown (K Unit, %) by Region 2025 & 2033
- Figure 3: North America Intravenous Solutions Industry Revenue (billion), by Type 2025 & 2033
- Figure 4: North America Intravenous Solutions Industry Volume (K Unit), by Type 2025 & 2033
- Figure 5: North America Intravenous Solutions Industry Revenue Share (%), by Type 2025 & 2033
- Figure 6: North America Intravenous Solutions Industry Volume Share (%), by Type 2025 & 2033
- Figure 7: North America Intravenous Solutions Industry Revenue (billion), by Solution Composition 2025 & 2033
- Figure 8: North America Intravenous Solutions Industry Volume (K Unit), by Solution Composition 2025 & 2033
- Figure 9: North America Intravenous Solutions Industry Revenue Share (%), by Solution Composition 2025 & 2033
- Figure 10: North America Intravenous Solutions Industry Volume Share (%), by Solution Composition 2025 & 2033
- Figure 11: North America Intravenous Solutions Industry Revenue (billion), by Country 2025 & 2033
- Figure 12: North America Intravenous Solutions Industry Volume (K Unit), by Country 2025 & 2033
- Figure 13: North America Intravenous Solutions Industry Revenue Share (%), by Country 2025 & 2033
- Figure 14: North America Intravenous Solutions Industry Volume Share (%), by Country 2025 & 2033
- Figure 15: Europe Intravenous Solutions Industry Revenue (billion), by Type 2025 & 2033
- Figure 16: Europe Intravenous Solutions Industry Volume (K Unit), by Type 2025 & 2033
- Figure 17: Europe Intravenous Solutions Industry Revenue Share (%), by Type 2025 & 2033
- Figure 18: Europe Intravenous Solutions Industry Volume Share (%), by Type 2025 & 2033
- Figure 19: Europe Intravenous Solutions Industry Revenue (billion), by Solution Composition 2025 & 2033
- Figure 20: Europe Intravenous Solutions Industry Volume (K Unit), by Solution Composition 2025 & 2033
- Figure 21: Europe Intravenous Solutions Industry Revenue Share (%), by Solution Composition 2025 & 2033
- Figure 22: Europe Intravenous Solutions Industry Volume Share (%), by Solution Composition 2025 & 2033
- Figure 23: Europe Intravenous Solutions Industry Revenue (billion), by Country 2025 & 2033
- Figure 24: Europe Intravenous Solutions Industry Volume (K Unit), by Country 2025 & 2033
- Figure 25: Europe Intravenous Solutions Industry Revenue Share (%), by Country 2025 & 2033
- Figure 26: Europe Intravenous Solutions Industry Volume Share (%), by Country 2025 & 2033
- Figure 27: Asia Pacific Intravenous Solutions Industry Revenue (billion), by Type 2025 & 2033
- Figure 28: Asia Pacific Intravenous Solutions Industry Volume (K Unit), by Type 2025 & 2033
- Figure 29: Asia Pacific Intravenous Solutions Industry Revenue Share (%), by Type 2025 & 2033
- Figure 30: Asia Pacific Intravenous Solutions Industry Volume Share (%), by Type 2025 & 2033
- Figure 31: Asia Pacific Intravenous Solutions Industry Revenue (billion), by Solution Composition 2025 & 2033
- Figure 32: Asia Pacific Intravenous Solutions Industry Volume (K Unit), by Solution Composition 2025 & 2033
- Figure 33: Asia Pacific Intravenous Solutions Industry Revenue Share (%), by Solution Composition 2025 & 2033
- Figure 34: Asia Pacific Intravenous Solutions Industry Volume Share (%), by Solution Composition 2025 & 2033
- Figure 35: Asia Pacific Intravenous Solutions Industry Revenue (billion), by Country 2025 & 2033
- Figure 36: Asia Pacific Intravenous Solutions Industry Volume (K Unit), by Country 2025 & 2033
- Figure 37: Asia Pacific Intravenous Solutions Industry Revenue Share (%), by Country 2025 & 2033
- Figure 38: Asia Pacific Intravenous Solutions Industry Volume Share (%), by Country 2025 & 2033
- Figure 39: Middle East and Africa Intravenous Solutions Industry Revenue (billion), by Type 2025 & 2033
- Figure 40: Middle East and Africa Intravenous Solutions Industry Volume (K Unit), by Type 2025 & 2033
- Figure 41: Middle East and Africa Intravenous Solutions Industry Revenue Share (%), by Type 2025 & 2033
- Figure 42: Middle East and Africa Intravenous Solutions Industry Volume Share (%), by Type 2025 & 2033
- Figure 43: Middle East and Africa Intravenous Solutions Industry Revenue (billion), by Solution Composition 2025 & 2033
- Figure 44: Middle East and Africa Intravenous Solutions Industry Volume (K Unit), by Solution Composition 2025 & 2033
- Figure 45: Middle East and Africa Intravenous Solutions Industry Revenue Share (%), by Solution Composition 2025 & 2033
- Figure 46: Middle East and Africa Intravenous Solutions Industry Volume Share (%), by Solution Composition 2025 & 2033
- Figure 47: Middle East and Africa Intravenous Solutions Industry Revenue (billion), by Country 2025 & 2033
- Figure 48: Middle East and Africa Intravenous Solutions Industry Volume (K Unit), by Country 2025 & 2033
- Figure 49: Middle East and Africa Intravenous Solutions Industry Revenue Share (%), by Country 2025 & 2033
- Figure 50: Middle East and Africa Intravenous Solutions Industry Volume Share (%), by Country 2025 & 2033
- Figure 51: South America Intravenous Solutions Industry Revenue (billion), by Type 2025 & 2033
- Figure 52: South America Intravenous Solutions Industry Volume (K Unit), by Type 2025 & 2033
- Figure 53: South America Intravenous Solutions Industry Revenue Share (%), by Type 2025 & 2033
- Figure 54: South America Intravenous Solutions Industry Volume Share (%), by Type 2025 & 2033
- Figure 55: South America Intravenous Solutions Industry Revenue (billion), by Solution Composition 2025 & 2033
- Figure 56: South America Intravenous Solutions Industry Volume (K Unit), by Solution Composition 2025 & 2033
- Figure 57: South America Intravenous Solutions Industry Revenue Share (%), by Solution Composition 2025 & 2033
- Figure 58: South America Intravenous Solutions Industry Volume Share (%), by Solution Composition 2025 & 2033
- Figure 59: South America Intravenous Solutions Industry Revenue (billion), by Country 2025 & 2033
- Figure 60: South America Intravenous Solutions Industry Volume (K Unit), by Country 2025 & 2033
- Figure 61: South America Intravenous Solutions Industry Revenue Share (%), by Country 2025 & 2033
- Figure 62: South America Intravenous Solutions Industry Volume Share (%), by Country 2025 & 2033
List of Tables
- Table 1: Global Intravenous Solutions Industry Revenue billion Forecast, by Type 2020 & 2033
- Table 2: Global Intravenous Solutions Industry Volume K Unit Forecast, by Type 2020 & 2033
- Table 3: Global Intravenous Solutions Industry Revenue billion Forecast, by Solution Composition 2020 & 2033
- Table 4: Global Intravenous Solutions Industry Volume K Unit Forecast, by Solution Composition 2020 & 2033
- Table 5: Global Intravenous Solutions Industry Revenue billion Forecast, by Region 2020 & 2033
- Table 6: Global Intravenous Solutions Industry Volume K Unit Forecast, by Region 2020 & 2033
- Table 7: Global Intravenous Solutions Industry Revenue billion Forecast, by Type 2020 & 2033
- Table 8: Global Intravenous Solutions Industry Volume K Unit Forecast, by Type 2020 & 2033
- Table 9: Global Intravenous Solutions Industry Revenue billion Forecast, by Solution Composition 2020 & 2033
- Table 10: Global Intravenous Solutions Industry Volume K Unit Forecast, by Solution Composition 2020 & 2033
- Table 11: Global Intravenous Solutions Industry Revenue billion Forecast, by Country 2020 & 2033
- Table 12: Global Intravenous Solutions Industry Volume K Unit Forecast, by Country 2020 & 2033
- Table 13: United States Intravenous Solutions Industry Revenue (billion) Forecast, by Application 2020 & 2033
- Table 14: United States Intravenous Solutions Industry Volume (K Unit) Forecast, by Application 2020 & 2033
- Table 15: Canada Intravenous Solutions Industry Revenue (billion) Forecast, by Application 2020 & 2033
- Table 16: Canada Intravenous Solutions Industry Volume (K Unit) Forecast, by Application 2020 & 2033
- Table 17: Mexico Intravenous Solutions Industry Revenue (billion) Forecast, by Application 2020 & 2033
- Table 18: Mexico Intravenous Solutions Industry Volume (K Unit) Forecast, by Application 2020 & 2033
- Table 19: Global Intravenous Solutions Industry Revenue billion Forecast, by Type 2020 & 2033
- Table 20: Global Intravenous Solutions Industry Volume K Unit Forecast, by Type 2020 & 2033
- Table 21: Global Intravenous Solutions Industry Revenue billion Forecast, by Solution Composition 2020 & 2033
- Table 22: Global Intravenous Solutions Industry Volume K Unit Forecast, by Solution Composition 2020 & 2033
- Table 23: Global Intravenous Solutions Industry Revenue billion Forecast, by Country 2020 & 2033
- Table 24: Global Intravenous Solutions Industry Volume K Unit Forecast, by Country 2020 & 2033
- Table 25: Germany Intravenous Solutions Industry Revenue (billion) Forecast, by Application 2020 & 2033
- Table 26: Germany Intravenous Solutions Industry Volume (K Unit) Forecast, by Application 2020 & 2033
- Table 27: United Kingdom Intravenous Solutions Industry Revenue (billion) Forecast, by Application 2020 & 2033
- Table 28: United Kingdom Intravenous Solutions Industry Volume (K Unit) Forecast, by Application 2020 & 2033
- Table 29: France Intravenous Solutions Industry Revenue (billion) Forecast, by Application 2020 & 2033
- Table 30: France Intravenous Solutions Industry Volume (K Unit) Forecast, by Application 2020 & 2033
- Table 31: Italy Intravenous Solutions Industry Revenue (billion) Forecast, by Application 2020 & 2033
- Table 32: Italy Intravenous Solutions Industry Volume (K Unit) Forecast, by Application 2020 & 2033
- Table 33: Spain Intravenous Solutions Industry Revenue (billion) Forecast, by Application 2020 & 2033
- Table 34: Spain Intravenous Solutions Industry Volume (K Unit) Forecast, by Application 2020 & 2033
- Table 35: Rest of Europe Intravenous Solutions Industry Revenue (billion) Forecast, by Application 2020 & 2033
- Table 36: Rest of Europe Intravenous Solutions Industry Volume (K Unit) Forecast, by Application 2020 & 2033
- Table 37: Global Intravenous Solutions Industry Revenue billion Forecast, by Type 2020 & 2033
- Table 38: Global Intravenous Solutions Industry Volume K Unit Forecast, by Type 2020 & 2033
- Table 39: Global Intravenous Solutions Industry Revenue billion Forecast, by Solution Composition 2020 & 2033
- Table 40: Global Intravenous Solutions Industry Volume K Unit Forecast, by Solution Composition 2020 & 2033
- Table 41: Global Intravenous Solutions Industry Revenue billion Forecast, by Country 2020 & 2033
- Table 42: Global Intravenous Solutions Industry Volume K Unit Forecast, by Country 2020 & 2033
- Table 43: China Intravenous Solutions Industry Revenue (billion) Forecast, by Application 2020 & 2033
- Table 44: China Intravenous Solutions Industry Volume (K Unit) Forecast, by Application 2020 & 2033
- Table 45: Japan Intravenous Solutions Industry Revenue (billion) Forecast, by Application 2020 & 2033
- Table 46: Japan Intravenous Solutions Industry Volume (K Unit) Forecast, by Application 2020 & 2033
- Table 47: India Intravenous Solutions Industry Revenue (billion) Forecast, by Application 2020 & 2033
- Table 48: India Intravenous Solutions Industry Volume (K Unit) Forecast, by Application 2020 & 2033
- Table 49: Australia Intravenous Solutions Industry Revenue (billion) Forecast, by Application 2020 & 2033
- Table 50: Australia Intravenous Solutions Industry Volume (K Unit) Forecast, by Application 2020 & 2033
- Table 51: South Korea Intravenous Solutions Industry Revenue (billion) Forecast, by Application 2020 & 2033
- Table 52: South Korea Intravenous Solutions Industry Volume (K Unit) Forecast, by Application 2020 & 2033
- Table 53: Rest of Asia Pacific Intravenous Solutions Industry Revenue (billion) Forecast, by Application 2020 & 2033
- Table 54: Rest of Asia Pacific Intravenous Solutions Industry Volume (K Unit) Forecast, by Application 2020 & 2033
- Table 55: Global Intravenous Solutions Industry Revenue billion Forecast, by Type 2020 & 2033
- Table 56: Global Intravenous Solutions Industry Volume K Unit Forecast, by Type 2020 & 2033
- Table 57: Global Intravenous Solutions Industry Revenue billion Forecast, by Solution Composition 2020 & 2033
- Table 58: Global Intravenous Solutions Industry Volume K Unit Forecast, by Solution Composition 2020 & 2033
- Table 59: Global Intravenous Solutions Industry Revenue billion Forecast, by Country 2020 & 2033
- Table 60: Global Intravenous Solutions Industry Volume K Unit Forecast, by Country 2020 & 2033
- Table 61: GCC Intravenous Solutions Industry Revenue (billion) Forecast, by Application 2020 & 2033
- Table 62: GCC Intravenous Solutions Industry Volume (K Unit) Forecast, by Application 2020 & 2033
- Table 63: South Africa Intravenous Solutions Industry Revenue (billion) Forecast, by Application 2020 & 2033
- Table 64: South Africa Intravenous Solutions Industry Volume (K Unit) Forecast, by Application 2020 & 2033
- Table 65: Rest of Middle East and Africa Intravenous Solutions Industry Revenue (billion) Forecast, by Application 2020 & 2033
- Table 66: Rest of Middle East and Africa Intravenous Solutions Industry Volume (K Unit) Forecast, by Application 2020 & 2033
- Table 67: Global Intravenous Solutions Industry Revenue billion Forecast, by Type 2020 & 2033
- Table 68: Global Intravenous Solutions Industry Volume K Unit Forecast, by Type 2020 & 2033
- Table 69: Global Intravenous Solutions Industry Revenue billion Forecast, by Solution Composition 2020 & 2033
- Table 70: Global Intravenous Solutions Industry Volume K Unit Forecast, by Solution Composition 2020 & 2033
- Table 71: Global Intravenous Solutions Industry Revenue billion Forecast, by Country 2020 & 2033
- Table 72: Global Intravenous Solutions Industry Volume K Unit Forecast, by Country 2020 & 2033
- Table 73: Brazil Intravenous Solutions Industry Revenue (billion) Forecast, by Application 2020 & 2033
- Table 74: Brazil Intravenous Solutions Industry Volume (K Unit) Forecast, by Application 2020 & 2033
- Table 75: Argentina Intravenous Solutions Industry Revenue (billion) Forecast, by Application 2020 & 2033
- Table 76: Argentina Intravenous Solutions Industry Volume (K Unit) Forecast, by Application 2020 & 2033
- Table 77: Rest of South America Intravenous Solutions Industry Revenue (billion) Forecast, by Application 2020 & 2033
- Table 78: Rest of South America Intravenous Solutions Industry Volume (K Unit) Forecast, by Application 2020 & 2033
Frequently Asked Questions
1. What is the projected Compound Annual Growth Rate (CAGR) of the Intravenous Solutions Industry?
The projected CAGR is approximately 9.57%.
2. Which companies are prominent players in the Intravenous Solutions Industry?
Key companies in the market include Ajinomoto, ICU Medical Inc, Grifols, Omnicare, Fresenius Kabi AG, Anhui Medipharm Co Ltd, Wuhan Uni-Pharma Bio-Tech Co Ltd , B Braun Melsungen AG, Vifor Pharma, Baxter International.
3. What are the main segments of the Intravenous Solutions Industry?
The market segments include Type, Solution Composition.
4. Can you provide details about the market size?
The market size is estimated to be USD 13.8 billion as of 2022.
5. What are some drivers contributing to market growth?
Increasing Prevalence of Diseases. such as Gastrointestinal Disorder. Neurological Diseases. and Cancer; Advancements and New Innovations in the Products for Patient Convenience.
6. What are the notable trends driving market growth?
Total Parenteral Nutrition Segment is Dominating the Intravenous Solutions Market.
7. Are there any restraints impacting market growth?
Regulatory and Quality Requirements.
8. Can you provide examples of recent developments in the market?
In February 2022, B. Braun Medical received the US FDA approval to begin operations at its new IV saline solution manufacturing facility in Daytona Beach, Florida.
9. What pricing options are available for accessing the report?
Pricing options include single-user, multi-user, and enterprise licenses priced at USD 4750, USD 5250, and USD 8750 respectively.
10. Is the market size provided in terms of value or volume?
The market size is provided in terms of value, measured in billion and volume, measured in K Unit.
11. Are there any specific market keywords associated with the report?
Yes, the market keyword associated with the report is "Intravenous Solutions Industry," which aids in identifying and referencing the specific market segment covered.
12. How do I determine which pricing option suits my needs best?
The pricing options vary based on user requirements and access needs. Individual users may opt for single-user licenses, while businesses requiring broader access may choose multi-user or enterprise licenses for cost-effective access to the report.
13. Are there any additional resources or data provided in the Intravenous Solutions Industry report?
While the report offers comprehensive insights, it's advisable to review the specific contents or supplementary materials provided to ascertain if additional resources or data are available.
14. How can I stay updated on further developments or reports in the Intravenous Solutions Industry?
To stay informed about further developments, trends, and reports in the Intravenous Solutions Industry, consider subscribing to industry newsletters, following relevant companies and organizations, or regularly checking reputable industry news sources and publications.
Methodology
Step 1 - Identification of Relevant Samples Size from Population Database


Step 2 - Approaches for Defining Global Market Size (Value, Volume* & Price*)

Note*: In applicable scenarios
Step 3 - Data Sources
Primary Research
- Web Analytics
- Survey Reports
- Research Institute
- Latest Research Reports
- Opinion Leaders
Secondary Research
- Annual Reports
- White Paper
- Latest Press Release
- Industry Association
- Paid Database
- Investor Presentations

Step 4 - Data Triangulation
Involves using different sources of information in order to increase the validity of a study
These sources are likely to be stakeholders in a program - participants, other researchers, program staff, other community members, and so on.
Then we put all data in single framework & apply various statistical tools to find out the dynamic on the market.
During the analysis stage, feedback from the stakeholder groups would be compared to determine areas of agreement as well as areas of divergence