
Key Insights
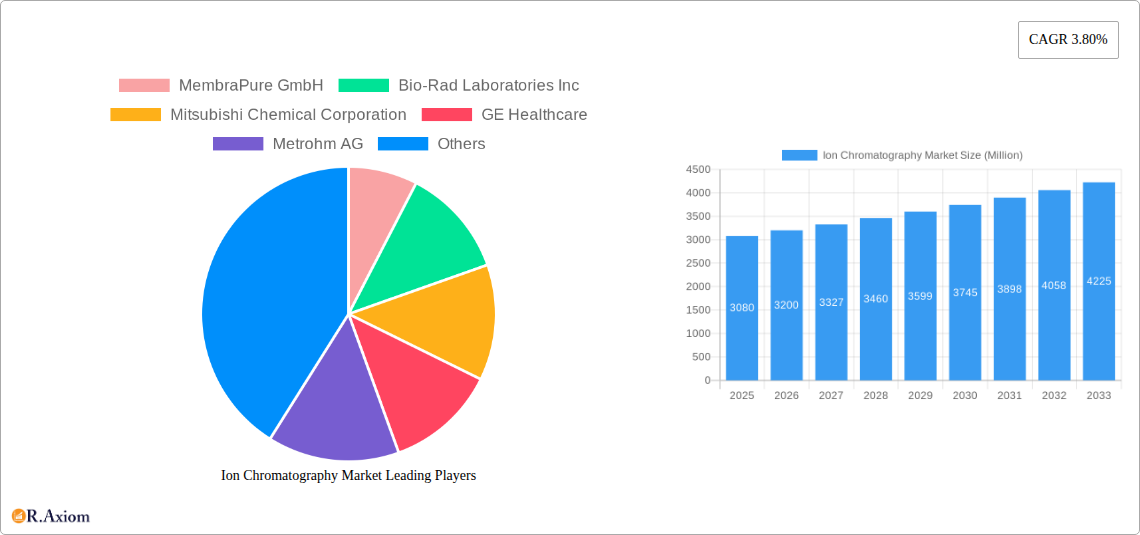
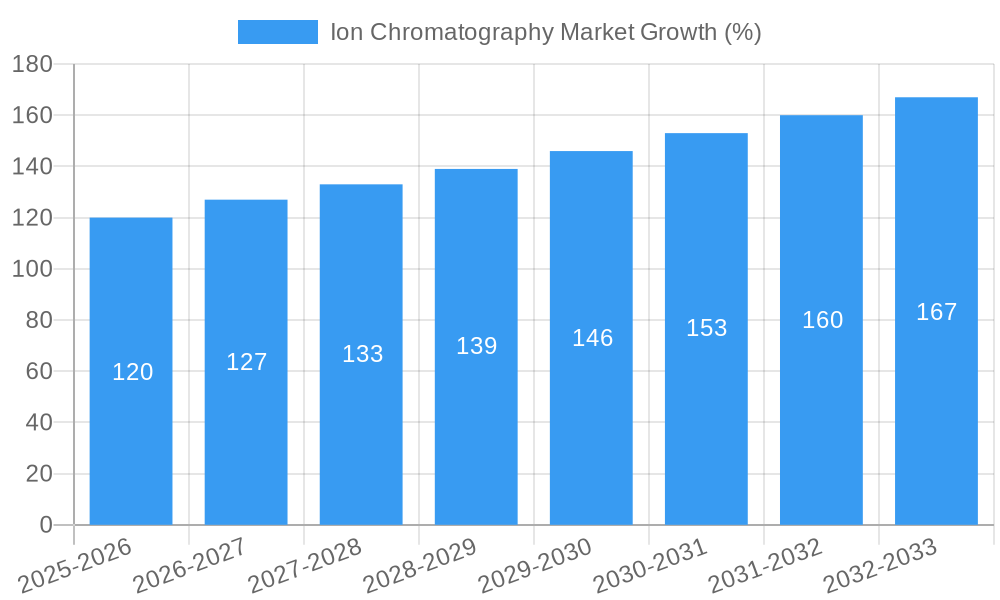
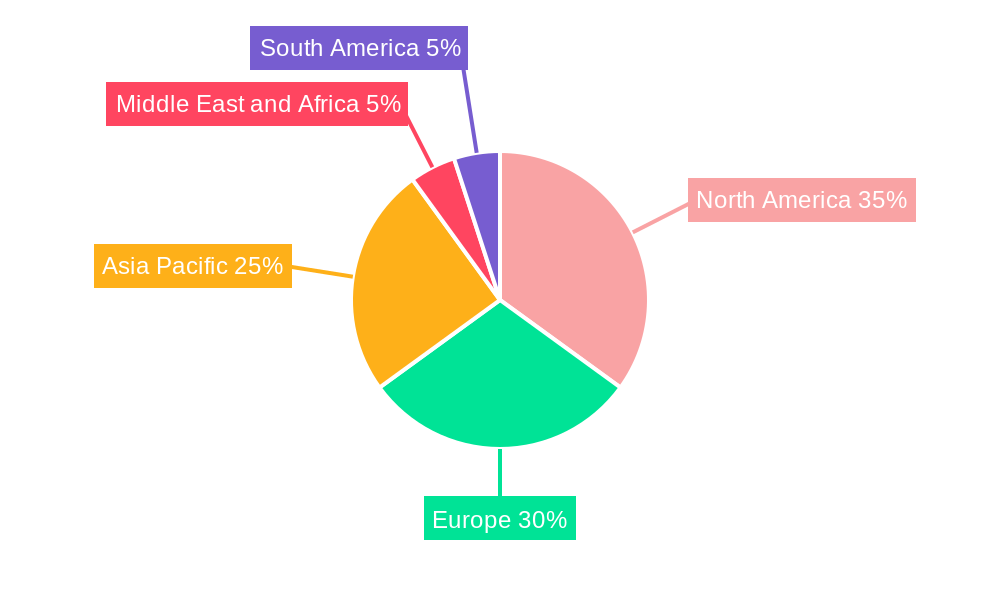
The Ion Chromatography (IC) market, valued at $3.08 billion in 2025, is projected to experience robust growth, driven by increasing demand across diverse sectors. The pharmaceutical industry's stringent quality control needs and the growing focus on environmental monitoring are key factors propelling market expansion. Technological advancements in IC, such as the development of high-performance instruments with improved sensitivity and automation, are further enhancing its adoption. The food and beverage industry's need for precise analysis of contaminants and additives also contributes significantly to market growth. While the market faces some restraints, such as the high cost of instruments and the need for skilled operators, the overall outlook remains positive. The consistent CAGR of 3.80% suggests a steady and sustained growth trajectory over the forecast period (2025-2033). This growth is expected to be particularly strong in regions like Asia-Pacific, fueled by increasing industrialization and government initiatives promoting environmental protection. North America and Europe are expected to maintain substantial market shares, driven by established research infrastructure and regulatory compliance mandates. The segmentation by technology (Ion-exchange, Ion-exclusion, Ion-pair chromatography) indicates a varied market landscape, with Ion-exchange chromatography currently dominating due to its versatility and wide applicability. Different applications within each segment provide opportunities for specialized instrument development and customized solutions.
Competitive landscape analysis reveals a mix of established players like Thermo Fisher Scientific, Agilent Technologies, and Waters Corporation, alongside regional players like Qingdao Shenghan. This indicates a potential for both consolidation and further innovation within the market. The strategic focus on developing advanced analytical techniques and offering comprehensive services including instrument maintenance and application support will be crucial for success in this evolving market. Overall, the IC market is characterized by strong growth drivers, significant technological innovation, and a competitive landscape poised for further development over the coming years. This makes it an attractive sector for both investors and industry professionals interested in analytical chemistry and environmental monitoring technologies.
This comprehensive report provides a detailed analysis of the Ion Chromatography market, offering invaluable insights for stakeholders, investors, and industry professionals. The study covers the period 2019-2033, with 2025 serving as the base and estimated year. The report leverages robust data and market intelligence to deliver actionable strategies for navigating this dynamic landscape. The global Ion Chromatography market is projected to reach xx Million by 2033, exhibiting a CAGR of xx% during the forecast period (2025-2033).
Ion Chromatography Market Concentration & Innovation
The Ion Chromatography market exhibits a moderately consolidated structure, with key players holding significant market share. While a few dominant players like Thermo Fisher Scientific, Agilent Technologies Inc, and Waters control a substantial portion, several regional and specialized players contribute to the competitive landscape. Market share fluctuates based on technological advancements, strategic partnerships, and regulatory changes.
Mergers and acquisitions (M&A) activity plays a pivotal role in shaping market dynamics. While precise deal values remain confidential, several significant M&A activities have been witnessed in recent years, driving market consolidation and innovation. For instance, the acquisition of xx company by xx company in 2022 valued at xx Million showcased a strategic move to expand market presence and product portfolios.
- Market Concentration: Moderately consolidated with top 5 players holding approximately xx% of market share in 2024.
- Innovation Drivers: Continuous advancements in chromatography technology, increasing demand for high-throughput analysis, and stringent regulatory compliance requirements are key drivers.
- Regulatory Frameworks: Stringent environmental regulations and increasing focus on food safety globally significantly impact market growth.
- Product Substitutes: Limited viable substitutes exist, strengthening the market's overall growth trajectory. However, alternative analytical techniques might emerge as potential substitutes in niche applications.
- End-User Trends: The growing adoption of automation and miniaturization within various end-use industries fuels demand.
- M&A Activities: Significant M&A activity observed in recent years, resulting in market consolidation and expanded product offerings.
Ion Chromatography Market Industry Trends & Insights
The Ion Chromatography market is characterized by robust growth, propelled by the escalating demand for precise and efficient analytical techniques across various sectors. The pharmaceutical industry, with its stringent quality control requirements, remains a key driver. Environmental monitoring agencies also contribute significantly due to increased regulatory scrutiny for water and soil analysis. The food and beverage sector also fuels demand for quality control and safety testing. Technological advancements, including the development of high-resolution instruments and user-friendly software, continue to enhance market penetration. The market's growth trajectory exhibits a noticeable shift towards sophisticated and automated systems, which are becoming increasingly prevalent.
The rise of miniaturized and portable Ion Chromatography systems also contributes significantly, expanding accessibility for on-site analysis in remote locations or for field testing. Competitive dynamics are primarily shaped by technological innovation, pricing strategies, and the ability to provide comprehensive service and support. The market displays steady growth, with a CAGR of xx% projected from 2025 to 2033. Market penetration varies across different applications and geographical regions, with developed economies showing higher penetration rates compared to developing nations.
Dominant Markets & Segments in Ion Chromatography Market
The North American region currently holds the largest market share in the Ion Chromatography market, driven by robust pharmaceutical and environmental testing industries. Europe follows closely, propelled by similar drivers and extensive research and development activities. The Asia-Pacific region displays strong growth potential due to increasing industrialization and investments in infrastructure development.
Dominant Technology: Ion-exchange chromatography dominates the technology segment due to its versatility and effectiveness in separating various ions.
Dominant Application: Environmental testing constitutes a dominant application segment, spurred by stringent environmental regulations and the necessity for precise water quality monitoring.
Key Drivers (North America): Strong regulatory framework, robust pharmaceutical industry, and advanced research infrastructure.
Key Drivers (Europe): High concentration of research institutions, stringent environmental regulations, and substantial government funding for R&D.
Key Drivers (Asia-Pacific): Rapid industrialization, increasing awareness of environmental issues, and rising disposable incomes.
The pharmaceutical industry shows high demand for Ion Chromatography due to its critical role in quality control, ensuring the purity and efficacy of pharmaceutical products. The food and beverage industry also exhibits substantial growth due to increased focus on food safety and quality regulations. The chemical industry relies heavily on Ion Chromatography for process optimization and quality control, resulting in substantial market demand within this segment.
Ion Chromatography Market Product Developments
Recent advancements in Ion Chromatography focus on enhancing sensitivity, speed, and automation. Miniaturized systems and integrated detectors are gaining popularity, alongside advancements in software for improved data analysis and interpretation. The introduction of new stationary phases tailored for specific applications expands the technology's capabilities, and efficient column designs further optimize the performance and analysis time. This results in more streamlined workflows and enhanced analytical capabilities for various industries.
Report Scope & Segmentation Analysis
This report segments the Ion Chromatography market across various technologies (Ion-exchange Chromatography, Ion-exclusion Chromatography, Ion-pair Chromatography) and applications (Environmental Testing, Pharmaceutical Industry, Food Industry, Chemicals Industry, Other Applications). Each segment is analyzed individually, considering market size, growth projections, and competitive dynamics. For example, the Ion-exchange Chromatography segment is expected to dominate owing to its wide applications, while the pharmaceutical industry will significantly drive market growth across various chromatography technologies. Each segment's growth trajectory is unique, influenced by factors such as regulatory changes, technological advancements, and industry-specific needs. The report provides detailed insights into each segment's competitive landscape, including market share analysis of leading players.
Key Drivers of Ion Chromatography Market Growth
Several factors contribute to the Ion Chromatography market’s growth. Stringent environmental regulations mandating water quality monitoring significantly drive demand. The pharmaceutical industry's stringent quality control measures necessitate accurate ion analysis. Growing awareness of food safety and the need for efficient testing contribute significantly. Technological advancements in instrumentation, including increased automation and sensitivity, further propel market expansion. Finally, rising investments in research and development across multiple sectors contribute to this growth.
Challenges in the Ion Chromatography Market Sector
The Ion Chromatography market faces challenges such as high equipment costs, the need for skilled operators, and the complexity of certain analytical procedures. Competition from other analytical techniques, such as mass spectrometry, also presents a challenge. Fluctuations in raw material prices and potential supply chain disruptions further impact market stability. Lastly, stringent regulatory compliance requirements add complexity for manufacturers and end-users alike. These factors need to be addressed for sustained market growth.
Emerging Opportunities in Ion Chromatography Market
Emerging opportunities lie in the development of portable and miniaturized Ion Chromatography systems for on-site analysis, particularly in environmental monitoring and food safety testing. Advancements in hyphenated techniques (coupling with mass spectrometry or other detectors) offer enhanced analytical capabilities. The exploration of new stationary phases tailored for specific analytes presents substantial opportunities for expanding application scope. Furthermore, growth in emerging economies and rising investment in infrastructure development create promising markets for this technology.
Leading Players in the Ion Chromatography Market Market
- MembraPure GmbH
- Bio-Rad Laboratories Inc (https://www.bio-rad.com/)
- Mitsubishi Chemical Corporation
- GE Healthcare (https://www.gehealthcare.com/)
- Metrohm AG (https://www.metrohm.com/)
- Waters (https://www.waters.com/)
- Tosoh Corporation
- Agilent Technologies Inc (https://www.agilent.com/)
- Qingdao Shenghan
- Thermo Fisher Scientific (https://www.thermofisher.com/)
- Shimadzu Corporation (https://www.shimadzu.com/)
- Perkin Elmer Inc (https://www.perkinelmer.com/)
Key Developments in Ion Chromatography Market Industry
June 2022: Bio-Rad launched EconoFit Chromatography Column packs, offering various resins in a pre-packed format, including mixed-mode, cation, and anion exchange resin columns, and a pack for polyhistidine protein purification. This expansion broadened product offerings and enhanced market competitiveness.
May 2022: Thermo Fisher launched quat pesticide determination and quantitation workflows to improve food supply protection. This development caters to the growing demand for accurate pesticide residue analysis in the food industry.
Strategic Outlook for Ion Chromatography Market Market
The Ion Chromatography market is poised for continued growth, driven by technological innovation, stringent regulations across multiple sectors, and rising awareness of environmental and food safety. Future expansion will likely be shaped by the development of more efficient and user-friendly systems, along with the integration of advanced data analysis capabilities. The increasing demand for high-throughput analysis and on-site testing in various applications will further fuel market expansion in the coming years. The market's strategic direction is oriented towards miniaturization, automation, and enhanced analytical performance.
Ion Chromatography Market Segmentation
-
1. Technology
- 1.1. Ion-exchange Chromatography
- 1.2. Ion-exclusion Chromatography
- 1.3. Ion-pair Chromatography
-
2. Application
- 2.1. Environmental Testing
- 2.2. Pharmaceutical Industry
- 2.3. Food Industry
- 2.4. Chemicals Industry
- 2.5. Other Applications
Ion Chromatography Market Segmentation By Geography
-
1. North America
- 1.1. United States
- 1.2. Canada
- 1.3. Mexico
-
2. Europe
- 2.1. Germany
- 2.2. United Kingdom
- 2.3. France
- 2.4. Italy
- 2.5. Spain
- 2.6. Rest of Europe
-
3. Asia Pacific
- 3.1. China
- 3.2. Japan
- 3.3. India
- 3.4. Australia
- 3.5. South korea
- 3.6. Rest of Asia Pacific
-
4. Middle East and Africa
- 4.1. GCC
- 4.2. South Africa
- 4.3. Rest of Middle East and Africa
-
5. South America
- 5.1. Brazil
- 5.2. Argentina
- 5.3. Rest of South America
Ion Chromatography Market REPORT HIGHLIGHTS
| Aspects | Details |
|---|---|
| Study Period | 2019-2033 |
| Base Year | 2024 |
| Estimated Year | 2025 |
| Forecast Period | 2025-2033 |
| Historical Period | 2019-2024 |
| Growth Rate | CAGR of 3.80% from 2019-2033 |
| Segmentation |
|
Table of Contents
- 1. Introduction
- 1.1. Research Scope
- 1.2. Market Segmentation
- 1.3. Research Methodology
- 1.4. Definitions and Assumptions
- 2. Executive Summary
- 2.1. Introduction
- 3. Market Dynamics
- 3.1. Introduction
- 3.2. Market Drivers
- 3.2.1. Increasing Academic and Commercial R&D Spending on Pharmaceuticals; Increasing Use of Ion Chromatography Technique in Various Fields; Technological Advancements in Ion Chromatography
- 3.3. Market Restrains
- 3.3.1. High Cost of Instruments; Lack of Skilled Personnel to Handle Equipment
- 3.4. Market Trends
- 3.4.1. Application in Pharmaceutical Industry is Expected to Exhibit Fastest Growth Over the Forecast Period
- 4. Market Factor Analysis
- 4.1. Porters Five Forces
- 4.2. Supply/Value Chain
- 4.3. PESTEL analysis
- 4.4. Market Entropy
- 4.5. Patent/Trademark Analysis
- 5. Global Ion Chromatography Market Analysis, Insights and Forecast, 2019-2031
- 5.1. Market Analysis, Insights and Forecast - by Technology
- 5.1.1. Ion-exchange Chromatography
- 5.1.2. Ion-exclusion Chromatography
- 5.1.3. Ion-pair Chromatography
- 5.2. Market Analysis, Insights and Forecast - by Application
- 5.2.1. Environmental Testing
- 5.2.2. Pharmaceutical Industry
- 5.2.3. Food Industry
- 5.2.4. Chemicals Industry
- 5.2.5. Other Applications
- 5.3. Market Analysis, Insights and Forecast - by Region
- 5.3.1. North America
- 5.3.2. Europe
- 5.3.3. Asia Pacific
- 5.3.4. Middle East and Africa
- 5.3.5. South America
- 5.1. Market Analysis, Insights and Forecast - by Technology
- 6. North America Ion Chromatography Market Analysis, Insights and Forecast, 2019-2031
- 6.1. Market Analysis, Insights and Forecast - by Technology
- 6.1.1. Ion-exchange Chromatography
- 6.1.2. Ion-exclusion Chromatography
- 6.1.3. Ion-pair Chromatography
- 6.2. Market Analysis, Insights and Forecast - by Application
- 6.2.1. Environmental Testing
- 6.2.2. Pharmaceutical Industry
- 6.2.3. Food Industry
- 6.2.4. Chemicals Industry
- 6.2.5. Other Applications
- 6.1. Market Analysis, Insights and Forecast - by Technology
- 7. Europe Ion Chromatography Market Analysis, Insights and Forecast, 2019-2031
- 7.1. Market Analysis, Insights and Forecast - by Technology
- 7.1.1. Ion-exchange Chromatography
- 7.1.2. Ion-exclusion Chromatography
- 7.1.3. Ion-pair Chromatography
- 7.2. Market Analysis, Insights and Forecast - by Application
- 7.2.1. Environmental Testing
- 7.2.2. Pharmaceutical Industry
- 7.2.3. Food Industry
- 7.2.4. Chemicals Industry
- 7.2.5. Other Applications
- 7.1. Market Analysis, Insights and Forecast - by Technology
- 8. Asia Pacific Ion Chromatography Market Analysis, Insights and Forecast, 2019-2031
- 8.1. Market Analysis, Insights and Forecast - by Technology
- 8.1.1. Ion-exchange Chromatography
- 8.1.2. Ion-exclusion Chromatography
- 8.1.3. Ion-pair Chromatography
- 8.2. Market Analysis, Insights and Forecast - by Application
- 8.2.1. Environmental Testing
- 8.2.2. Pharmaceutical Industry
- 8.2.3. Food Industry
- 8.2.4. Chemicals Industry
- 8.2.5. Other Applications
- 8.1. Market Analysis, Insights and Forecast - by Technology
- 9. Middle East and Africa Ion Chromatography Market Analysis, Insights and Forecast, 2019-2031
- 9.1. Market Analysis, Insights and Forecast - by Technology
- 9.1.1. Ion-exchange Chromatography
- 9.1.2. Ion-exclusion Chromatography
- 9.1.3. Ion-pair Chromatography
- 9.2. Market Analysis, Insights and Forecast - by Application
- 9.2.1. Environmental Testing
- 9.2.2. Pharmaceutical Industry
- 9.2.3. Food Industry
- 9.2.4. Chemicals Industry
- 9.2.5. Other Applications
- 9.1. Market Analysis, Insights and Forecast - by Technology
- 10. South America Ion Chromatography Market Analysis, Insights and Forecast, 2019-2031
- 10.1. Market Analysis, Insights and Forecast - by Technology
- 10.1.1. Ion-exchange Chromatography
- 10.1.2. Ion-exclusion Chromatography
- 10.1.3. Ion-pair Chromatography
- 10.2. Market Analysis, Insights and Forecast - by Application
- 10.2.1. Environmental Testing
- 10.2.2. Pharmaceutical Industry
- 10.2.3. Food Industry
- 10.2.4. Chemicals Industry
- 10.2.5. Other Applications
- 10.1. Market Analysis, Insights and Forecast - by Technology
- 11. North America Ion Chromatography Market Analysis, Insights and Forecast, 2019-2031
- 11.1. Market Analysis, Insights and Forecast - By Country/Sub-region
- 11.1.1 United States
- 11.1.2 Canada
- 11.1.3 Mexico
- 12. Europe Ion Chromatography Market Analysis, Insights and Forecast, 2019-2031
- 12.1. Market Analysis, Insights and Forecast - By Country/Sub-region
- 12.1.1 Germany
- 12.1.2 United Kingdom
- 12.1.3 France
- 12.1.4 Italy
- 12.1.5 Spain
- 12.1.6 Rest of Europe
- 13. Asia Pacific Ion Chromatography Market Analysis, Insights and Forecast, 2019-2031
- 13.1. Market Analysis, Insights and Forecast - By Country/Sub-region
- 13.1.1 China
- 13.1.2 Japan
- 13.1.3 India
- 13.1.4 Australia
- 13.1.5 South korea
- 13.1.6 Rest of Asia Pacific
- 14. Middle East and Africa Ion Chromatography Market Analysis, Insights and Forecast, 2019-2031
- 14.1. Market Analysis, Insights and Forecast - By Country/Sub-region
- 14.1.1 GCC
- 14.1.2 South Africa
- 14.1.3 Rest of Middle East and Africa
- 15. South America Ion Chromatography Market Analysis, Insights and Forecast, 2019-2031
- 15.1. Market Analysis, Insights and Forecast - By Country/Sub-region
- 15.1.1 Brazil
- 15.1.2 Argentina
- 15.1.3 Rest of South America
- 16. Competitive Analysis
- 16.1. Global Market Share Analysis 2024
- 16.2. Company Profiles
- 16.2.1 MembraPure GmbH
- 16.2.1.1. Overview
- 16.2.1.2. Products
- 16.2.1.3. SWOT Analysis
- 16.2.1.4. Recent Developments
- 16.2.1.5. Financials (Based on Availability)
- 16.2.2 Bio-Rad Laboratories Inc
- 16.2.2.1. Overview
- 16.2.2.2. Products
- 16.2.2.3. SWOT Analysis
- 16.2.2.4. Recent Developments
- 16.2.2.5. Financials (Based on Availability)
- 16.2.3 Mitsubishi Chemical Corporation
- 16.2.3.1. Overview
- 16.2.3.2. Products
- 16.2.3.3. SWOT Analysis
- 16.2.3.4. Recent Developments
- 16.2.3.5. Financials (Based on Availability)
- 16.2.4 GE Healthcare
- 16.2.4.1. Overview
- 16.2.4.2. Products
- 16.2.4.3. SWOT Analysis
- 16.2.4.4. Recent Developments
- 16.2.4.5. Financials (Based on Availability)
- 16.2.5 Metrohm AG
- 16.2.5.1. Overview
- 16.2.5.2. Products
- 16.2.5.3. SWOT Analysis
- 16.2.5.4. Recent Developments
- 16.2.5.5. Financials (Based on Availability)
- 16.2.6 Waters
- 16.2.6.1. Overview
- 16.2.6.2. Products
- 16.2.6.3. SWOT Analysis
- 16.2.6.4. Recent Developments
- 16.2.6.5. Financials (Based on Availability)
- 16.2.7 Tosoh Corporation
- 16.2.7.1. Overview
- 16.2.7.2. Products
- 16.2.7.3. SWOT Analysis
- 16.2.7.4. Recent Developments
- 16.2.7.5. Financials (Based on Availability)
- 16.2.8 Agilent Technologies Inc
- 16.2.8.1. Overview
- 16.2.8.2. Products
- 16.2.8.3. SWOT Analysis
- 16.2.8.4. Recent Developments
- 16.2.8.5. Financials (Based on Availability)
- 16.2.9 Qingdao Shenghan
- 16.2.9.1. Overview
- 16.2.9.2. Products
- 16.2.9.3. SWOT Analysis
- 16.2.9.4. Recent Developments
- 16.2.9.5. Financials (Based on Availability)
- 16.2.10 Thermo Fisher Scientific
- 16.2.10.1. Overview
- 16.2.10.2. Products
- 16.2.10.3. SWOT Analysis
- 16.2.10.4. Recent Developments
- 16.2.10.5. Financials (Based on Availability)
- 16.2.11 Shimadzu Corporation
- 16.2.11.1. Overview
- 16.2.11.2. Products
- 16.2.11.3. SWOT Analysis
- 16.2.11.4. Recent Developments
- 16.2.11.5. Financials (Based on Availability)
- 16.2.12 Perkin Elmer Inc
- 16.2.12.1. Overview
- 16.2.12.2. Products
- 16.2.12.3. SWOT Analysis
- 16.2.12.4. Recent Developments
- 16.2.12.5. Financials (Based on Availability)
- 16.2.1 MembraPure GmbH
List of Figures
- Figure 1: Global Ion Chromatography Market Revenue Breakdown (Million, %) by Region 2024 & 2032
- Figure 2: Global Ion Chromatography Market Volume Breakdown (K Unit, %) by Region 2024 & 2032
- Figure 3: North America Ion Chromatography Market Revenue (Million), by Country 2024 & 2032
- Figure 4: North America Ion Chromatography Market Volume (K Unit), by Country 2024 & 2032
- Figure 5: North America Ion Chromatography Market Revenue Share (%), by Country 2024 & 2032
- Figure 6: North America Ion Chromatography Market Volume Share (%), by Country 2024 & 2032
- Figure 7: Europe Ion Chromatography Market Revenue (Million), by Country 2024 & 2032
- Figure 8: Europe Ion Chromatography Market Volume (K Unit), by Country 2024 & 2032
- Figure 9: Europe Ion Chromatography Market Revenue Share (%), by Country 2024 & 2032
- Figure 10: Europe Ion Chromatography Market Volume Share (%), by Country 2024 & 2032
- Figure 11: Asia Pacific Ion Chromatography Market Revenue (Million), by Country 2024 & 2032
- Figure 12: Asia Pacific Ion Chromatography Market Volume (K Unit), by Country 2024 & 2032
- Figure 13: Asia Pacific Ion Chromatography Market Revenue Share (%), by Country 2024 & 2032
- Figure 14: Asia Pacific Ion Chromatography Market Volume Share (%), by Country 2024 & 2032
- Figure 15: Middle East and Africa Ion Chromatography Market Revenue (Million), by Country 2024 & 2032
- Figure 16: Middle East and Africa Ion Chromatography Market Volume (K Unit), by Country 2024 & 2032
- Figure 17: Middle East and Africa Ion Chromatography Market Revenue Share (%), by Country 2024 & 2032
- Figure 18: Middle East and Africa Ion Chromatography Market Volume Share (%), by Country 2024 & 2032
- Figure 19: South America Ion Chromatography Market Revenue (Million), by Country 2024 & 2032
- Figure 20: South America Ion Chromatography Market Volume (K Unit), by Country 2024 & 2032
- Figure 21: South America Ion Chromatography Market Revenue Share (%), by Country 2024 & 2032
- Figure 22: South America Ion Chromatography Market Volume Share (%), by Country 2024 & 2032
- Figure 23: North America Ion Chromatography Market Revenue (Million), by Technology 2024 & 2032
- Figure 24: North America Ion Chromatography Market Volume (K Unit), by Technology 2024 & 2032
- Figure 25: North America Ion Chromatography Market Revenue Share (%), by Technology 2024 & 2032
- Figure 26: North America Ion Chromatography Market Volume Share (%), by Technology 2024 & 2032
- Figure 27: North America Ion Chromatography Market Revenue (Million), by Application 2024 & 2032
- Figure 28: North America Ion Chromatography Market Volume (K Unit), by Application 2024 & 2032
- Figure 29: North America Ion Chromatography Market Revenue Share (%), by Application 2024 & 2032
- Figure 30: North America Ion Chromatography Market Volume Share (%), by Application 2024 & 2032
- Figure 31: North America Ion Chromatography Market Revenue (Million), by Country 2024 & 2032
- Figure 32: North America Ion Chromatography Market Volume (K Unit), by Country 2024 & 2032
- Figure 33: North America Ion Chromatography Market Revenue Share (%), by Country 2024 & 2032
- Figure 34: North America Ion Chromatography Market Volume Share (%), by Country 2024 & 2032
- Figure 35: Europe Ion Chromatography Market Revenue (Million), by Technology 2024 & 2032
- Figure 36: Europe Ion Chromatography Market Volume (K Unit), by Technology 2024 & 2032
- Figure 37: Europe Ion Chromatography Market Revenue Share (%), by Technology 2024 & 2032
- Figure 38: Europe Ion Chromatography Market Volume Share (%), by Technology 2024 & 2032
- Figure 39: Europe Ion Chromatography Market Revenue (Million), by Application 2024 & 2032
- Figure 40: Europe Ion Chromatography Market Volume (K Unit), by Application 2024 & 2032
- Figure 41: Europe Ion Chromatography Market Revenue Share (%), by Application 2024 & 2032
- Figure 42: Europe Ion Chromatography Market Volume Share (%), by Application 2024 & 2032
- Figure 43: Europe Ion Chromatography Market Revenue (Million), by Country 2024 & 2032
- Figure 44: Europe Ion Chromatography Market Volume (K Unit), by Country 2024 & 2032
- Figure 45: Europe Ion Chromatography Market Revenue Share (%), by Country 2024 & 2032
- Figure 46: Europe Ion Chromatography Market Volume Share (%), by Country 2024 & 2032
- Figure 47: Asia Pacific Ion Chromatography Market Revenue (Million), by Technology 2024 & 2032
- Figure 48: Asia Pacific Ion Chromatography Market Volume (K Unit), by Technology 2024 & 2032
- Figure 49: Asia Pacific Ion Chromatography Market Revenue Share (%), by Technology 2024 & 2032
- Figure 50: Asia Pacific Ion Chromatography Market Volume Share (%), by Technology 2024 & 2032
- Figure 51: Asia Pacific Ion Chromatography Market Revenue (Million), by Application 2024 & 2032
- Figure 52: Asia Pacific Ion Chromatography Market Volume (K Unit), by Application 2024 & 2032
- Figure 53: Asia Pacific Ion Chromatography Market Revenue Share (%), by Application 2024 & 2032
- Figure 54: Asia Pacific Ion Chromatography Market Volume Share (%), by Application 2024 & 2032
- Figure 55: Asia Pacific Ion Chromatography Market Revenue (Million), by Country 2024 & 2032
- Figure 56: Asia Pacific Ion Chromatography Market Volume (K Unit), by Country 2024 & 2032
- Figure 57: Asia Pacific Ion Chromatography Market Revenue Share (%), by Country 2024 & 2032
- Figure 58: Asia Pacific Ion Chromatography Market Volume Share (%), by Country 2024 & 2032
- Figure 59: Middle East and Africa Ion Chromatography Market Revenue (Million), by Technology 2024 & 2032
- Figure 60: Middle East and Africa Ion Chromatography Market Volume (K Unit), by Technology 2024 & 2032
- Figure 61: Middle East and Africa Ion Chromatography Market Revenue Share (%), by Technology 2024 & 2032
- Figure 62: Middle East and Africa Ion Chromatography Market Volume Share (%), by Technology 2024 & 2032
- Figure 63: Middle East and Africa Ion Chromatography Market Revenue (Million), by Application 2024 & 2032
- Figure 64: Middle East and Africa Ion Chromatography Market Volume (K Unit), by Application 2024 & 2032
- Figure 65: Middle East and Africa Ion Chromatography Market Revenue Share (%), by Application 2024 & 2032
- Figure 66: Middle East and Africa Ion Chromatography Market Volume Share (%), by Application 2024 & 2032
- Figure 67: Middle East and Africa Ion Chromatography Market Revenue (Million), by Country 2024 & 2032
- Figure 68: Middle East and Africa Ion Chromatography Market Volume (K Unit), by Country 2024 & 2032
- Figure 69: Middle East and Africa Ion Chromatography Market Revenue Share (%), by Country 2024 & 2032
- Figure 70: Middle East and Africa Ion Chromatography Market Volume Share (%), by Country 2024 & 2032
- Figure 71: South America Ion Chromatography Market Revenue (Million), by Technology 2024 & 2032
- Figure 72: South America Ion Chromatography Market Volume (K Unit), by Technology 2024 & 2032
- Figure 73: South America Ion Chromatography Market Revenue Share (%), by Technology 2024 & 2032
- Figure 74: South America Ion Chromatography Market Volume Share (%), by Technology 2024 & 2032
- Figure 75: South America Ion Chromatography Market Revenue (Million), by Application 2024 & 2032
- Figure 76: South America Ion Chromatography Market Volume (K Unit), by Application 2024 & 2032
- Figure 77: South America Ion Chromatography Market Revenue Share (%), by Application 2024 & 2032
- Figure 78: South America Ion Chromatography Market Volume Share (%), by Application 2024 & 2032
- Figure 79: South America Ion Chromatography Market Revenue (Million), by Country 2024 & 2032
- Figure 80: South America Ion Chromatography Market Volume (K Unit), by Country 2024 & 2032
- Figure 81: South America Ion Chromatography Market Revenue Share (%), by Country 2024 & 2032
- Figure 82: South America Ion Chromatography Market Volume Share (%), by Country 2024 & 2032
List of Tables
- Table 1: Global Ion Chromatography Market Revenue Million Forecast, by Region 2019 & 2032
- Table 2: Global Ion Chromatography Market Volume K Unit Forecast, by Region 2019 & 2032
- Table 3: Global Ion Chromatography Market Revenue Million Forecast, by Technology 2019 & 2032
- Table 4: Global Ion Chromatography Market Volume K Unit Forecast, by Technology 2019 & 2032
- Table 5: Global Ion Chromatography Market Revenue Million Forecast, by Application 2019 & 2032
- Table 6: Global Ion Chromatography Market Volume K Unit Forecast, by Application 2019 & 2032
- Table 7: Global Ion Chromatography Market Revenue Million Forecast, by Region 2019 & 2032
- Table 8: Global Ion Chromatography Market Volume K Unit Forecast, by Region 2019 & 2032
- Table 9: Global Ion Chromatography Market Revenue Million Forecast, by Country 2019 & 2032
- Table 10: Global Ion Chromatography Market Volume K Unit Forecast, by Country 2019 & 2032
- Table 11: United States Ion Chromatography Market Revenue (Million) Forecast, by Application 2019 & 2032
- Table 12: United States Ion Chromatography Market Volume (K Unit) Forecast, by Application 2019 & 2032
- Table 13: Canada Ion Chromatography Market Revenue (Million) Forecast, by Application 2019 & 2032
- Table 14: Canada Ion Chromatography Market Volume (K Unit) Forecast, by Application 2019 & 2032
- Table 15: Mexico Ion Chromatography Market Revenue (Million) Forecast, by Application 2019 & 2032
- Table 16: Mexico Ion Chromatography Market Volume (K Unit) Forecast, by Application 2019 & 2032
- Table 17: Global Ion Chromatography Market Revenue Million Forecast, by Country 2019 & 2032
- Table 18: Global Ion Chromatography Market Volume K Unit Forecast, by Country 2019 & 2032
- Table 19: Germany Ion Chromatography Market Revenue (Million) Forecast, by Application 2019 & 2032
- Table 20: Germany Ion Chromatography Market Volume (K Unit) Forecast, by Application 2019 & 2032
- Table 21: United Kingdom Ion Chromatography Market Revenue (Million) Forecast, by Application 2019 & 2032
- Table 22: United Kingdom Ion Chromatography Market Volume (K Unit) Forecast, by Application 2019 & 2032
- Table 23: France Ion Chromatography Market Revenue (Million) Forecast, by Application 2019 & 2032
- Table 24: France Ion Chromatography Market Volume (K Unit) Forecast, by Application 2019 & 2032
- Table 25: Italy Ion Chromatography Market Revenue (Million) Forecast, by Application 2019 & 2032
- Table 26: Italy Ion Chromatography Market Volume (K Unit) Forecast, by Application 2019 & 2032
- Table 27: Spain Ion Chromatography Market Revenue (Million) Forecast, by Application 2019 & 2032
- Table 28: Spain Ion Chromatography Market Volume (K Unit) Forecast, by Application 2019 & 2032
- Table 29: Rest of Europe Ion Chromatography Market Revenue (Million) Forecast, by Application 2019 & 2032
- Table 30: Rest of Europe Ion Chromatography Market Volume (K Unit) Forecast, by Application 2019 & 2032
- Table 31: Global Ion Chromatography Market Revenue Million Forecast, by Country 2019 & 2032
- Table 32: Global Ion Chromatography Market Volume K Unit Forecast, by Country 2019 & 2032
- Table 33: China Ion Chromatography Market Revenue (Million) Forecast, by Application 2019 & 2032
- Table 34: China Ion Chromatography Market Volume (K Unit) Forecast, by Application 2019 & 2032
- Table 35: Japan Ion Chromatography Market Revenue (Million) Forecast, by Application 2019 & 2032
- Table 36: Japan Ion Chromatography Market Volume (K Unit) Forecast, by Application 2019 & 2032
- Table 37: India Ion Chromatography Market Revenue (Million) Forecast, by Application 2019 & 2032
- Table 38: India Ion Chromatography Market Volume (K Unit) Forecast, by Application 2019 & 2032
- Table 39: Australia Ion Chromatography Market Revenue (Million) Forecast, by Application 2019 & 2032
- Table 40: Australia Ion Chromatography Market Volume (K Unit) Forecast, by Application 2019 & 2032
- Table 41: South korea Ion Chromatography Market Revenue (Million) Forecast, by Application 2019 & 2032
- Table 42: South korea Ion Chromatography Market Volume (K Unit) Forecast, by Application 2019 & 2032
- Table 43: Rest of Asia Pacific Ion Chromatography Market Revenue (Million) Forecast, by Application 2019 & 2032
- Table 44: Rest of Asia Pacific Ion Chromatography Market Volume (K Unit) Forecast, by Application 2019 & 2032
- Table 45: Global Ion Chromatography Market Revenue Million Forecast, by Country 2019 & 2032
- Table 46: Global Ion Chromatography Market Volume K Unit Forecast, by Country 2019 & 2032
- Table 47: GCC Ion Chromatography Market Revenue (Million) Forecast, by Application 2019 & 2032
- Table 48: GCC Ion Chromatography Market Volume (K Unit) Forecast, by Application 2019 & 2032
- Table 49: South Africa Ion Chromatography Market Revenue (Million) Forecast, by Application 2019 & 2032
- Table 50: South Africa Ion Chromatography Market Volume (K Unit) Forecast, by Application 2019 & 2032
- Table 51: Rest of Middle East and Africa Ion Chromatography Market Revenue (Million) Forecast, by Application 2019 & 2032
- Table 52: Rest of Middle East and Africa Ion Chromatography Market Volume (K Unit) Forecast, by Application 2019 & 2032
- Table 53: Global Ion Chromatography Market Revenue Million Forecast, by Country 2019 & 2032
- Table 54: Global Ion Chromatography Market Volume K Unit Forecast, by Country 2019 & 2032
- Table 55: Brazil Ion Chromatography Market Revenue (Million) Forecast, by Application 2019 & 2032
- Table 56: Brazil Ion Chromatography Market Volume (K Unit) Forecast, by Application 2019 & 2032
- Table 57: Argentina Ion Chromatography Market Revenue (Million) Forecast, by Application 2019 & 2032
- Table 58: Argentina Ion Chromatography Market Volume (K Unit) Forecast, by Application 2019 & 2032
- Table 59: Rest of South America Ion Chromatography Market Revenue (Million) Forecast, by Application 2019 & 2032
- Table 60: Rest of South America Ion Chromatography Market Volume (K Unit) Forecast, by Application 2019 & 2032
- Table 61: Global Ion Chromatography Market Revenue Million Forecast, by Technology 2019 & 2032
- Table 62: Global Ion Chromatography Market Volume K Unit Forecast, by Technology 2019 & 2032
- Table 63: Global Ion Chromatography Market Revenue Million Forecast, by Application 2019 & 2032
- Table 64: Global Ion Chromatography Market Volume K Unit Forecast, by Application 2019 & 2032
- Table 65: Global Ion Chromatography Market Revenue Million Forecast, by Country 2019 & 2032
- Table 66: Global Ion Chromatography Market Volume K Unit Forecast, by Country 2019 & 2032
- Table 67: United States Ion Chromatography Market Revenue (Million) Forecast, by Application 2019 & 2032
- Table 68: United States Ion Chromatography Market Volume (K Unit) Forecast, by Application 2019 & 2032
- Table 69: Canada Ion Chromatography Market Revenue (Million) Forecast, by Application 2019 & 2032
- Table 70: Canada Ion Chromatography Market Volume (K Unit) Forecast, by Application 2019 & 2032
- Table 71: Mexico Ion Chromatography Market Revenue (Million) Forecast, by Application 2019 & 2032
- Table 72: Mexico Ion Chromatography Market Volume (K Unit) Forecast, by Application 2019 & 2032
- Table 73: Global Ion Chromatography Market Revenue Million Forecast, by Technology 2019 & 2032
- Table 74: Global Ion Chromatography Market Volume K Unit Forecast, by Technology 2019 & 2032
- Table 75: Global Ion Chromatography Market Revenue Million Forecast, by Application 2019 & 2032
- Table 76: Global Ion Chromatography Market Volume K Unit Forecast, by Application 2019 & 2032
- Table 77: Global Ion Chromatography Market Revenue Million Forecast, by Country 2019 & 2032
- Table 78: Global Ion Chromatography Market Volume K Unit Forecast, by Country 2019 & 2032
- Table 79: Germany Ion Chromatography Market Revenue (Million) Forecast, by Application 2019 & 2032
- Table 80: Germany Ion Chromatography Market Volume (K Unit) Forecast, by Application 2019 & 2032
- Table 81: United Kingdom Ion Chromatography Market Revenue (Million) Forecast, by Application 2019 & 2032
- Table 82: United Kingdom Ion Chromatography Market Volume (K Unit) Forecast, by Application 2019 & 2032
- Table 83: France Ion Chromatography Market Revenue (Million) Forecast, by Application 2019 & 2032
- Table 84: France Ion Chromatography Market Volume (K Unit) Forecast, by Application 2019 & 2032
- Table 85: Italy Ion Chromatography Market Revenue (Million) Forecast, by Application 2019 & 2032
- Table 86: Italy Ion Chromatography Market Volume (K Unit) Forecast, by Application 2019 & 2032
- Table 87: Spain Ion Chromatography Market Revenue (Million) Forecast, by Application 2019 & 2032
- Table 88: Spain Ion Chromatography Market Volume (K Unit) Forecast, by Application 2019 & 2032
- Table 89: Rest of Europe Ion Chromatography Market Revenue (Million) Forecast, by Application 2019 & 2032
- Table 90: Rest of Europe Ion Chromatography Market Volume (K Unit) Forecast, by Application 2019 & 2032
- Table 91: Global Ion Chromatography Market Revenue Million Forecast, by Technology 2019 & 2032
- Table 92: Global Ion Chromatography Market Volume K Unit Forecast, by Technology 2019 & 2032
- Table 93: Global Ion Chromatography Market Revenue Million Forecast, by Application 2019 & 2032
- Table 94: Global Ion Chromatography Market Volume K Unit Forecast, by Application 2019 & 2032
- Table 95: Global Ion Chromatography Market Revenue Million Forecast, by Country 2019 & 2032
- Table 96: Global Ion Chromatography Market Volume K Unit Forecast, by Country 2019 & 2032
- Table 97: China Ion Chromatography Market Revenue (Million) Forecast, by Application 2019 & 2032
- Table 98: China Ion Chromatography Market Volume (K Unit) Forecast, by Application 2019 & 2032
- Table 99: Japan Ion Chromatography Market Revenue (Million) Forecast, by Application 2019 & 2032
- Table 100: Japan Ion Chromatography Market Volume (K Unit) Forecast, by Application 2019 & 2032
- Table 101: India Ion Chromatography Market Revenue (Million) Forecast, by Application 2019 & 2032
- Table 102: India Ion Chromatography Market Volume (K Unit) Forecast, by Application 2019 & 2032
- Table 103: Australia Ion Chromatography Market Revenue (Million) Forecast, by Application 2019 & 2032
- Table 104: Australia Ion Chromatography Market Volume (K Unit) Forecast, by Application 2019 & 2032
- Table 105: South korea Ion Chromatography Market Revenue (Million) Forecast, by Application 2019 & 2032
- Table 106: South korea Ion Chromatography Market Volume (K Unit) Forecast, by Application 2019 & 2032
- Table 107: Rest of Asia Pacific Ion Chromatography Market Revenue (Million) Forecast, by Application 2019 & 2032
- Table 108: Rest of Asia Pacific Ion Chromatography Market Volume (K Unit) Forecast, by Application 2019 & 2032
- Table 109: Global Ion Chromatography Market Revenue Million Forecast, by Technology 2019 & 2032
- Table 110: Global Ion Chromatography Market Volume K Unit Forecast, by Technology 2019 & 2032
- Table 111: Global Ion Chromatography Market Revenue Million Forecast, by Application 2019 & 2032
- Table 112: Global Ion Chromatography Market Volume K Unit Forecast, by Application 2019 & 2032
- Table 113: Global Ion Chromatography Market Revenue Million Forecast, by Country 2019 & 2032
- Table 114: Global Ion Chromatography Market Volume K Unit Forecast, by Country 2019 & 2032
- Table 115: GCC Ion Chromatography Market Revenue (Million) Forecast, by Application 2019 & 2032
- Table 116: GCC Ion Chromatography Market Volume (K Unit) Forecast, by Application 2019 & 2032
- Table 117: South Africa Ion Chromatography Market Revenue (Million) Forecast, by Application 2019 & 2032
- Table 118: South Africa Ion Chromatography Market Volume (K Unit) Forecast, by Application 2019 & 2032
- Table 119: Rest of Middle East and Africa Ion Chromatography Market Revenue (Million) Forecast, by Application 2019 & 2032
- Table 120: Rest of Middle East and Africa Ion Chromatography Market Volume (K Unit) Forecast, by Application 2019 & 2032
- Table 121: Global Ion Chromatography Market Revenue Million Forecast, by Technology 2019 & 2032
- Table 122: Global Ion Chromatography Market Volume K Unit Forecast, by Technology 2019 & 2032
- Table 123: Global Ion Chromatography Market Revenue Million Forecast, by Application 2019 & 2032
- Table 124: Global Ion Chromatography Market Volume K Unit Forecast, by Application 2019 & 2032
- Table 125: Global Ion Chromatography Market Revenue Million Forecast, by Country 2019 & 2032
- Table 126: Global Ion Chromatography Market Volume K Unit Forecast, by Country 2019 & 2032
- Table 127: Brazil Ion Chromatography Market Revenue (Million) Forecast, by Application 2019 & 2032
- Table 128: Brazil Ion Chromatography Market Volume (K Unit) Forecast, by Application 2019 & 2032
- Table 129: Argentina Ion Chromatography Market Revenue (Million) Forecast, by Application 2019 & 2032
- Table 130: Argentina Ion Chromatography Market Volume (K Unit) Forecast, by Application 2019 & 2032
- Table 131: Rest of South America Ion Chromatography Market Revenue (Million) Forecast, by Application 2019 & 2032
- Table 132: Rest of South America Ion Chromatography Market Volume (K Unit) Forecast, by Application 2019 & 2032
Frequently Asked Questions
1. What is the projected Compound Annual Growth Rate (CAGR) of the Ion Chromatography Market?
The projected CAGR is approximately 3.80%.
2. Which companies are prominent players in the Ion Chromatography Market?
Key companies in the market include MembraPure GmbH, Bio-Rad Laboratories Inc, Mitsubishi Chemical Corporation, GE Healthcare, Metrohm AG, Waters, Tosoh Corporation, Agilent Technologies Inc, Qingdao Shenghan, Thermo Fisher Scientific, Shimadzu Corporation, Perkin Elmer Inc.
3. What are the main segments of the Ion Chromatography Market?
The market segments include Technology, Application.
4. Can you provide details about the market size?
The market size is estimated to be USD 3.08 Million as of 2022.
5. What are some drivers contributing to market growth?
Increasing Academic and Commercial R&D Spending on Pharmaceuticals; Increasing Use of Ion Chromatography Technique in Various Fields; Technological Advancements in Ion Chromatography.
6. What are the notable trends driving market growth?
Application in Pharmaceutical Industry is Expected to Exhibit Fastest Growth Over the Forecast Period.
7. Are there any restraints impacting market growth?
High Cost of Instruments; Lack of Skilled Personnel to Handle Equipment.
8. Can you provide examples of recent developments in the market?
In June 2022, Bio-Rad launched EconoFit Chromatography Column packs, that offer various resins in a prepacked format, including mixed-mode, cation, and anion exchange resin columns, as well as a pack designed for polyhistidine protein purification
9. What pricing options are available for accessing the report?
Pricing options include single-user, multi-user, and enterprise licenses priced at USD 4750, USD 5250, and USD 8750 respectively.
10. Is the market size provided in terms of value or volume?
The market size is provided in terms of value, measured in Million and volume, measured in K Unit.
11. Are there any specific market keywords associated with the report?
Yes, the market keyword associated with the report is "Ion Chromatography Market," which aids in identifying and referencing the specific market segment covered.
12. How do I determine which pricing option suits my needs best?
The pricing options vary based on user requirements and access needs. Individual users may opt for single-user licenses, while businesses requiring broader access may choose multi-user or enterprise licenses for cost-effective access to the report.
13. Are there any additional resources or data provided in the Ion Chromatography Market report?
While the report offers comprehensive insights, it's advisable to review the specific contents or supplementary materials provided to ascertain if additional resources or data are available.
14. How can I stay updated on further developments or reports in the Ion Chromatography Market?
To stay informed about further developments, trends, and reports in the Ion Chromatography Market, consider subscribing to industry newsletters, following relevant companies and organizations, or regularly checking reputable industry news sources and publications.
Methodology
Step 1 - Identification of Relevant Samples Size from Population Database


Step 2 - Approaches for Defining Global Market Size (Value, Volume* & Price*)

Note*: In applicable scenarios
Step 3 - Data Sources
Primary Research
- Web Analytics
- Survey Reports
- Research Institute
- Latest Research Reports
- Opinion Leaders
Secondary Research
- Annual Reports
- White Paper
- Latest Press Release
- Industry Association
- Paid Database
- Investor Presentations

Step 4 - Data Triangulation
Involves using different sources of information in order to increase the validity of a study
These sources are likely to be stakeholders in a program - participants, other researchers, program staff, other community members, and so on.
Then we put all data in single framework & apply various statistical tools to find out the dynamic on the market.
During the analysis stage, feedback from the stakeholder groups would be compared to determine areas of agreement as well as areas of divergence


