Key Insights
The global iron powder market is poised for significant expansion, projected to reach a valuation of USD 6.43 Billion by 2025, with a robust Compound Annual Growth Rate (CAGR) of 5.2% throughout the forecast period of 2025-2033. This growth is primarily propelled by the increasing demand from key end-user industries such as automotive and general industrial applications. The automotive sector, in particular, is a major consumer of iron powder for components like sintered parts, friction materials, and magnetic applications, driven by trends in lightweighting and the production of advanced vehicle systems. Furthermore, the chemical industry utilizes iron powder as a catalyst and in various synthesis processes, contributing to its steady demand. The "Other End-users" segment, encompassing diverse applications in electronics, metallurgy, and more, is also anticipated to show consistent growth, reflecting the versatility and expanding utility of iron powder across multiple industrial domains.
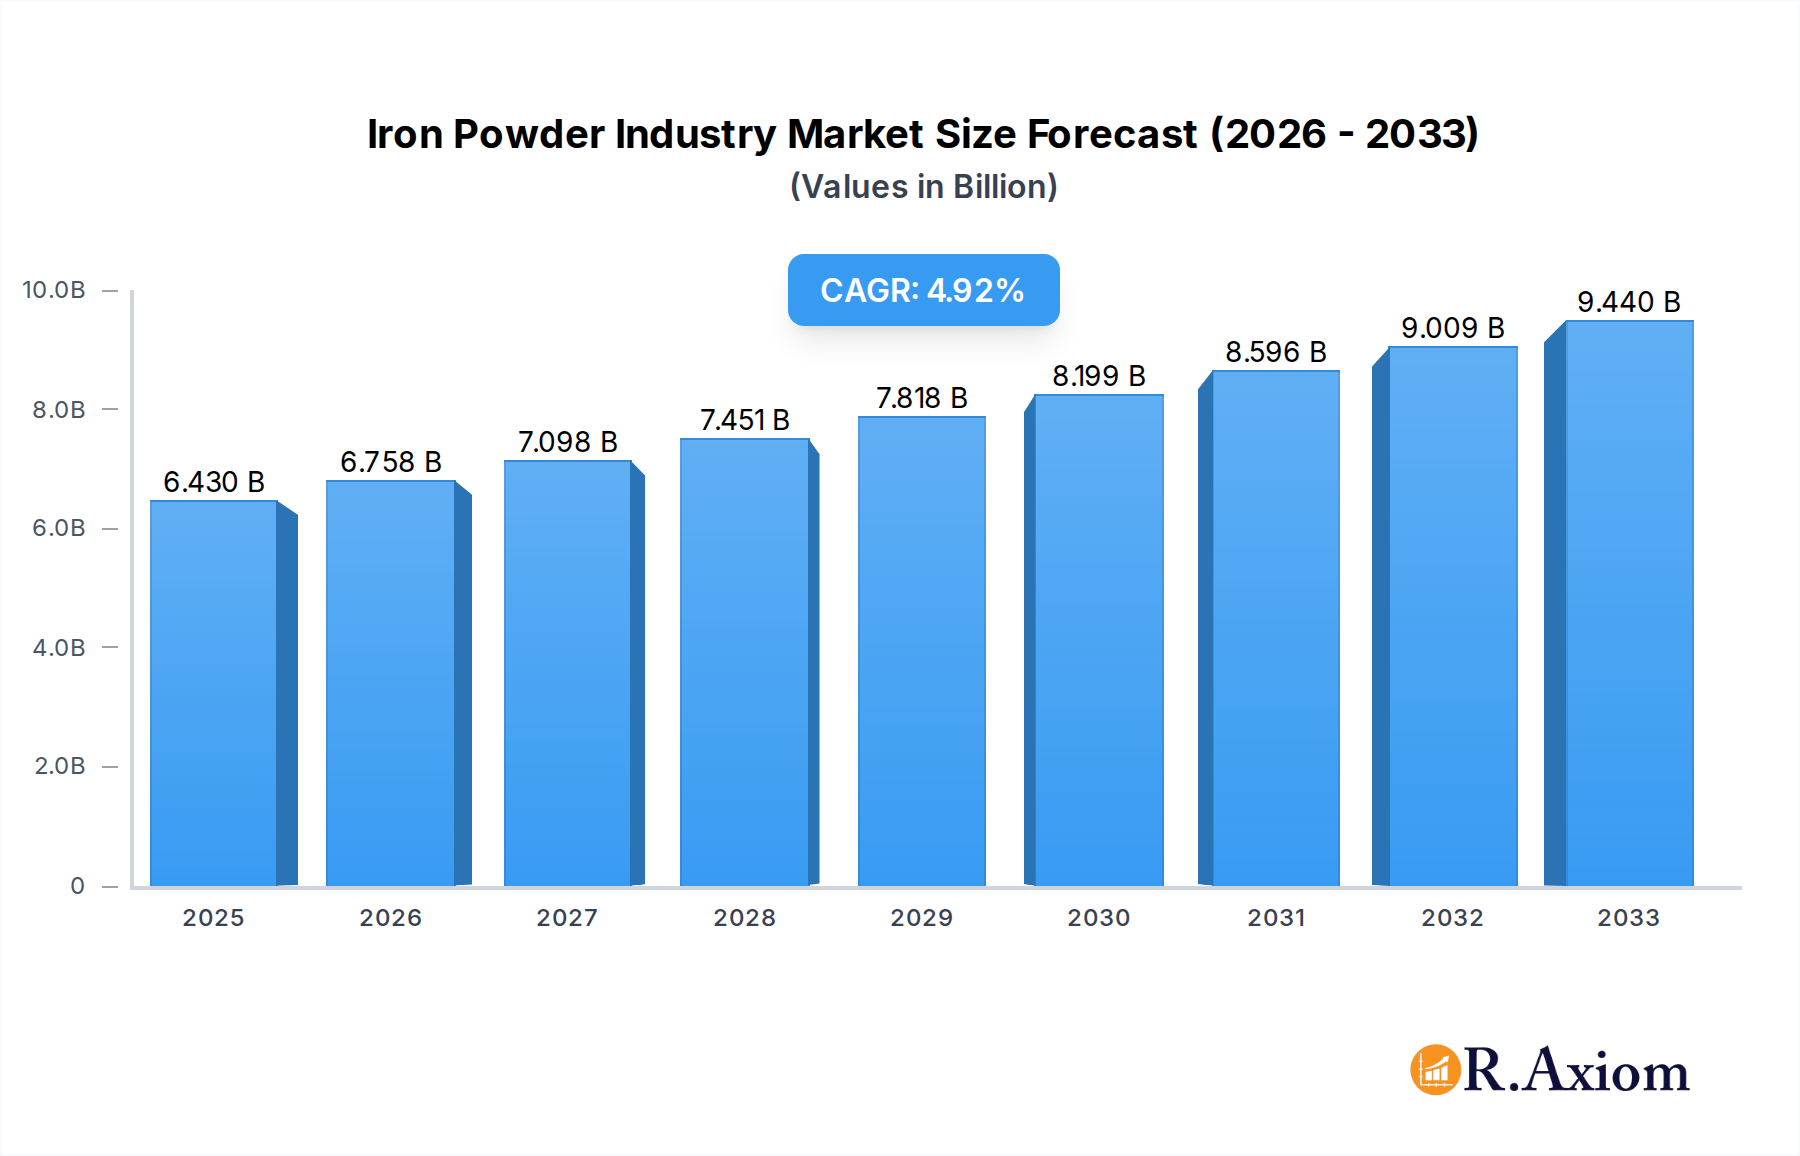
Iron Powder Industry Market Size (In Billion)
The market's expansion, however, faces certain constraints, notably fluctuating raw material prices and the capital-intensive nature of production facilities. Nevertheless, technological advancements in powder manufacturing, leading to improved purity and specialized particle characteristics, are creating new opportunities. Innovations in powder metallurgy are enabling the creation of high-performance components with enhanced strength and durability, further fueling market adoption. The market is segmented into Reduced Iron Powder, Atomized Iron Powder, and Electrolytic Iron Powder, with Reduced Iron Powder holding a significant share due to its cost-effectiveness and wide applicability. Geographically, the Asia Pacific region, led by China and India, is expected to dominate the market due to its burgeoning industrial base and substantial manufacturing output. Europe and North America also represent significant markets, driven by advanced manufacturing and a strong automotive presence.

Iron Powder Industry Company Market Share
Iron Powder Industry Market Concentration & Innovation
The global Iron Powder Industry exhibits a moderately concentrated market structure, with leading players such as Hoganas AB, American Elements, KOBE STEEL LTD, and INDUSTRIAL METAL POWDERS (INDIA) PVT LTD holding significant market share. Innovation is a key differentiator, driven by advancements in powder metallurgy, material science, and the development of specialized iron powders for emerging applications. Regulatory frameworks, particularly those concerning environmental impact and worker safety, are shaping production processes and product development. The increasing demand for lightweight and high-performance components in the automotive sector, coupled with stringent emissions standards, is a major innovation driver. Product substitutes, while present in niche applications, are generally outcompeted by the versatility and cost-effectiveness of iron powder in core segments. Mergers and acquisitions (M&A) activities, such as the recent acquisition of ISO 45001 certification by JFE Steel Corporation, indicate a focus on operational excellence and sustainability, indirectly impacting market consolidation and strategic positioning. The market share of key players is estimated to be over 70% for the top 10 companies, with M&A deal values in the past five years exceeding Billion 5,000 million.
Iron Powder Industry Industry Trends & Insights
The Iron Powder Industry is experiencing robust growth, propelled by a confluence of factors including surging demand from the automotive sector for lightweight components, the expansion of the chemical industry for catalysts and reagents, and the increasing adoption of powder metallurgy in general industrial applications. The market penetration of advanced iron powder grades, particularly for additive manufacturing and 3D printing, is on an upward trajectory, signaling a significant technological disruption. Consumer preferences are increasingly leaning towards sustainable and environmentally friendly manufacturing processes, which iron powder production, when optimized, can facilitate. The competitive dynamics are characterized by both intense price competition among established players and a race for technological superiority in developing novel powder formulations with enhanced properties like higher strength, improved corrosion resistance, and greater magnetic performance.
The study period from 2019 to 2033, with a base year of 2025, projects a Compound Annual Growth Rate (CAGR) of approximately 5.8% for the global iron powder market. This growth is underpinned by the automotive industry’s relentless pursuit of fuel efficiency and reduced emissions, leading to a greater reliance on sintered components and metal injection molding (MIM) parts derived from iron powder. Furthermore, the chemical industry's consumption of iron powder as a catalyst in various chemical reactions, including hydrogenation and oxidation, continues to be a stable demand driver.
Emerging economies, with their burgeoning manufacturing bases and infrastructure development, are also contributing significantly to market expansion. The "Other End-users" segment, encompassing applications in electronics, construction, and pharmaceuticals, is witnessing steady growth as well. Technological advancements, such as the development of finer particle sizes and spherical iron powders, are enabling new applications and improving the performance of existing ones. For instance, the development of nickel-free powders by Höganäs addresses concerns around material costs and environmental impact, opening up new avenues for component production. The market penetration of specialized iron powders for 3D printing is still nascent but holds immense future potential, with rapid advancements in printing technologies and material compatibility. The competitive landscape is a blend of global conglomerates and regional specialists, each vying for market share through product innovation, strategic partnerships, and operational efficiency. The estimated market size for 2025 is expected to reach Billion 25,000 million, with projections indicating a continued upward trend through the forecast period of 2025–2033.
Dominant Markets & Segments in Iron Powder Industry
The Iron Powder Industry's dominance is multifaceted, with distinct leaders emerging across different geographical regions and product segments.
Reduced Iron Powder
Reduced Iron Powder is a cornerstone of the industry, commanding a significant market share due to its cost-effectiveness and versatility. Its dominance is particularly pronounced in the automotive sector, where it is extensively used in the production of sintered components like gears, sprockets, and connecting rods. The economic policies favoring local manufacturing and the robust automotive production in regions like Asia-Pacific and Europe are key drivers for this segment's growth. The inherent advantages of reduced iron powder, such as its high purity and controlled particle size distribution, make it an ideal choice for achieving desired mechanical properties in sintered parts. The estimated market share of reduced iron powder is projected to be around 45% of the total iron powder market.
Atomized Iron Powder
Atomized Iron Powder, produced through water or gas atomization processes, offers superior properties like higher density and better flowability compared to reduced iron powder. This makes it indispensable for specialized applications in the chemical industry, particularly as a precursor for various chemical compounds and catalysts. The growing demand for advanced materials in the electronics sector and the increasing use of metal powders in additive manufacturing also contribute to the dominance of atomized iron powder. Countries with strong chemical manufacturing bases and a focus on technological innovation are leading the adoption of atomized iron powder. Its market share is estimated to be around 35% of the total market.
Electrolytic Iron Powder
Electrolytic Iron Powder, known for its exceptional purity and fine particle size, holds a niche yet crucial position in high-end applications. Its dominance is evident in the food industry, where it is used as a dietary supplement, and in specialized electronic components requiring high conductivity and minimal impurities. The stringent quality control and regulatory approvals in these sectors bolster the demand for electrolytic iron powder. While its overall market share is smaller, estimated at 20%, its premium pricing and specialized applications ensure sustained demand.
Automotive End-User Segment
The automotive industry unequivocally stands as the dominant end-user segment for iron powder. The global push towards lightweighting vehicles for improved fuel efficiency and reduced emissions has propelled the adoption of powder metallurgy in automotive component manufacturing. From engine parts to structural components, iron powder-based parts offer a compelling combination of performance, cost-effectiveness, and design flexibility. The presence of major automotive manufacturing hubs in North America, Europe, and Asia-Pacific solidifies this segment's leading position. Infrastructure development supporting automotive production and favorable trade policies further enhance its dominance.
Chemical End-User Segment
The chemical industry represents another significant and growing end-user segment. Iron powder serves as a vital raw material and catalyst in numerous chemical processes, including the production of fertilizers, dyes, and pharmaceuticals. The expansion of global chemical manufacturing, coupled with the demand for more efficient and sustainable chemical synthesis, fuels the consumption of iron powder. Investments in research and development for new catalytic applications are also driving growth in this segment.
General Industrial End-User Segment
The general industrial segment encompasses a broad range of applications, including welding consumables, magnetic materials, and abrasive products. The steady growth of manufacturing activities across various industries globally contributes to the consistent demand for iron powder in this segment. The development of new industrial processes and the increasing need for specialized materials continue to expand the applications for iron powder within this segment.
Food End-User Segment
While smaller in volume, the food industry's demand for high-purity iron powder as a nutritional supplement is a stable and growing market. Stringent food safety regulations and increasing consumer awareness about iron deficiency anemia are key drivers. The ability to produce iron powder with exceptional purity and bioavailability is crucial for dominance in this segment.
Other End-users
The "Other End-users" category, comprising emerging applications in areas like additive manufacturing, 3D printing, and specialized construction materials, represents a significant growth frontier. As new technologies mature and their adoption increases, the demand for iron powder in these innovative applications is expected to surge, presenting substantial opportunities for market expansion.
Iron Powder Industry Product Developments
Recent product developments in the Iron Powder Industry are centered on enhancing performance, sustainability, and expanding application ranges. Höganäs' development of nickel-free powders for component production exemplifies a significant innovation aimed at reducing both cost and environmental impact, addressing growing market concerns. These advancements, coupled with ongoing research into novel atomization techniques and powder treatments, are creating iron powders with improved mechanical properties, finer particle sizes, and enhanced flow characteristics. The competitive advantage lies in offering tailored solutions for specific industry needs, particularly in the burgeoning additive manufacturing sector and in applications demanding greater material efficiency and reduced carbon footprints. These innovations are crucial for market penetration in specialized, high-value applications.
Report Scope & Segmentation Analysis
This report provides a comprehensive analysis of the Iron Powder Industry, encompassing key segments by type and end-user. The segmentation by Type includes Reduced Iron Powder, Atomized Iron Powder, and Electrolytic Iron Powder. Each type is analyzed for its market size, growth projections, and competitive dynamics, with Reduced Iron Powder expected to lead in volume due to its widespread use in automotive and general industrial applications. Atomized Iron Powder is projected for significant growth driven by its applications in chemical processes and additive manufacturing. Electrolytic Iron Powder, while niche, is forecast to maintain stable growth in high-purity applications.
The segmentation by End-User covers Automotive, Chemical, General Industrial, Food, and Other End-users. The Automotive segment is anticipated to retain its dominant position, fueled by the ongoing demand for lightweight components. The Chemical segment is set for robust expansion due to its role in catalysis and material synthesis. General Industrial applications will see consistent growth, while the Food segment will experience steady demand for nutritional fortification. The "Other End-users" category, including emerging fields like additive manufacturing, is projected to exhibit the highest growth rates, signifying future market opportunities.
Key Drivers of Iron Powder Industry Growth
The Iron Powder Industry's growth is propelled by several key drivers. Technologically, advancements in powder metallurgy and additive manufacturing are opening up new high-value applications. Economically, the burgeoning automotive sector's demand for lightweight and fuel-efficient components is a major catalyst. Infrastructure development in emerging economies also fuels demand from general industrial sectors. Regulatory factors, such as stringent emissions standards for vehicles, indirectly encourage the use of powder metallurgy solutions. The increasing focus on sustainable manufacturing practices also favors the use of iron powder, which can be produced and utilized in resource-efficient ways.
Challenges in the Iron Powder Industry Sector
Despite robust growth, the Iron Powder Industry faces several challenges. Fluctuations in raw material prices, particularly iron ore, can impact production costs and profitability. Intense competition from established players and the potential for substitute materials in certain applications exert pricing pressures. Regulatory hurdles related to environmental compliance and safety standards require continuous investment in advanced manufacturing technologies. Furthermore, ensuring consistent quality and supply chain resilience in a globalized market can be complex. The capital-intensive nature of advanced powder production also presents a barrier to entry for smaller players.
Emerging Opportunities in Iron Powder Industry
The Iron Powder Industry is ripe with emerging opportunities. The rapid growth of additive manufacturing presents a significant frontier, with a growing demand for specialized iron powders with precise characteristics for 3D printing of complex parts. The increasing focus on electric vehicles (EVs) is also creating new opportunities for iron powder in components for EV powertrains and battery housings. Furthermore, advancements in medical applications, such as biocompatible iron implants, represent a high-growth, niche market. The development of advanced composite materials incorporating iron powder is another area with substantial potential for innovation and market expansion.
Leading Players in the Iron Powder Industry Market
- Hoganas AB
- American Elements
- KOBE STEEL LTD
- INDUSTRIAL METAL POWDERS (INDIA) PVT LTD
- Laiwu Iron & Steel Group Lunan Mining Co Ltd
- ATI
- Ashland
- Belmont Metals
- BASF SE
- Rio Tinto Metal Powders
- CNPC POWDER
- JFE Steel Corporation
- Pometon Powder
Key Developments in Iron Powder Industry Industry
- January 2023: JFE Steel completed the acquisition of the ISO 45001 certification, an international standard for occupational health and safety management systems, for all of its Japan operations. This development underscores a commitment to operational safety and environmental responsibility, influencing market perception and competitive positioning.
- January 2023: Höganäs developed nickel-free powders for component production. The new nickel-free powder can potentially reduce price and the harmful environmental impact. This innovation addresses market demand for cost-effective and sustainable material solutions, potentially opening new applications and expanding market reach.
Strategic Outlook for Iron Powder Industry Market
The strategic outlook for the Iron Powder Industry remains highly positive, driven by innovation and expanding application horizons. The increasing adoption of powder metallurgy in critical sectors like automotive and additive manufacturing will continue to be the primary growth catalyst. Strategic investments in research and development for next-generation powders, focusing on enhanced mechanical properties, sustainability, and cost-effectiveness, will be crucial for competitive advantage. Furthermore, forging strategic alliances and pursuing targeted M&A activities will enable players to broaden their product portfolios and geographic reach. The industry's ability to adapt to evolving environmental regulations and capitalize on the burgeoning demand for lightweight, high-performance materials will define its future success.
Iron Powder Industry Segmentation
-
1. Type
- 1.1. Reduced Iron Powder
- 1.2. Atomized Iron Powder
- 1.3. Electrolytic Iron Powder
-
2. End-User
- 2.1. Automotive
- 2.2. Chemical
- 2.3. General Industrial
- 2.4. Food
- 2.5. Other End-users
Iron Powder Industry Segmentation By Geography
-
1. Asia Pacific
- 1.1. China
- 1.2. India
- 1.3. Japan
- 1.4. South Korea
- 1.5. Rest of Asia Pacific
-
2. North America
- 2.1. United States
- 2.2. Canada
- 2.3. Mexico
-
3. Europe
- 3.1. United Kingdom
- 3.2. France
- 3.3. Germany
- 3.4. Italy
- 3.5. Rest of Europe
-
4. South America
- 4.1. Brazil
- 4.2. Argentina
- 4.3. Rest of South America
-
5. Middle East and Africa
- 5.1. Saudi Arabia
- 5.2. South Africa
- 5.3. Rest of Middle East and Africa
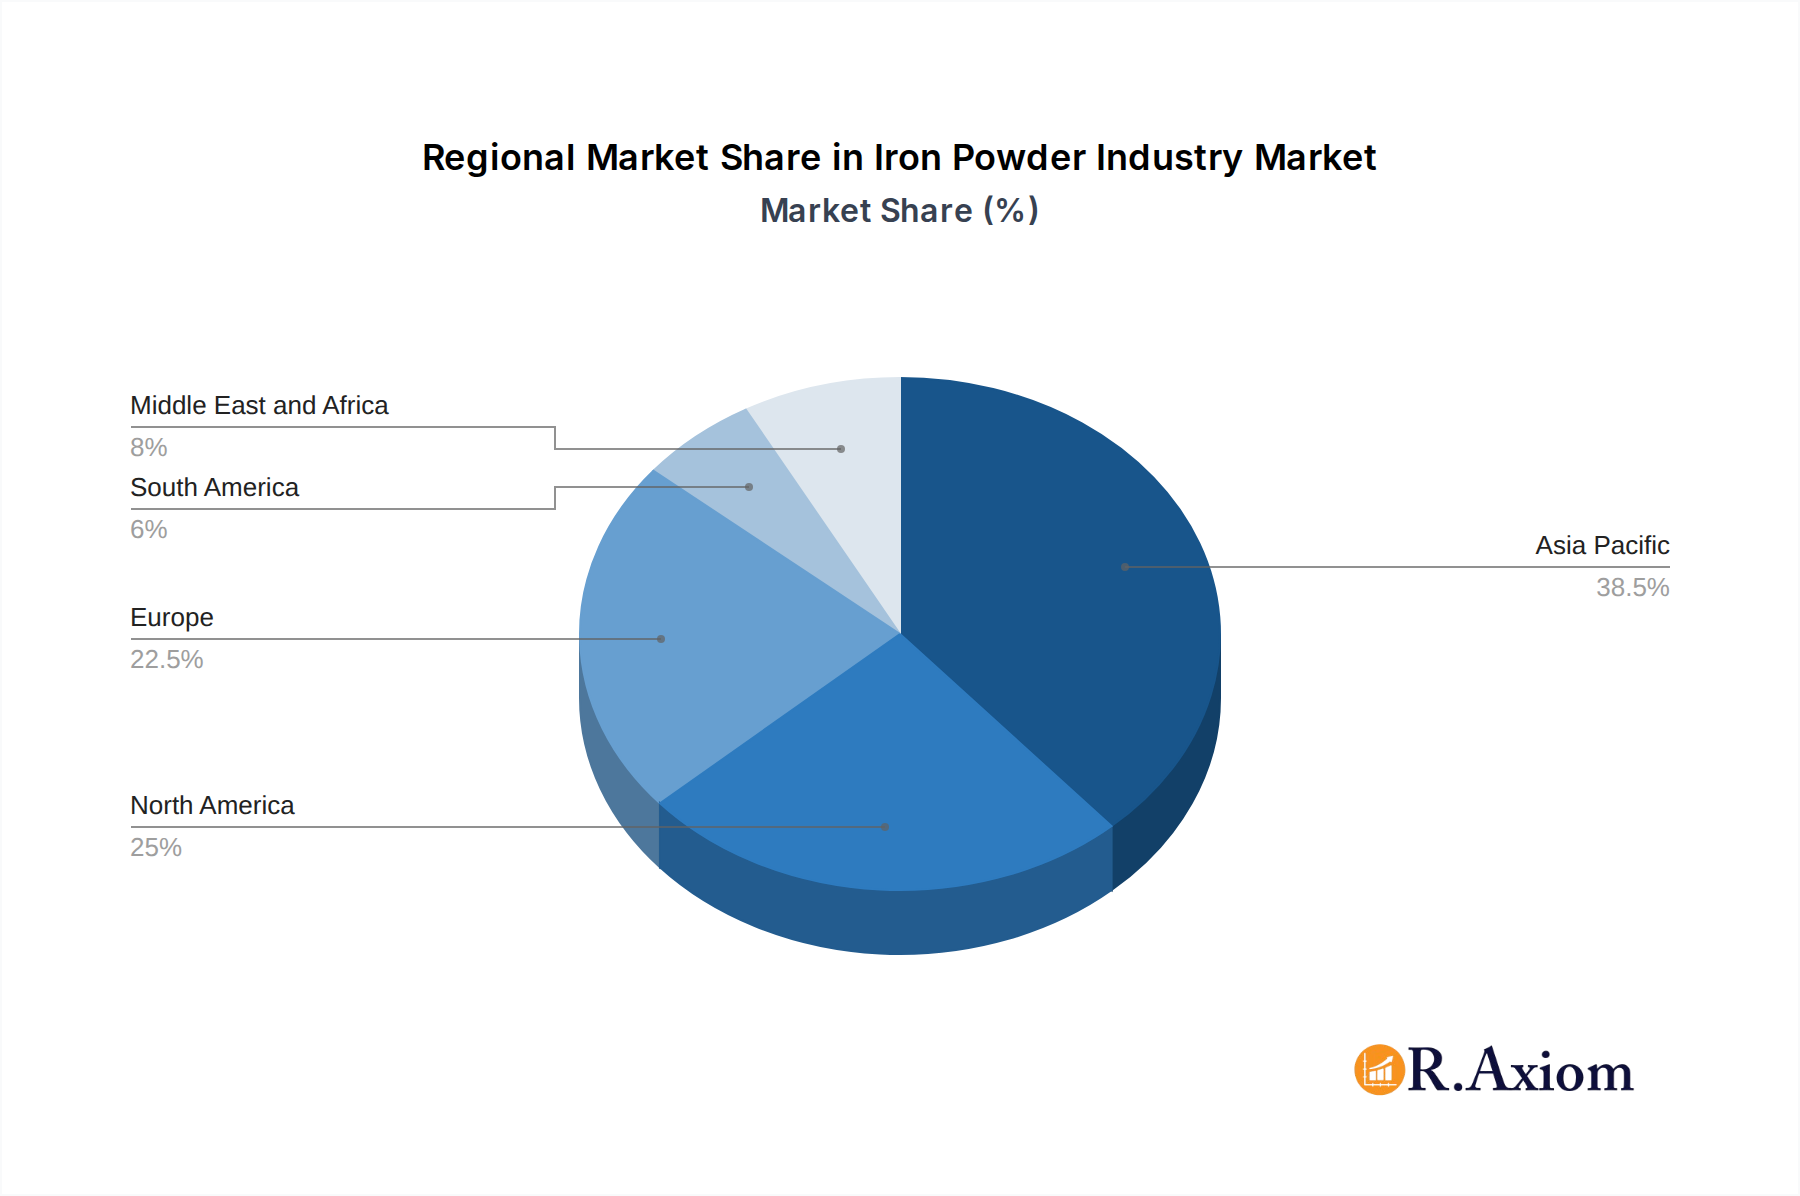
Iron Powder Industry Regional Market Share
Geographic Coverage of Iron Powder Industry
Iron Powder Industry REPORT HIGHLIGHTS
| Aspects | Details |
|---|---|
| Study Period | 2020-2034 |
| Base Year | 2025 |
| Estimated Year | 2026 |
| Forecast Period | 2026-2034 |
| Historical Period | 2020-2025 |
| Growth Rate | CAGR of 5.2% from 2020-2034 |
| Segmentation |
|
Table of Contents
- 1. Introduction
- 1.1. Research Scope
- 1.2. Market Segmentation
- 1.3. Research Objective
- 1.4. Definitions and Assumptions
- 2. Executive Summary
- 2.1. Market Snapshot
- 3. Market Dynamics
- 3.1. Market Drivers
- 3.2. Market Restrains
- 3.3. Market Trends
- 3.4. Market Opportunities
- 4. Market Factor Analysis
- 4.1. Porters Five Forces
- 4.1.1. Bargaining Power of Suppliers
- 4.1.2. Bargaining Power of Buyers
- 4.1.3. Threat of New Entrants
- 4.1.4. Threat of Substitutes
- 4.1.5. Competitive Rivalry
- 4.2. PESTEL analysis
- 4.3. BCG Analysis
- 4.3.1. Stars (High Growth, High Market Share)
- 4.3.2. Cash Cows (Low Growth, High Market Share)
- 4.3.3. Question Mark (High Growth, Low Market Share)
- 4.3.4. Dogs (Low Growth, Low Market Share)
- 4.4. Ansoff Matrix Analysis
- 4.5. Supply Chain Analysis
- 4.6. Regulatory Landscape
- 4.7. Current Market Potential and Opportunity Assessment (TAM–SAM–SOM Framework)
- 4.8. RAX Analyst Note
- 4.1. Porters Five Forces
- 5. Market Analysis, Insights and Forecast 2021-2033
- 5.1. Market Analysis, Insights and Forecast - by Type
- 5.1.1. Reduced Iron Powder
- 5.1.2. Atomized Iron Powder
- 5.1.3. Electrolytic Iron Powder
- 5.2. Market Analysis, Insights and Forecast - by End-User
- 5.2.1. Automotive
- 5.2.2. Chemical
- 5.2.3. General Industrial
- 5.2.4. Food
- 5.2.5. Other End-users
- 5.3. Market Analysis, Insights and Forecast - by Region
- 5.3.1. Asia Pacific
- 5.3.2. North America
- 5.3.3. Europe
- 5.3.4. South America
- 5.3.5. Middle East and Africa
- 5.1. Market Analysis, Insights and Forecast - by Type
- 6. Global Iron Powder Industry Analysis, Insights and Forecast, 2021-2033
- 6.1. Market Analysis, Insights and Forecast - by Type
- 6.1.1. Reduced Iron Powder
- 6.1.2. Atomized Iron Powder
- 6.1.3. Electrolytic Iron Powder
- 6.2. Market Analysis, Insights and Forecast - by End-User
- 6.2.1. Automotive
- 6.2.2. Chemical
- 6.2.3. General Industrial
- 6.2.4. Food
- 6.2.5. Other End-users
- 6.1. Market Analysis, Insights and Forecast - by Type
- 7. Asia Pacific Iron Powder Industry Analysis, Insights and Forecast, 2020-2032
- 7.1. Market Analysis, Insights and Forecast - by Type
- 7.1.1. Reduced Iron Powder
- 7.1.2. Atomized Iron Powder
- 7.1.3. Electrolytic Iron Powder
- 7.2. Market Analysis, Insights and Forecast - by End-User
- 7.2.1. Automotive
- 7.2.2. Chemical
- 7.2.3. General Industrial
- 7.2.4. Food
- 7.2.5. Other End-users
- 7.1. Market Analysis, Insights and Forecast - by Type
- 8. North America Iron Powder Industry Analysis, Insights and Forecast, 2020-2032
- 8.1. Market Analysis, Insights and Forecast - by Type
- 8.1.1. Reduced Iron Powder
- 8.1.2. Atomized Iron Powder
- 8.1.3. Electrolytic Iron Powder
- 8.2. Market Analysis, Insights and Forecast - by End-User
- 8.2.1. Automotive
- 8.2.2. Chemical
- 8.2.3. General Industrial
- 8.2.4. Food
- 8.2.5. Other End-users
- 8.1. Market Analysis, Insights and Forecast - by Type
- 9. Europe Iron Powder Industry Analysis, Insights and Forecast, 2020-2032
- 9.1. Market Analysis, Insights and Forecast - by Type
- 9.1.1. Reduced Iron Powder
- 9.1.2. Atomized Iron Powder
- 9.1.3. Electrolytic Iron Powder
- 9.2. Market Analysis, Insights and Forecast - by End-User
- 9.2.1. Automotive
- 9.2.2. Chemical
- 9.2.3. General Industrial
- 9.2.4. Food
- 9.2.5. Other End-users
- 9.1. Market Analysis, Insights and Forecast - by Type
- 10. South America Iron Powder Industry Analysis, Insights and Forecast, 2020-2032
- 10.1. Market Analysis, Insights and Forecast - by Type
- 10.1.1. Reduced Iron Powder
- 10.1.2. Atomized Iron Powder
- 10.1.3. Electrolytic Iron Powder
- 10.2. Market Analysis, Insights and Forecast - by End-User
- 10.2.1. Automotive
- 10.2.2. Chemical
- 10.2.3. General Industrial
- 10.2.4. Food
- 10.2.5. Other End-users
- 10.1. Market Analysis, Insights and Forecast - by Type
- 11. Middle East and Africa Iron Powder Industry Analysis, Insights and Forecast, 2020-2032
- 11.1. Market Analysis, Insights and Forecast - by Type
- 11.1.1. Reduced Iron Powder
- 11.1.2. Atomized Iron Powder
- 11.1.3. Electrolytic Iron Powder
- 11.2. Market Analysis, Insights and Forecast - by End-User
- 11.2.1. Automotive
- 11.2.2. Chemical
- 11.2.3. General Industrial
- 11.2.4. Food
- 11.2.5. Other End-users
- 11.1. Market Analysis, Insights and Forecast - by Type
- 12. Competitive Analysis
- 12.1. Company Profiles
- 12.1.1 Hoganas AB
- 12.1.1.1. Company Overview
- 12.1.1.2. Products
- 12.1.1.3. Company Financials
- 12.1.1.4. SWOT Analysis
- 12.1.2 American Elements
- 12.1.2.1. Company Overview
- 12.1.2.2. Products
- 12.1.2.3. Company Financials
- 12.1.2.4. SWOT Analysis
- 12.1.3 KOBE STEEL LTD
- 12.1.3.1. Company Overview
- 12.1.3.2. Products
- 12.1.3.3. Company Financials
- 12.1.3.4. SWOT Analysis
- 12.1.4 INDUSTRIAL METAL POWDERS (INDIA) PVT LTD
- 12.1.4.1. Company Overview
- 12.1.4.2. Products
- 12.1.4.3. Company Financials
- 12.1.4.4. SWOT Analysis
- 12.1.5 Laiwu Iron & Steel Group Lunan Mining Co Ltd
- 12.1.5.1. Company Overview
- 12.1.5.2. Products
- 12.1.5.3. Company Financials
- 12.1.5.4. SWOT Analysis
- 12.1.6 ATI
- 12.1.6.1. Company Overview
- 12.1.6.2. Products
- 12.1.6.3. Company Financials
- 12.1.6.4. SWOT Analysis
- 12.1.7 Ashland
- 12.1.7.1. Company Overview
- 12.1.7.2. Products
- 12.1.7.3. Company Financials
- 12.1.7.4. SWOT Analysis
- 12.1.8 Belmont Metals
- 12.1.8.1. Company Overview
- 12.1.8.2. Products
- 12.1.8.3. Company Financials
- 12.1.8.4. SWOT Analysis
- 12.1.9 BASF SE
- 12.1.9.1. Company Overview
- 12.1.9.2. Products
- 12.1.9.3. Company Financials
- 12.1.9.4. SWOT Analysis
- 12.1.10 Rio Tinto Metal Powders
- 12.1.10.1. Company Overview
- 12.1.10.2. Products
- 12.1.10.3. Company Financials
- 12.1.10.4. SWOT Analysis
- 12.1.11 CNPC POWDER
- 12.1.11.1. Company Overview
- 12.1.11.2. Products
- 12.1.11.3. Company Financials
- 12.1.11.4. SWOT Analysis
- 12.1.12 JFE Steel Corporation
- 12.1.12.1. Company Overview
- 12.1.12.2. Products
- 12.1.12.3. Company Financials
- 12.1.12.4. SWOT Analysis
- 12.1.13 Pometon Powder
- 12.1.13.1. Company Overview
- 12.1.13.2. Products
- 12.1.13.3. Company Financials
- 12.1.13.4. SWOT Analysis
- 12.1.1 Hoganas AB
- 12.2. Market Entropy
- 12.2.1 Company's Key Areas Served
- 12.2.2 Recent Developments
- 12.3. Company Market Share Analysis 2025
- 12.3.1 Top 5 Companies Market Share Analysis
- 12.3.2 Top 3 Companies Market Share Analysis
- 12.4. List of Potential Customers
- 13. Research Methodology
List of Figures
- Figure 1: Global Iron Powder Industry Revenue Breakdown (Billion, %) by Region 2025 & 2033
- Figure 2: Global Iron Powder Industry Volume Breakdown (K Tons, %) by Region 2025 & 2033
- Figure 3: Asia Pacific Iron Powder Industry Revenue (Billion), by Type 2025 & 2033
- Figure 4: Asia Pacific Iron Powder Industry Volume (K Tons), by Type 2025 & 2033
- Figure 5: Asia Pacific Iron Powder Industry Revenue Share (%), by Type 2025 & 2033
- Figure 6: Asia Pacific Iron Powder Industry Volume Share (%), by Type 2025 & 2033
- Figure 7: Asia Pacific Iron Powder Industry Revenue (Billion), by End-User 2025 & 2033
- Figure 8: Asia Pacific Iron Powder Industry Volume (K Tons), by End-User 2025 & 2033
- Figure 9: Asia Pacific Iron Powder Industry Revenue Share (%), by End-User 2025 & 2033
- Figure 10: Asia Pacific Iron Powder Industry Volume Share (%), by End-User 2025 & 2033
- Figure 11: Asia Pacific Iron Powder Industry Revenue (Billion), by Country 2025 & 2033
- Figure 12: Asia Pacific Iron Powder Industry Volume (K Tons), by Country 2025 & 2033
- Figure 13: Asia Pacific Iron Powder Industry Revenue Share (%), by Country 2025 & 2033
- Figure 14: Asia Pacific Iron Powder Industry Volume Share (%), by Country 2025 & 2033
- Figure 15: North America Iron Powder Industry Revenue (Billion), by Type 2025 & 2033
- Figure 16: North America Iron Powder Industry Volume (K Tons), by Type 2025 & 2033
- Figure 17: North America Iron Powder Industry Revenue Share (%), by Type 2025 & 2033
- Figure 18: North America Iron Powder Industry Volume Share (%), by Type 2025 & 2033
- Figure 19: North America Iron Powder Industry Revenue (Billion), by End-User 2025 & 2033
- Figure 20: North America Iron Powder Industry Volume (K Tons), by End-User 2025 & 2033
- Figure 21: North America Iron Powder Industry Revenue Share (%), by End-User 2025 & 2033
- Figure 22: North America Iron Powder Industry Volume Share (%), by End-User 2025 & 2033
- Figure 23: North America Iron Powder Industry Revenue (Billion), by Country 2025 & 2033
- Figure 24: North America Iron Powder Industry Volume (K Tons), by Country 2025 & 2033
- Figure 25: North America Iron Powder Industry Revenue Share (%), by Country 2025 & 2033
- Figure 26: North America Iron Powder Industry Volume Share (%), by Country 2025 & 2033
- Figure 27: Europe Iron Powder Industry Revenue (Billion), by Type 2025 & 2033
- Figure 28: Europe Iron Powder Industry Volume (K Tons), by Type 2025 & 2033
- Figure 29: Europe Iron Powder Industry Revenue Share (%), by Type 2025 & 2033
- Figure 30: Europe Iron Powder Industry Volume Share (%), by Type 2025 & 2033
- Figure 31: Europe Iron Powder Industry Revenue (Billion), by End-User 2025 & 2033
- Figure 32: Europe Iron Powder Industry Volume (K Tons), by End-User 2025 & 2033
- Figure 33: Europe Iron Powder Industry Revenue Share (%), by End-User 2025 & 2033
- Figure 34: Europe Iron Powder Industry Volume Share (%), by End-User 2025 & 2033
- Figure 35: Europe Iron Powder Industry Revenue (Billion), by Country 2025 & 2033
- Figure 36: Europe Iron Powder Industry Volume (K Tons), by Country 2025 & 2033
- Figure 37: Europe Iron Powder Industry Revenue Share (%), by Country 2025 & 2033
- Figure 38: Europe Iron Powder Industry Volume Share (%), by Country 2025 & 2033
- Figure 39: South America Iron Powder Industry Revenue (Billion), by Type 2025 & 2033
- Figure 40: South America Iron Powder Industry Volume (K Tons), by Type 2025 & 2033
- Figure 41: South America Iron Powder Industry Revenue Share (%), by Type 2025 & 2033
- Figure 42: South America Iron Powder Industry Volume Share (%), by Type 2025 & 2033
- Figure 43: South America Iron Powder Industry Revenue (Billion), by End-User 2025 & 2033
- Figure 44: South America Iron Powder Industry Volume (K Tons), by End-User 2025 & 2033
- Figure 45: South America Iron Powder Industry Revenue Share (%), by End-User 2025 & 2033
- Figure 46: South America Iron Powder Industry Volume Share (%), by End-User 2025 & 2033
- Figure 47: South America Iron Powder Industry Revenue (Billion), by Country 2025 & 2033
- Figure 48: South America Iron Powder Industry Volume (K Tons), by Country 2025 & 2033
- Figure 49: South America Iron Powder Industry Revenue Share (%), by Country 2025 & 2033
- Figure 50: South America Iron Powder Industry Volume Share (%), by Country 2025 & 2033
- Figure 51: Middle East and Africa Iron Powder Industry Revenue (Billion), by Type 2025 & 2033
- Figure 52: Middle East and Africa Iron Powder Industry Volume (K Tons), by Type 2025 & 2033
- Figure 53: Middle East and Africa Iron Powder Industry Revenue Share (%), by Type 2025 & 2033
- Figure 54: Middle East and Africa Iron Powder Industry Volume Share (%), by Type 2025 & 2033
- Figure 55: Middle East and Africa Iron Powder Industry Revenue (Billion), by End-User 2025 & 2033
- Figure 56: Middle East and Africa Iron Powder Industry Volume (K Tons), by End-User 2025 & 2033
- Figure 57: Middle East and Africa Iron Powder Industry Revenue Share (%), by End-User 2025 & 2033
- Figure 58: Middle East and Africa Iron Powder Industry Volume Share (%), by End-User 2025 & 2033
- Figure 59: Middle East and Africa Iron Powder Industry Revenue (Billion), by Country 2025 & 2033
- Figure 60: Middle East and Africa Iron Powder Industry Volume (K Tons), by Country 2025 & 2033
- Figure 61: Middle East and Africa Iron Powder Industry Revenue Share (%), by Country 2025 & 2033
- Figure 62: Middle East and Africa Iron Powder Industry Volume Share (%), by Country 2025 & 2033
List of Tables
- Table 1: Global Iron Powder Industry Revenue Billion Forecast, by Type 2020 & 2033
- Table 2: Global Iron Powder Industry Volume K Tons Forecast, by Type 2020 & 2033
- Table 3: Global Iron Powder Industry Revenue Billion Forecast, by End-User 2020 & 2033
- Table 4: Global Iron Powder Industry Volume K Tons Forecast, by End-User 2020 & 2033
- Table 5: Global Iron Powder Industry Revenue Billion Forecast, by Region 2020 & 2033
- Table 6: Global Iron Powder Industry Volume K Tons Forecast, by Region 2020 & 2033
- Table 7: Global Iron Powder Industry Revenue Billion Forecast, by Type 2020 & 2033
- Table 8: Global Iron Powder Industry Volume K Tons Forecast, by Type 2020 & 2033
- Table 9: Global Iron Powder Industry Revenue Billion Forecast, by End-User 2020 & 2033
- Table 10: Global Iron Powder Industry Volume K Tons Forecast, by End-User 2020 & 2033
- Table 11: Global Iron Powder Industry Revenue Billion Forecast, by Country 2020 & 2033
- Table 12: Global Iron Powder Industry Volume K Tons Forecast, by Country 2020 & 2033
- Table 13: China Iron Powder Industry Revenue (Billion) Forecast, by Application 2020 & 2033
- Table 14: China Iron Powder Industry Volume (K Tons) Forecast, by Application 2020 & 2033
- Table 15: India Iron Powder Industry Revenue (Billion) Forecast, by Application 2020 & 2033
- Table 16: India Iron Powder Industry Volume (K Tons) Forecast, by Application 2020 & 2033
- Table 17: Japan Iron Powder Industry Revenue (Billion) Forecast, by Application 2020 & 2033
- Table 18: Japan Iron Powder Industry Volume (K Tons) Forecast, by Application 2020 & 2033
- Table 19: South Korea Iron Powder Industry Revenue (Billion) Forecast, by Application 2020 & 2033
- Table 20: South Korea Iron Powder Industry Volume (K Tons) Forecast, by Application 2020 & 2033
- Table 21: Rest of Asia Pacific Iron Powder Industry Revenue (Billion) Forecast, by Application 2020 & 2033
- Table 22: Rest of Asia Pacific Iron Powder Industry Volume (K Tons) Forecast, by Application 2020 & 2033
- Table 23: Global Iron Powder Industry Revenue Billion Forecast, by Type 2020 & 2033
- Table 24: Global Iron Powder Industry Volume K Tons Forecast, by Type 2020 & 2033
- Table 25: Global Iron Powder Industry Revenue Billion Forecast, by End-User 2020 & 2033
- Table 26: Global Iron Powder Industry Volume K Tons Forecast, by End-User 2020 & 2033
- Table 27: Global Iron Powder Industry Revenue Billion Forecast, by Country 2020 & 2033
- Table 28: Global Iron Powder Industry Volume K Tons Forecast, by Country 2020 & 2033
- Table 29: United States Iron Powder Industry Revenue (Billion) Forecast, by Application 2020 & 2033
- Table 30: United States Iron Powder Industry Volume (K Tons) Forecast, by Application 2020 & 2033
- Table 31: Canada Iron Powder Industry Revenue (Billion) Forecast, by Application 2020 & 2033
- Table 32: Canada Iron Powder Industry Volume (K Tons) Forecast, by Application 2020 & 2033
- Table 33: Mexico Iron Powder Industry Revenue (Billion) Forecast, by Application 2020 & 2033
- Table 34: Mexico Iron Powder Industry Volume (K Tons) Forecast, by Application 2020 & 2033
- Table 35: Global Iron Powder Industry Revenue Billion Forecast, by Type 2020 & 2033
- Table 36: Global Iron Powder Industry Volume K Tons Forecast, by Type 2020 & 2033
- Table 37: Global Iron Powder Industry Revenue Billion Forecast, by End-User 2020 & 2033
- Table 38: Global Iron Powder Industry Volume K Tons Forecast, by End-User 2020 & 2033
- Table 39: Global Iron Powder Industry Revenue Billion Forecast, by Country 2020 & 2033
- Table 40: Global Iron Powder Industry Volume K Tons Forecast, by Country 2020 & 2033
- Table 41: United Kingdom Iron Powder Industry Revenue (Billion) Forecast, by Application 2020 & 2033
- Table 42: United Kingdom Iron Powder Industry Volume (K Tons) Forecast, by Application 2020 & 2033
- Table 43: France Iron Powder Industry Revenue (Billion) Forecast, by Application 2020 & 2033
- Table 44: France Iron Powder Industry Volume (K Tons) Forecast, by Application 2020 & 2033
- Table 45: Germany Iron Powder Industry Revenue (Billion) Forecast, by Application 2020 & 2033
- Table 46: Germany Iron Powder Industry Volume (K Tons) Forecast, by Application 2020 & 2033
- Table 47: Italy Iron Powder Industry Revenue (Billion) Forecast, by Application 2020 & 2033
- Table 48: Italy Iron Powder Industry Volume (K Tons) Forecast, by Application 2020 & 2033
- Table 49: Rest of Europe Iron Powder Industry Revenue (Billion) Forecast, by Application 2020 & 2033
- Table 50: Rest of Europe Iron Powder Industry Volume (K Tons) Forecast, by Application 2020 & 2033
- Table 51: Global Iron Powder Industry Revenue Billion Forecast, by Type 2020 & 2033
- Table 52: Global Iron Powder Industry Volume K Tons Forecast, by Type 2020 & 2033
- Table 53: Global Iron Powder Industry Revenue Billion Forecast, by End-User 2020 & 2033
- Table 54: Global Iron Powder Industry Volume K Tons Forecast, by End-User 2020 & 2033
- Table 55: Global Iron Powder Industry Revenue Billion Forecast, by Country 2020 & 2033
- Table 56: Global Iron Powder Industry Volume K Tons Forecast, by Country 2020 & 2033
- Table 57: Brazil Iron Powder Industry Revenue (Billion) Forecast, by Application 2020 & 2033
- Table 58: Brazil Iron Powder Industry Volume (K Tons) Forecast, by Application 2020 & 2033
- Table 59: Argentina Iron Powder Industry Revenue (Billion) Forecast, by Application 2020 & 2033
- Table 60: Argentina Iron Powder Industry Volume (K Tons) Forecast, by Application 2020 & 2033
- Table 61: Rest of South America Iron Powder Industry Revenue (Billion) Forecast, by Application 2020 & 2033
- Table 62: Rest of South America Iron Powder Industry Volume (K Tons) Forecast, by Application 2020 & 2033
- Table 63: Global Iron Powder Industry Revenue Billion Forecast, by Type 2020 & 2033
- Table 64: Global Iron Powder Industry Volume K Tons Forecast, by Type 2020 & 2033
- Table 65: Global Iron Powder Industry Revenue Billion Forecast, by End-User 2020 & 2033
- Table 66: Global Iron Powder Industry Volume K Tons Forecast, by End-User 2020 & 2033
- Table 67: Global Iron Powder Industry Revenue Billion Forecast, by Country 2020 & 2033
- Table 68: Global Iron Powder Industry Volume K Tons Forecast, by Country 2020 & 2033
- Table 69: Saudi Arabia Iron Powder Industry Revenue (Billion) Forecast, by Application 2020 & 2033
- Table 70: Saudi Arabia Iron Powder Industry Volume (K Tons) Forecast, by Application 2020 & 2033
- Table 71: South Africa Iron Powder Industry Revenue (Billion) Forecast, by Application 2020 & 2033
- Table 72: South Africa Iron Powder Industry Volume (K Tons) Forecast, by Application 2020 & 2033
- Table 73: Rest of Middle East and Africa Iron Powder Industry Revenue (Billion) Forecast, by Application 2020 & 2033
- Table 74: Rest of Middle East and Africa Iron Powder Industry Volume (K Tons) Forecast, by Application 2020 & 2033
Frequently Asked Questions
1. What is the projected Compound Annual Growth Rate (CAGR) of the Iron Powder Industry?
The projected CAGR is approximately 5.2%.
2. Which companies are prominent players in the Iron Powder Industry?
Key companies in the market include Hoganas AB, American Elements, KOBE STEEL LTD, INDUSTRIAL METAL POWDERS (INDIA) PVT LTD, Laiwu Iron & Steel Group Lunan Mining Co Ltd, ATI, Ashland, Belmont Metals, BASF SE, Rio Tinto Metal Powders, CNPC POWDER, JFE Steel Corporation, Pometon Powder.
3. What are the main segments of the Iron Powder Industry?
The market segments include Type, End-User.
4. Can you provide details about the market size?
The market size is estimated to be USD 6.43 Billion as of 2022.
5. What are some drivers contributing to market growth?
Increasing Demand for Iron Powders from the Automotive Industry; Other Drivers.
6. What are the notable trends driving market growth?
High Demand from Automotive Segment.
7. Are there any restraints impacting market growth?
High Cost of Production; Other Restraints.
8. Can you provide examples of recent developments in the market?
January 2023: JFE Steel completed the acquisition of the ISO 45001 certification, an international standard for occupational health and safety management systems, for all of its Japan operations.
9. What pricing options are available for accessing the report?
Pricing options include single-user, multi-user, and enterprise licenses priced at USD 4750, USD 5250, and USD 8750 respectively.
10. Is the market size provided in terms of value or volume?
The market size is provided in terms of value, measured in Billion and volume, measured in K Tons.
11. Are there any specific market keywords associated with the report?
Yes, the market keyword associated with the report is "Iron Powder Industry," which aids in identifying and referencing the specific market segment covered.
12. How do I determine which pricing option suits my needs best?
The pricing options vary based on user requirements and access needs. Individual users may opt for single-user licenses, while businesses requiring broader access may choose multi-user or enterprise licenses for cost-effective access to the report.
13. Are there any additional resources or data provided in the Iron Powder Industry report?
While the report offers comprehensive insights, it's advisable to review the specific contents or supplementary materials provided to ascertain if additional resources or data are available.
14. How can I stay updated on further developments or reports in the Iron Powder Industry?
To stay informed about further developments, trends, and reports in the Iron Powder Industry, consider subscribing to industry newsletters, following relevant companies and organizations, or regularly checking reputable industry news sources and publications.
Methodology
Step 1 - Identification of Relevant Samples Size from Population Database


Step 2 - Approaches for Defining Global Market Size (Value, Volume* & Price*)

Note*: In applicable scenarios
Step 3 - Data Sources
Primary Research
- Web Analytics
- Survey Reports
- Research Institute
- Latest Research Reports
- Opinion Leaders
Secondary Research
- Annual Reports
- White Paper
- Latest Press Release
- Industry Association
- Paid Database
- Investor Presentations

Step 4 - Data Triangulation
Involves using different sources of information in order to increase the validity of a study
These sources are likely to be stakeholders in a program - participants, other researchers, program staff, other community members, and so on.
Then we put all data in single framework & apply various statistical tools to find out the dynamic on the market.
During the analysis stage, feedback from the stakeholder groups would be compared to determine areas of agreement as well as areas of divergence

