
Key Insights
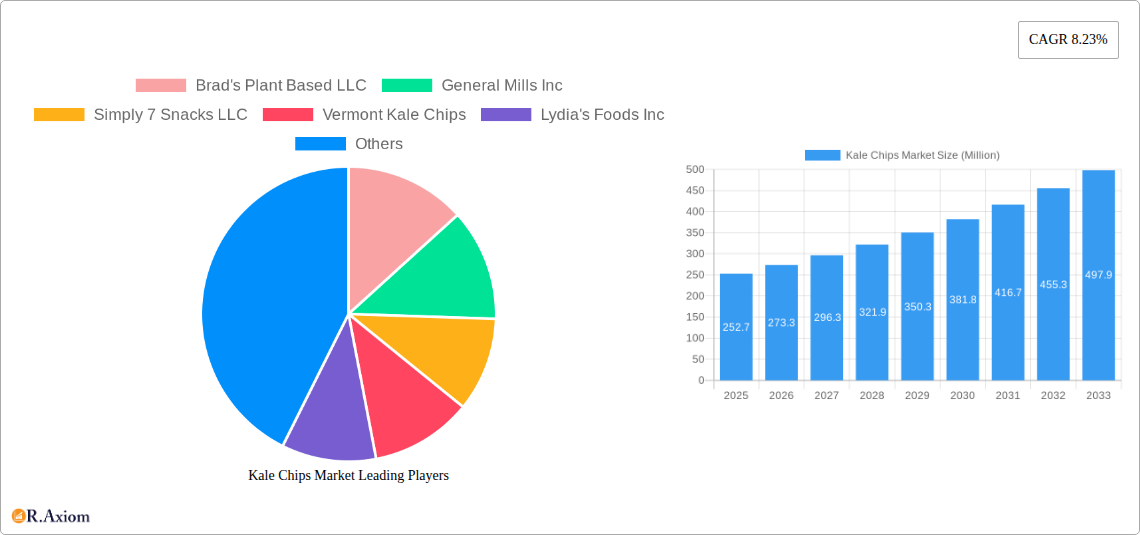
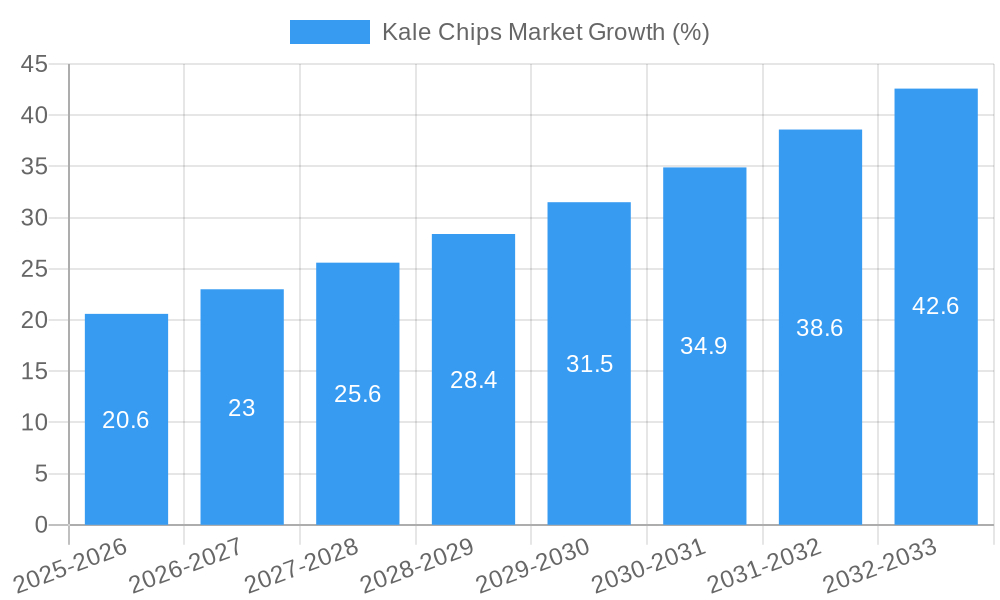
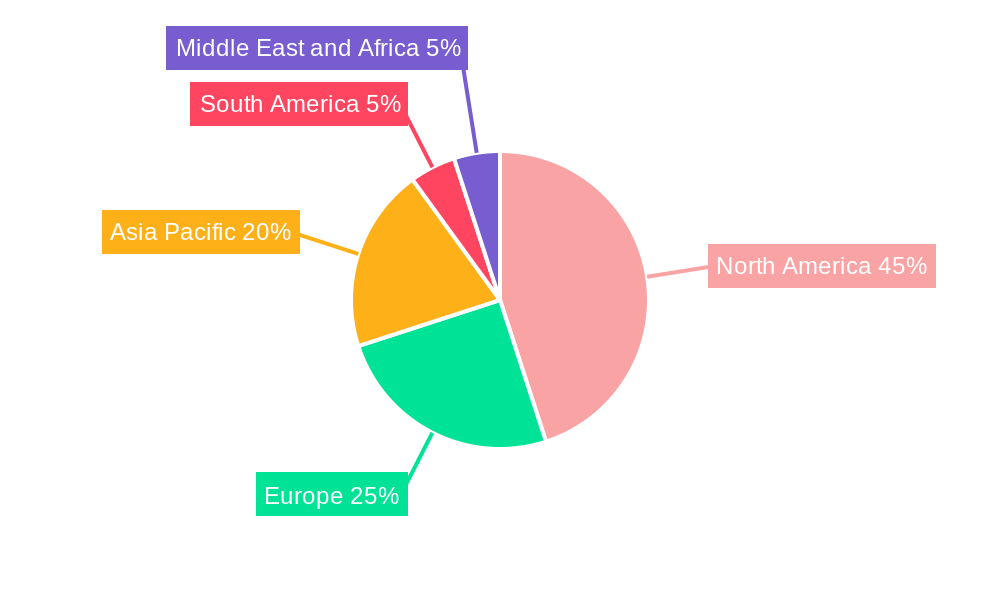
The kale chips market, valued at $252.7 million in 2025, is projected to experience robust growth, exhibiting a Compound Annual Growth Rate (CAGR) of 8.23% from 2025 to 2033. This expansion is driven by several key factors. The increasing consumer awareness of health and wellness, coupled with a rising preference for convenient and nutritious snack options, significantly fuels market demand. The inherent nutritional benefits of kale, including its high vitamin and mineral content and antioxidant properties, resonate strongly with health-conscious consumers seeking alternatives to traditional, less nutritious snacks. Furthermore, the versatility of kale chips, allowing for diverse flavor profiles and product formats (dehydrated leaf crisps/chips, extruded chips), contributes to market diversification and broader consumer appeal. The expanding retail landscape, encompassing hypermarkets, supermarkets, convenience stores, specialist stores, and online channels, provides ample distribution opportunities, further supporting market growth. However, factors such as price sensitivity among certain consumer segments and potential challenges in maintaining consistent product quality and shelf life could act as market restraints. The North American market currently holds a significant share, driven by high consumption rates and a strong emphasis on health and wellness trends in the region. However, Asia Pacific is anticipated to experience substantial growth, fueled by increasing disposable incomes and changing dietary habits. Major players like Brad's Plant Based LLC, General Mills Inc., and Simply 7 Snacks LLC are actively shaping the market through product innovation and strategic expansions.
The competitive landscape is characterized by a mix of established food companies and smaller, specialized brands. Established players leverage their extensive distribution networks and brand recognition to maintain market share, while smaller companies focus on innovative product offerings and niche market penetration to carve out their position. The market’s future growth hinges on continued innovation in product development, particularly exploring novel flavors and formats to cater to evolving consumer preferences. Expansion into new geographical regions, especially within the rapidly growing Asia Pacific market, coupled with effective marketing strategies highlighting the health benefits of kale chips, will be crucial for driving further market expansion. Sustainability initiatives, incorporating eco-friendly packaging and sourcing practices, also present a significant opportunity to attract environmentally conscious consumers and enhance brand reputation.
This in-depth report provides a comprehensive analysis of the global Kale Chips Market, covering the period from 2019 to 2033. It offers actionable insights into market dynamics, competitive landscapes, and future growth prospects, empowering stakeholders to make informed strategic decisions. The report incorporates extensive data analysis, encompassing market sizing, segmentation, and growth projections, all meticulously researched and presented for immediate understanding and application. The base year for this report is 2025, with estimations for the same year and forecasts extending to 2033. The historical period covered is 2019-2024. The total market size is predicted to reach xx Million by 2033.
Kale Chips Market Concentration & Innovation
The Kale Chips market exhibits a moderately concentrated structure, with several key players holding significant market share. However, the presence of numerous smaller niche players, particularly in the specialty and online distribution channels, contributes to a dynamic competitive landscape. Market share data for the leading players (Brad's Plant Based LLC, General Mills Inc, Simply 7 Snacks LLC, etc.) will be provided in the full report. Innovation is driven by factors such as the increasing demand for healthy snacks, the exploration of novel flavors and product formats (e.g., extruded chips), and the ongoing pursuit of sustainable and environmentally friendly production methods.
- Market Concentration: The Herfindahl-Hirschman Index (HHI) for the market is estimated at xx, suggesting a moderately concentrated market.
- Innovation Drivers: Consumer demand for healthier snacks, advancements in processing techniques, and the introduction of innovative flavors and textures.
- Regulatory Landscape: Food safety regulations and labeling requirements significantly impact market players.
- Product Substitutes: Other healthy snack options, such as vegetable crisps and fruit chips, pose competitive pressure.
- End-User Trends: Growing consumer awareness of health and wellness is a major driver, along with increasing demand for convenient and portable snacks.
- M&A Activity: Significant M&A activity, including General Mills Inc.'s investment in Rhythm Superfoods in 2017, indicates consolidation within the sector. The total value of M&A deals in the period 2019-2024 is estimated at xx Million.
Kale Chips Market Industry Trends & Insights
The Kale Chips market is experiencing robust growth, driven by several key factors. The rising consumer preference for healthier and convenient snack options fuels market expansion. The increasing health consciousness among consumers and the growing awareness of the nutritional benefits of kale are significant growth drivers. Technological advancements in food processing have led to the development of innovative product formats and improved shelf life, further boosting market growth. The market's CAGR during the forecast period (2025-2033) is projected to be xx%. Market penetration of kale chips within the broader snack food market is steadily increasing, currently estimated at xx%. Competitive dynamics are shaping the market, with established players and emerging brands vying for market share through product innovation, strategic partnerships, and targeted marketing campaigns. The report provides a detailed analysis of these trends and their impact on market growth.
Dominant Markets & Segments in Kale Chips Market
The North American region currently dominates the global kale chips market, owing to high consumer demand and established distribution networks. Within this region, the United States holds the largest market share.
By Product Type:
- Dehydrated leaf Crisps/Chips: This segment accounts for the largest market share, driven by its traditional appeal and affordability.
- Extruded Chips: This segment is witnessing significant growth owing to its potential for innovation in flavor and texture.
By Distribution Channel:
- Hypermarkets/Supermarkets: This channel dominates due to wide consumer reach and established distribution networks.
- Convenience Stores: This segment offers increasing opportunities due to consumer preference for convenience and impulse purchases.
- Specialist Stores: Health food stores and specialty retailers cater to a niche consumer segment willing to pay a premium for organic and high-quality kale chips.
- Online Stores: This channel is experiencing strong growth as e-commerce gains popularity, offering convenience and direct-to-consumer access.
Key Drivers:
- Strong consumer demand for healthy and convenient snacks.
- Growing awareness of kale's nutritional benefits.
- Increasing disposable incomes in many developing economies.
Kale Chips Market Product Developments
The kale chips market is witnessing continuous innovation in product development, focusing on enhancing taste, texture, and nutritional value. New product launches emphasize diverse flavors, organic ingredients, and unique processing techniques. Technological advancements, such as improved dehydration and extrusion methods, are enhancing product quality and shelf life. The introduction of innovative packaging formats enhances product appeal and shelf life. The market is seeing a surge in gluten-free, vegan, and non-GMO options, catering to specific dietary needs and preferences. This continuous innovation drives competitive advantages and caters to evolving consumer demands.
Report Scope & Segmentation Analysis
This report segments the kale chips market by product type (Dehydrated leaf Crisps/Chips, Extruded Chips) and distribution channel (Hypermarkets/Supermarkets, Convenience Stores, Specialist Stores, Online Stores). Each segment's growth projections, market size, and competitive dynamics are analyzed in detail. The report provides a comprehensive overview of market trends and opportunities within each segment. The dehydrated leaf crisps/chips segment is currently the largest, with a projected value of xx Million in 2025, but the extruded chips segment is experiencing the fastest growth. Hypermarkets/supermarkets dominate the distribution channel, while online stores show significant growth potential.
Key Drivers of Kale Chips Market Growth
The kale chips market is propelled by several key factors: the growing popularity of healthy snacks, the rising consumer awareness of kale's nutritional benefits, the increasing preference for convenient and portable snack options, and the ongoing innovation in product development, including new flavors, textures, and formats. Furthermore, increasing disposable incomes in emerging economies are expanding the market's potential consumer base.
Challenges in the Kale Chips Market Sector
The kale chips market faces challenges, including fluctuating raw material prices (kale), intense competition among numerous brands, and the need for effective marketing and branding to stand out in a crowded market. Maintaining product freshness and quality during transportation and storage is also crucial. The impact of these challenges on market growth is analyzed in the full report.
Emerging Opportunities in Kale Chips Market
Emerging opportunities exist in expanding into new geographical markets, particularly in developing economies with rising consumer disposable incomes and a growing interest in healthy snack alternatives. Developing innovative product formats and flavors, like functional chips with added nutrients or organic and sustainably sourced options, will capture consumer interest. Collaborations and partnerships with health-conscious brands and influencers can enhance market reach and penetration.
Leading Players in the Kale Chips Market Market
- Brad's Plant Based LLC
- General Mills Inc
- Simply 7 Snacks LLC
- Vermont Kale Chips
- Lydia's Foods Inc
- Healthy Crunch
- The Green Snack Co
- The Angel Kale Company
- The Kale Factory
- GlaxoSmithKline PLC
Key Developments in Kale Chips Market Industry
- September 2020: Ecoideas launched Solar Raw's Kaley's Kale Chips in four new flavors.
- November 2019: San Miguel Produce, Inc. launched a new line of fresh Kale Chip Kits.
- January 2017: General Mills Inc. invested in Rhythm Superfoods.
Strategic Outlook for Kale Chips Market Market
The kale chips market is poised for continued growth, driven by ongoing consumer demand for healthy snacks and further innovation in product development. Expansion into new geographical markets and the development of niche product offerings, catering to specific dietary needs and preferences, presents significant opportunities for growth. Companies that invest in sustainable and ethical sourcing practices will gain a competitive advantage. The market's future growth will be influenced by factors including evolving consumer preferences, technological advancements, and competitive dynamics.
Kale Chips Market Segmentation
-
1. Product Type
- 1.1. Dehydrated leaf Crisps/Chips
- 1.2. Extruded Chips
-
2. Distribution Channel
- 2.1. Hypermarkets/Supermarkets
- 2.2. Convenience Stores
- 2.3. Specialist Stores
- 2.4. Online Stores
Kale Chips Market Segmentation By Geography
-
1. North America
- 1.1. United States
- 1.2. Canada
- 1.3. Mexico
- 1.4. Rest of North America
-
2. Europe
- 2.1. United Kingdom
- 2.2. Germany
- 2.3. Spain
- 2.4. France
- 2.5. Italy
- 2.6. Russia
- 2.7. Rest of Europe
-
3. Asia Pacific
- 3.1. China
- 3.2. Japan
- 3.3. India
- 3.4. Australia
- 3.5. Rest of Asia Pacific
-
4. South America
- 4.1. Brazil
- 4.2. Argentina
- 4.3. Rest of South America
-
5. Middle East and Africa
- 5.1. United Arab Emirates
- 5.2. South Africa
- 5.3. Rest of Middle East and Africa
Kale Chips Market REPORT HIGHLIGHTS
| Aspects | Details |
|---|---|
| Study Period | 2019-2033 |
| Base Year | 2024 |
| Estimated Year | 2025 |
| Forecast Period | 2025-2033 |
| Historical Period | 2019-2024 |
| Growth Rate | CAGR of 8.23% from 2019-2033 |
| Segmentation |
|
Table of Contents
- 1. Introduction
- 1.1. Research Scope
- 1.2. Market Segmentation
- 1.3. Research Methodology
- 1.4. Definitions and Assumptions
- 2. Executive Summary
- 2.1. Introduction
- 3. Market Dynamics
- 3.1. Introduction
- 3.2. Market Drivers
- 3.2.1. Increasing Demand for Clean Label Ingredients; Growing Health Consciousness of Consumers
- 3.3. Market Restrains
- 3.3.1. Higher Manufacturing Cost
- 3.4. Market Trends
- 3.4.1. Increasing demand of Vegetable and Healthy Chips
- 4. Market Factor Analysis
- 4.1. Porters Five Forces
- 4.2. Supply/Value Chain
- 4.3. PESTEL analysis
- 4.4. Market Entropy
- 4.5. Patent/Trademark Analysis
- 5. Global Kale Chips Market Analysis, Insights and Forecast, 2019-2031
- 5.1. Market Analysis, Insights and Forecast - by Product Type
- 5.1.1. Dehydrated leaf Crisps/Chips
- 5.1.2. Extruded Chips
- 5.2. Market Analysis, Insights and Forecast - by Distribution Channel
- 5.2.1. Hypermarkets/Supermarkets
- 5.2.2. Convenience Stores
- 5.2.3. Specialist Stores
- 5.2.4. Online Stores
- 5.3. Market Analysis, Insights and Forecast - by Region
- 5.3.1. North America
- 5.3.2. Europe
- 5.3.3. Asia Pacific
- 5.3.4. South America
- 5.3.5. Middle East and Africa
- 5.1. Market Analysis, Insights and Forecast - by Product Type
- 6. North America Kale Chips Market Analysis, Insights and Forecast, 2019-2031
- 6.1. Market Analysis, Insights and Forecast - by Product Type
- 6.1.1. Dehydrated leaf Crisps/Chips
- 6.1.2. Extruded Chips
- 6.2. Market Analysis, Insights and Forecast - by Distribution Channel
- 6.2.1. Hypermarkets/Supermarkets
- 6.2.2. Convenience Stores
- 6.2.3. Specialist Stores
- 6.2.4. Online Stores
- 6.1. Market Analysis, Insights and Forecast - by Product Type
- 7. Europe Kale Chips Market Analysis, Insights and Forecast, 2019-2031
- 7.1. Market Analysis, Insights and Forecast - by Product Type
- 7.1.1. Dehydrated leaf Crisps/Chips
- 7.1.2. Extruded Chips
- 7.2. Market Analysis, Insights and Forecast - by Distribution Channel
- 7.2.1. Hypermarkets/Supermarkets
- 7.2.2. Convenience Stores
- 7.2.3. Specialist Stores
- 7.2.4. Online Stores
- 7.1. Market Analysis, Insights and Forecast - by Product Type
- 8. Asia Pacific Kale Chips Market Analysis, Insights and Forecast, 2019-2031
- 8.1. Market Analysis, Insights and Forecast - by Product Type
- 8.1.1. Dehydrated leaf Crisps/Chips
- 8.1.2. Extruded Chips
- 8.2. Market Analysis, Insights and Forecast - by Distribution Channel
- 8.2.1. Hypermarkets/Supermarkets
- 8.2.2. Convenience Stores
- 8.2.3. Specialist Stores
- 8.2.4. Online Stores
- 8.1. Market Analysis, Insights and Forecast - by Product Type
- 9. South America Kale Chips Market Analysis, Insights and Forecast, 2019-2031
- 9.1. Market Analysis, Insights and Forecast - by Product Type
- 9.1.1. Dehydrated leaf Crisps/Chips
- 9.1.2. Extruded Chips
- 9.2. Market Analysis, Insights and Forecast - by Distribution Channel
- 9.2.1. Hypermarkets/Supermarkets
- 9.2.2. Convenience Stores
- 9.2.3. Specialist Stores
- 9.2.4. Online Stores
- 9.1. Market Analysis, Insights and Forecast - by Product Type
- 10. Middle East and Africa Kale Chips Market Analysis, Insights and Forecast, 2019-2031
- 10.1. Market Analysis, Insights and Forecast - by Product Type
- 10.1.1. Dehydrated leaf Crisps/Chips
- 10.1.2. Extruded Chips
- 10.2. Market Analysis, Insights and Forecast - by Distribution Channel
- 10.2.1. Hypermarkets/Supermarkets
- 10.2.2. Convenience Stores
- 10.2.3. Specialist Stores
- 10.2.4. Online Stores
- 10.1. Market Analysis, Insights and Forecast - by Product Type
- 11. North America Kale Chips Market Analysis, Insights and Forecast, 2019-2031
- 11.1. Market Analysis, Insights and Forecast - By Country/Sub-region
- 11.1.1 United States
- 11.1.2 Canada
- 11.1.3 Mexico
- 11.1.4 Rest of North America
- 12. Europe Kale Chips Market Analysis, Insights and Forecast, 2019-2031
- 12.1. Market Analysis, Insights and Forecast - By Country/Sub-region
- 12.1.1 United Kingdom
- 12.1.2 Germany
- 12.1.3 Spain
- 12.1.4 France
- 12.1.5 Italy
- 12.1.6 Russia
- 12.1.7 Rest of Europe
- 13. Asia Pacific Kale Chips Market Analysis, Insights and Forecast, 2019-2031
- 13.1. Market Analysis, Insights and Forecast - By Country/Sub-region
- 13.1.1 China
- 13.1.2 Japan
- 13.1.3 India
- 13.1.4 Australia
- 13.1.5 Rest of Asia Pacific
- 14. South America Kale Chips Market Analysis, Insights and Forecast, 2019-2031
- 14.1. Market Analysis, Insights and Forecast - By Country/Sub-region
- 14.1.1 Brazil
- 14.1.2 Argentina
- 14.1.3 Rest of South America
- 15. Middle East and Africa Kale Chips Market Analysis, Insights and Forecast, 2019-2031
- 15.1. Market Analysis, Insights and Forecast - By Country/Sub-region
- 15.1.1 United Arab Emirates
- 15.1.2 South Africa
- 15.1.3 Rest of Middle East and Africa
- 16. Competitive Analysis
- 16.1. Global Market Share Analysis 2024
- 16.2. Company Profiles
- 16.2.1 Brad's Plant Based LLC
- 16.2.1.1. Overview
- 16.2.1.2. Products
- 16.2.1.3. SWOT Analysis
- 16.2.1.4. Recent Developments
- 16.2.1.5. Financials (Based on Availability)
- 16.2.2 General Mills Inc
- 16.2.2.1. Overview
- 16.2.2.2. Products
- 16.2.2.3. SWOT Analysis
- 16.2.2.4. Recent Developments
- 16.2.2.5. Financials (Based on Availability)
- 16.2.3 Simply 7 Snacks LLC
- 16.2.3.1. Overview
- 16.2.3.2. Products
- 16.2.3.3. SWOT Analysis
- 16.2.3.4. Recent Developments
- 16.2.3.5. Financials (Based on Availability)
- 16.2.4 Vermont Kale Chips
- 16.2.4.1. Overview
- 16.2.4.2. Products
- 16.2.4.3. SWOT Analysis
- 16.2.4.4. Recent Developments
- 16.2.4.5. Financials (Based on Availability)
- 16.2.5 Lydia's Foods Inc
- 16.2.5.1. Overview
- 16.2.5.2. Products
- 16.2.5.3. SWOT Analysis
- 16.2.5.4. Recent Developments
- 16.2.5.5. Financials (Based on Availability)
- 16.2.6 Healthy Crunch
- 16.2.6.1. Overview
- 16.2.6.2. Products
- 16.2.6.3. SWOT Analysis
- 16.2.6.4. Recent Developments
- 16.2.6.5. Financials (Based on Availability)
- 16.2.7 The Green Snack Co *List Not Exhaustive
- 16.2.7.1. Overview
- 16.2.7.2. Products
- 16.2.7.3. SWOT Analysis
- 16.2.7.4. Recent Developments
- 16.2.7.5. Financials (Based on Availability)
- 16.2.8 The Angel Kale Company
- 16.2.8.1. Overview
- 16.2.8.2. Products
- 16.2.8.3. SWOT Analysis
- 16.2.8.4. Recent Developments
- 16.2.8.5. Financials (Based on Availability)
- 16.2.9 The Kale Factory
- 16.2.9.1. Overview
- 16.2.9.2. Products
- 16.2.9.3. SWOT Analysis
- 16.2.9.4. Recent Developments
- 16.2.9.5. Financials (Based on Availability)
- 16.2.10 GlaxoSmithKline PLC
- 16.2.10.1. Overview
- 16.2.10.2. Products
- 16.2.10.3. SWOT Analysis
- 16.2.10.4. Recent Developments
- 16.2.10.5. Financials (Based on Availability)
- 16.2.1 Brad's Plant Based LLC
List of Figures
- Figure 1: Global Kale Chips Market Revenue Breakdown (Million, %) by Region 2024 & 2032
- Figure 2: Global Kale Chips Market Volume Breakdown (K Tons, %) by Region 2024 & 2032
- Figure 3: North America Kale Chips Market Revenue (Million), by Country 2024 & 2032
- Figure 4: North America Kale Chips Market Volume (K Tons), by Country 2024 & 2032
- Figure 5: North America Kale Chips Market Revenue Share (%), by Country 2024 & 2032
- Figure 6: North America Kale Chips Market Volume Share (%), by Country 2024 & 2032
- Figure 7: Europe Kale Chips Market Revenue (Million), by Country 2024 & 2032
- Figure 8: Europe Kale Chips Market Volume (K Tons), by Country 2024 & 2032
- Figure 9: Europe Kale Chips Market Revenue Share (%), by Country 2024 & 2032
- Figure 10: Europe Kale Chips Market Volume Share (%), by Country 2024 & 2032
- Figure 11: Asia Pacific Kale Chips Market Revenue (Million), by Country 2024 & 2032
- Figure 12: Asia Pacific Kale Chips Market Volume (K Tons), by Country 2024 & 2032
- Figure 13: Asia Pacific Kale Chips Market Revenue Share (%), by Country 2024 & 2032
- Figure 14: Asia Pacific Kale Chips Market Volume Share (%), by Country 2024 & 2032
- Figure 15: South America Kale Chips Market Revenue (Million), by Country 2024 & 2032
- Figure 16: South America Kale Chips Market Volume (K Tons), by Country 2024 & 2032
- Figure 17: South America Kale Chips Market Revenue Share (%), by Country 2024 & 2032
- Figure 18: South America Kale Chips Market Volume Share (%), by Country 2024 & 2032
- Figure 19: Middle East and Africa Kale Chips Market Revenue (Million), by Country 2024 & 2032
- Figure 20: Middle East and Africa Kale Chips Market Volume (K Tons), by Country 2024 & 2032
- Figure 21: Middle East and Africa Kale Chips Market Revenue Share (%), by Country 2024 & 2032
- Figure 22: Middle East and Africa Kale Chips Market Volume Share (%), by Country 2024 & 2032
- Figure 23: North America Kale Chips Market Revenue (Million), by Product Type 2024 & 2032
- Figure 24: North America Kale Chips Market Volume (K Tons), by Product Type 2024 & 2032
- Figure 25: North America Kale Chips Market Revenue Share (%), by Product Type 2024 & 2032
- Figure 26: North America Kale Chips Market Volume Share (%), by Product Type 2024 & 2032
- Figure 27: North America Kale Chips Market Revenue (Million), by Distribution Channel 2024 & 2032
- Figure 28: North America Kale Chips Market Volume (K Tons), by Distribution Channel 2024 & 2032
- Figure 29: North America Kale Chips Market Revenue Share (%), by Distribution Channel 2024 & 2032
- Figure 30: North America Kale Chips Market Volume Share (%), by Distribution Channel 2024 & 2032
- Figure 31: North America Kale Chips Market Revenue (Million), by Country 2024 & 2032
- Figure 32: North America Kale Chips Market Volume (K Tons), by Country 2024 & 2032
- Figure 33: North America Kale Chips Market Revenue Share (%), by Country 2024 & 2032
- Figure 34: North America Kale Chips Market Volume Share (%), by Country 2024 & 2032
- Figure 35: Europe Kale Chips Market Revenue (Million), by Product Type 2024 & 2032
- Figure 36: Europe Kale Chips Market Volume (K Tons), by Product Type 2024 & 2032
- Figure 37: Europe Kale Chips Market Revenue Share (%), by Product Type 2024 & 2032
- Figure 38: Europe Kale Chips Market Volume Share (%), by Product Type 2024 & 2032
- Figure 39: Europe Kale Chips Market Revenue (Million), by Distribution Channel 2024 & 2032
- Figure 40: Europe Kale Chips Market Volume (K Tons), by Distribution Channel 2024 & 2032
- Figure 41: Europe Kale Chips Market Revenue Share (%), by Distribution Channel 2024 & 2032
- Figure 42: Europe Kale Chips Market Volume Share (%), by Distribution Channel 2024 & 2032
- Figure 43: Europe Kale Chips Market Revenue (Million), by Country 2024 & 2032
- Figure 44: Europe Kale Chips Market Volume (K Tons), by Country 2024 & 2032
- Figure 45: Europe Kale Chips Market Revenue Share (%), by Country 2024 & 2032
- Figure 46: Europe Kale Chips Market Volume Share (%), by Country 2024 & 2032
- Figure 47: Asia Pacific Kale Chips Market Revenue (Million), by Product Type 2024 & 2032
- Figure 48: Asia Pacific Kale Chips Market Volume (K Tons), by Product Type 2024 & 2032
- Figure 49: Asia Pacific Kale Chips Market Revenue Share (%), by Product Type 2024 & 2032
- Figure 50: Asia Pacific Kale Chips Market Volume Share (%), by Product Type 2024 & 2032
- Figure 51: Asia Pacific Kale Chips Market Revenue (Million), by Distribution Channel 2024 & 2032
- Figure 52: Asia Pacific Kale Chips Market Volume (K Tons), by Distribution Channel 2024 & 2032
- Figure 53: Asia Pacific Kale Chips Market Revenue Share (%), by Distribution Channel 2024 & 2032
- Figure 54: Asia Pacific Kale Chips Market Volume Share (%), by Distribution Channel 2024 & 2032
- Figure 55: Asia Pacific Kale Chips Market Revenue (Million), by Country 2024 & 2032
- Figure 56: Asia Pacific Kale Chips Market Volume (K Tons), by Country 2024 & 2032
- Figure 57: Asia Pacific Kale Chips Market Revenue Share (%), by Country 2024 & 2032
- Figure 58: Asia Pacific Kale Chips Market Volume Share (%), by Country 2024 & 2032
- Figure 59: South America Kale Chips Market Revenue (Million), by Product Type 2024 & 2032
- Figure 60: South America Kale Chips Market Volume (K Tons), by Product Type 2024 & 2032
- Figure 61: South America Kale Chips Market Revenue Share (%), by Product Type 2024 & 2032
- Figure 62: South America Kale Chips Market Volume Share (%), by Product Type 2024 & 2032
- Figure 63: South America Kale Chips Market Revenue (Million), by Distribution Channel 2024 & 2032
- Figure 64: South America Kale Chips Market Volume (K Tons), by Distribution Channel 2024 & 2032
- Figure 65: South America Kale Chips Market Revenue Share (%), by Distribution Channel 2024 & 2032
- Figure 66: South America Kale Chips Market Volume Share (%), by Distribution Channel 2024 & 2032
- Figure 67: South America Kale Chips Market Revenue (Million), by Country 2024 & 2032
- Figure 68: South America Kale Chips Market Volume (K Tons), by Country 2024 & 2032
- Figure 69: South America Kale Chips Market Revenue Share (%), by Country 2024 & 2032
- Figure 70: South America Kale Chips Market Volume Share (%), by Country 2024 & 2032
- Figure 71: Middle East and Africa Kale Chips Market Revenue (Million), by Product Type 2024 & 2032
- Figure 72: Middle East and Africa Kale Chips Market Volume (K Tons), by Product Type 2024 & 2032
- Figure 73: Middle East and Africa Kale Chips Market Revenue Share (%), by Product Type 2024 & 2032
- Figure 74: Middle East and Africa Kale Chips Market Volume Share (%), by Product Type 2024 & 2032
- Figure 75: Middle East and Africa Kale Chips Market Revenue (Million), by Distribution Channel 2024 & 2032
- Figure 76: Middle East and Africa Kale Chips Market Volume (K Tons), by Distribution Channel 2024 & 2032
- Figure 77: Middle East and Africa Kale Chips Market Revenue Share (%), by Distribution Channel 2024 & 2032
- Figure 78: Middle East and Africa Kale Chips Market Volume Share (%), by Distribution Channel 2024 & 2032
- Figure 79: Middle East and Africa Kale Chips Market Revenue (Million), by Country 2024 & 2032
- Figure 80: Middle East and Africa Kale Chips Market Volume (K Tons), by Country 2024 & 2032
- Figure 81: Middle East and Africa Kale Chips Market Revenue Share (%), by Country 2024 & 2032
- Figure 82: Middle East and Africa Kale Chips Market Volume Share (%), by Country 2024 & 2032
List of Tables
- Table 1: Global Kale Chips Market Revenue Million Forecast, by Region 2019 & 2032
- Table 2: Global Kale Chips Market Volume K Tons Forecast, by Region 2019 & 2032
- Table 3: Global Kale Chips Market Revenue Million Forecast, by Product Type 2019 & 2032
- Table 4: Global Kale Chips Market Volume K Tons Forecast, by Product Type 2019 & 2032
- Table 5: Global Kale Chips Market Revenue Million Forecast, by Distribution Channel 2019 & 2032
- Table 6: Global Kale Chips Market Volume K Tons Forecast, by Distribution Channel 2019 & 2032
- Table 7: Global Kale Chips Market Revenue Million Forecast, by Region 2019 & 2032
- Table 8: Global Kale Chips Market Volume K Tons Forecast, by Region 2019 & 2032
- Table 9: Global Kale Chips Market Revenue Million Forecast, by Country 2019 & 2032
- Table 10: Global Kale Chips Market Volume K Tons Forecast, by Country 2019 & 2032
- Table 11: United States Kale Chips Market Revenue (Million) Forecast, by Application 2019 & 2032
- Table 12: United States Kale Chips Market Volume (K Tons) Forecast, by Application 2019 & 2032
- Table 13: Canada Kale Chips Market Revenue (Million) Forecast, by Application 2019 & 2032
- Table 14: Canada Kale Chips Market Volume (K Tons) Forecast, by Application 2019 & 2032
- Table 15: Mexico Kale Chips Market Revenue (Million) Forecast, by Application 2019 & 2032
- Table 16: Mexico Kale Chips Market Volume (K Tons) Forecast, by Application 2019 & 2032
- Table 17: Rest of North America Kale Chips Market Revenue (Million) Forecast, by Application 2019 & 2032
- Table 18: Rest of North America Kale Chips Market Volume (K Tons) Forecast, by Application 2019 & 2032
- Table 19: Global Kale Chips Market Revenue Million Forecast, by Country 2019 & 2032
- Table 20: Global Kale Chips Market Volume K Tons Forecast, by Country 2019 & 2032
- Table 21: United Kingdom Kale Chips Market Revenue (Million) Forecast, by Application 2019 & 2032
- Table 22: United Kingdom Kale Chips Market Volume (K Tons) Forecast, by Application 2019 & 2032
- Table 23: Germany Kale Chips Market Revenue (Million) Forecast, by Application 2019 & 2032
- Table 24: Germany Kale Chips Market Volume (K Tons) Forecast, by Application 2019 & 2032
- Table 25: Spain Kale Chips Market Revenue (Million) Forecast, by Application 2019 & 2032
- Table 26: Spain Kale Chips Market Volume (K Tons) Forecast, by Application 2019 & 2032
- Table 27: France Kale Chips Market Revenue (Million) Forecast, by Application 2019 & 2032
- Table 28: France Kale Chips Market Volume (K Tons) Forecast, by Application 2019 & 2032
- Table 29: Italy Kale Chips Market Revenue (Million) Forecast, by Application 2019 & 2032
- Table 30: Italy Kale Chips Market Volume (K Tons) Forecast, by Application 2019 & 2032
- Table 31: Russia Kale Chips Market Revenue (Million) Forecast, by Application 2019 & 2032
- Table 32: Russia Kale Chips Market Volume (K Tons) Forecast, by Application 2019 & 2032
- Table 33: Rest of Europe Kale Chips Market Revenue (Million) Forecast, by Application 2019 & 2032
- Table 34: Rest of Europe Kale Chips Market Volume (K Tons) Forecast, by Application 2019 & 2032
- Table 35: Global Kale Chips Market Revenue Million Forecast, by Country 2019 & 2032
- Table 36: Global Kale Chips Market Volume K Tons Forecast, by Country 2019 & 2032
- Table 37: China Kale Chips Market Revenue (Million) Forecast, by Application 2019 & 2032
- Table 38: China Kale Chips Market Volume (K Tons) Forecast, by Application 2019 & 2032
- Table 39: Japan Kale Chips Market Revenue (Million) Forecast, by Application 2019 & 2032
- Table 40: Japan Kale Chips Market Volume (K Tons) Forecast, by Application 2019 & 2032
- Table 41: India Kale Chips Market Revenue (Million) Forecast, by Application 2019 & 2032
- Table 42: India Kale Chips Market Volume (K Tons) Forecast, by Application 2019 & 2032
- Table 43: Australia Kale Chips Market Revenue (Million) Forecast, by Application 2019 & 2032
- Table 44: Australia Kale Chips Market Volume (K Tons) Forecast, by Application 2019 & 2032
- Table 45: Rest of Asia Pacific Kale Chips Market Revenue (Million) Forecast, by Application 2019 & 2032
- Table 46: Rest of Asia Pacific Kale Chips Market Volume (K Tons) Forecast, by Application 2019 & 2032
- Table 47: Global Kale Chips Market Revenue Million Forecast, by Country 2019 & 2032
- Table 48: Global Kale Chips Market Volume K Tons Forecast, by Country 2019 & 2032
- Table 49: Brazil Kale Chips Market Revenue (Million) Forecast, by Application 2019 & 2032
- Table 50: Brazil Kale Chips Market Volume (K Tons) Forecast, by Application 2019 & 2032
- Table 51: Argentina Kale Chips Market Revenue (Million) Forecast, by Application 2019 & 2032
- Table 52: Argentina Kale Chips Market Volume (K Tons) Forecast, by Application 2019 & 2032
- Table 53: Rest of South America Kale Chips Market Revenue (Million) Forecast, by Application 2019 & 2032
- Table 54: Rest of South America Kale Chips Market Volume (K Tons) Forecast, by Application 2019 & 2032
- Table 55: Global Kale Chips Market Revenue Million Forecast, by Country 2019 & 2032
- Table 56: Global Kale Chips Market Volume K Tons Forecast, by Country 2019 & 2032
- Table 57: United Arab Emirates Kale Chips Market Revenue (Million) Forecast, by Application 2019 & 2032
- Table 58: United Arab Emirates Kale Chips Market Volume (K Tons) Forecast, by Application 2019 & 2032
- Table 59: South Africa Kale Chips Market Revenue (Million) Forecast, by Application 2019 & 2032
- Table 60: South Africa Kale Chips Market Volume (K Tons) Forecast, by Application 2019 & 2032
- Table 61: Rest of Middle East and Africa Kale Chips Market Revenue (Million) Forecast, by Application 2019 & 2032
- Table 62: Rest of Middle East and Africa Kale Chips Market Volume (K Tons) Forecast, by Application 2019 & 2032
- Table 63: Global Kale Chips Market Revenue Million Forecast, by Product Type 2019 & 2032
- Table 64: Global Kale Chips Market Volume K Tons Forecast, by Product Type 2019 & 2032
- Table 65: Global Kale Chips Market Revenue Million Forecast, by Distribution Channel 2019 & 2032
- Table 66: Global Kale Chips Market Volume K Tons Forecast, by Distribution Channel 2019 & 2032
- Table 67: Global Kale Chips Market Revenue Million Forecast, by Country 2019 & 2032
- Table 68: Global Kale Chips Market Volume K Tons Forecast, by Country 2019 & 2032
- Table 69: United States Kale Chips Market Revenue (Million) Forecast, by Application 2019 & 2032
- Table 70: United States Kale Chips Market Volume (K Tons) Forecast, by Application 2019 & 2032
- Table 71: Canada Kale Chips Market Revenue (Million) Forecast, by Application 2019 & 2032
- Table 72: Canada Kale Chips Market Volume (K Tons) Forecast, by Application 2019 & 2032
- Table 73: Mexico Kale Chips Market Revenue (Million) Forecast, by Application 2019 & 2032
- Table 74: Mexico Kale Chips Market Volume (K Tons) Forecast, by Application 2019 & 2032
- Table 75: Rest of North America Kale Chips Market Revenue (Million) Forecast, by Application 2019 & 2032
- Table 76: Rest of North America Kale Chips Market Volume (K Tons) Forecast, by Application 2019 & 2032
- Table 77: Global Kale Chips Market Revenue Million Forecast, by Product Type 2019 & 2032
- Table 78: Global Kale Chips Market Volume K Tons Forecast, by Product Type 2019 & 2032
- Table 79: Global Kale Chips Market Revenue Million Forecast, by Distribution Channel 2019 & 2032
- Table 80: Global Kale Chips Market Volume K Tons Forecast, by Distribution Channel 2019 & 2032
- Table 81: Global Kale Chips Market Revenue Million Forecast, by Country 2019 & 2032
- Table 82: Global Kale Chips Market Volume K Tons Forecast, by Country 2019 & 2032
- Table 83: United Kingdom Kale Chips Market Revenue (Million) Forecast, by Application 2019 & 2032
- Table 84: United Kingdom Kale Chips Market Volume (K Tons) Forecast, by Application 2019 & 2032
- Table 85: Germany Kale Chips Market Revenue (Million) Forecast, by Application 2019 & 2032
- Table 86: Germany Kale Chips Market Volume (K Tons) Forecast, by Application 2019 & 2032
- Table 87: Spain Kale Chips Market Revenue (Million) Forecast, by Application 2019 & 2032
- Table 88: Spain Kale Chips Market Volume (K Tons) Forecast, by Application 2019 & 2032
- Table 89: France Kale Chips Market Revenue (Million) Forecast, by Application 2019 & 2032
- Table 90: France Kale Chips Market Volume (K Tons) Forecast, by Application 2019 & 2032
- Table 91: Italy Kale Chips Market Revenue (Million) Forecast, by Application 2019 & 2032
- Table 92: Italy Kale Chips Market Volume (K Tons) Forecast, by Application 2019 & 2032
- Table 93: Russia Kale Chips Market Revenue (Million) Forecast, by Application 2019 & 2032
- Table 94: Russia Kale Chips Market Volume (K Tons) Forecast, by Application 2019 & 2032
- Table 95: Rest of Europe Kale Chips Market Revenue (Million) Forecast, by Application 2019 & 2032
- Table 96: Rest of Europe Kale Chips Market Volume (K Tons) Forecast, by Application 2019 & 2032
- Table 97: Global Kale Chips Market Revenue Million Forecast, by Product Type 2019 & 2032
- Table 98: Global Kale Chips Market Volume K Tons Forecast, by Product Type 2019 & 2032
- Table 99: Global Kale Chips Market Revenue Million Forecast, by Distribution Channel 2019 & 2032
- Table 100: Global Kale Chips Market Volume K Tons Forecast, by Distribution Channel 2019 & 2032
- Table 101: Global Kale Chips Market Revenue Million Forecast, by Country 2019 & 2032
- Table 102: Global Kale Chips Market Volume K Tons Forecast, by Country 2019 & 2032
- Table 103: China Kale Chips Market Revenue (Million) Forecast, by Application 2019 & 2032
- Table 104: China Kale Chips Market Volume (K Tons) Forecast, by Application 2019 & 2032
- Table 105: Japan Kale Chips Market Revenue (Million) Forecast, by Application 2019 & 2032
- Table 106: Japan Kale Chips Market Volume (K Tons) Forecast, by Application 2019 & 2032
- Table 107: India Kale Chips Market Revenue (Million) Forecast, by Application 2019 & 2032
- Table 108: India Kale Chips Market Volume (K Tons) Forecast, by Application 2019 & 2032
- Table 109: Australia Kale Chips Market Revenue (Million) Forecast, by Application 2019 & 2032
- Table 110: Australia Kale Chips Market Volume (K Tons) Forecast, by Application 2019 & 2032
- Table 111: Rest of Asia Pacific Kale Chips Market Revenue (Million) Forecast, by Application 2019 & 2032
- Table 112: Rest of Asia Pacific Kale Chips Market Volume (K Tons) Forecast, by Application 2019 & 2032
- Table 113: Global Kale Chips Market Revenue Million Forecast, by Product Type 2019 & 2032
- Table 114: Global Kale Chips Market Volume K Tons Forecast, by Product Type 2019 & 2032
- Table 115: Global Kale Chips Market Revenue Million Forecast, by Distribution Channel 2019 & 2032
- Table 116: Global Kale Chips Market Volume K Tons Forecast, by Distribution Channel 2019 & 2032
- Table 117: Global Kale Chips Market Revenue Million Forecast, by Country 2019 & 2032
- Table 118: Global Kale Chips Market Volume K Tons Forecast, by Country 2019 & 2032
- Table 119: Brazil Kale Chips Market Revenue (Million) Forecast, by Application 2019 & 2032
- Table 120: Brazil Kale Chips Market Volume (K Tons) Forecast, by Application 2019 & 2032
- Table 121: Argentina Kale Chips Market Revenue (Million) Forecast, by Application 2019 & 2032
- Table 122: Argentina Kale Chips Market Volume (K Tons) Forecast, by Application 2019 & 2032
- Table 123: Rest of South America Kale Chips Market Revenue (Million) Forecast, by Application 2019 & 2032
- Table 124: Rest of South America Kale Chips Market Volume (K Tons) Forecast, by Application 2019 & 2032
- Table 125: Global Kale Chips Market Revenue Million Forecast, by Product Type 2019 & 2032
- Table 126: Global Kale Chips Market Volume K Tons Forecast, by Product Type 2019 & 2032
- Table 127: Global Kale Chips Market Revenue Million Forecast, by Distribution Channel 2019 & 2032
- Table 128: Global Kale Chips Market Volume K Tons Forecast, by Distribution Channel 2019 & 2032
- Table 129: Global Kale Chips Market Revenue Million Forecast, by Country 2019 & 2032
- Table 130: Global Kale Chips Market Volume K Tons Forecast, by Country 2019 & 2032
- Table 131: United Arab Emirates Kale Chips Market Revenue (Million) Forecast, by Application 2019 & 2032
- Table 132: United Arab Emirates Kale Chips Market Volume (K Tons) Forecast, by Application 2019 & 2032
- Table 133: South Africa Kale Chips Market Revenue (Million) Forecast, by Application 2019 & 2032
- Table 134: South Africa Kale Chips Market Volume (K Tons) Forecast, by Application 2019 & 2032
- Table 135: Rest of Middle East and Africa Kale Chips Market Revenue (Million) Forecast, by Application 2019 & 2032
- Table 136: Rest of Middle East and Africa Kale Chips Market Volume (K Tons) Forecast, by Application 2019 & 2032
Frequently Asked Questions
1. What is the projected Compound Annual Growth Rate (CAGR) of the Kale Chips Market?
The projected CAGR is approximately 8.23%.
2. Which companies are prominent players in the Kale Chips Market?
Key companies in the market include Brad's Plant Based LLC, General Mills Inc, Simply 7 Snacks LLC, Vermont Kale Chips, Lydia's Foods Inc, Healthy Crunch, The Green Snack Co *List Not Exhaustive, The Angel Kale Company, The Kale Factory, GlaxoSmithKline PLC.
3. What are the main segments of the Kale Chips Market?
The market segments include Product Type, Distribution Channel.
4. Can you provide details about the market size?
The market size is estimated to be USD 252.7 Million as of 2022.
5. What are some drivers contributing to market growth?
Increasing Demand for Clean Label Ingredients; Growing Health Consciousness of Consumers.
6. What are the notable trends driving market growth?
Increasing demand of Vegetable and Healthy Chips.
7. Are there any restraints impacting market growth?
Higher Manufacturing Cost.
8. Can you provide examples of recent developments in the market?
In September 2020, Ecoideas announced the launch of Solar Raw's Kaley's Kale Chips in four new flavors to meet the growing demand for nutritionally dense and naturally delicious plant based snacks that appeal to mainstream snacker.
9. What pricing options are available for accessing the report?
Pricing options include single-user, multi-user, and enterprise licenses priced at USD 4750, USD 5250, and USD 8750 respectively.
10. Is the market size provided in terms of value or volume?
The market size is provided in terms of value, measured in Million and volume, measured in K Tons.
11. Are there any specific market keywords associated with the report?
Yes, the market keyword associated with the report is "Kale Chips Market," which aids in identifying and referencing the specific market segment covered.
12. How do I determine which pricing option suits my needs best?
The pricing options vary based on user requirements and access needs. Individual users may opt for single-user licenses, while businesses requiring broader access may choose multi-user or enterprise licenses for cost-effective access to the report.
13. Are there any additional resources or data provided in the Kale Chips Market report?
While the report offers comprehensive insights, it's advisable to review the specific contents or supplementary materials provided to ascertain if additional resources or data are available.
14. How can I stay updated on further developments or reports in the Kale Chips Market?
To stay informed about further developments, trends, and reports in the Kale Chips Market, consider subscribing to industry newsletters, following relevant companies and organizations, or regularly checking reputable industry news sources and publications.
Methodology
Step 1 - Identification of Relevant Samples Size from Population Database


Step 2 - Approaches for Defining Global Market Size (Value, Volume* & Price*)

Note*: In applicable scenarios
Step 3 - Data Sources
Primary Research
- Web Analytics
- Survey Reports
- Research Institute
- Latest Research Reports
- Opinion Leaders
Secondary Research
- Annual Reports
- White Paper
- Latest Press Release
- Industry Association
- Paid Database
- Investor Presentations

Step 4 - Data Triangulation
Involves using different sources of information in order to increase the validity of a study
These sources are likely to be stakeholders in a program - participants, other researchers, program staff, other community members, and so on.
Then we put all data in single framework & apply various statistical tools to find out the dynamic on the market.
During the analysis stage, feedback from the stakeholder groups would be compared to determine areas of agreement as well as areas of divergence


