
Key Insights
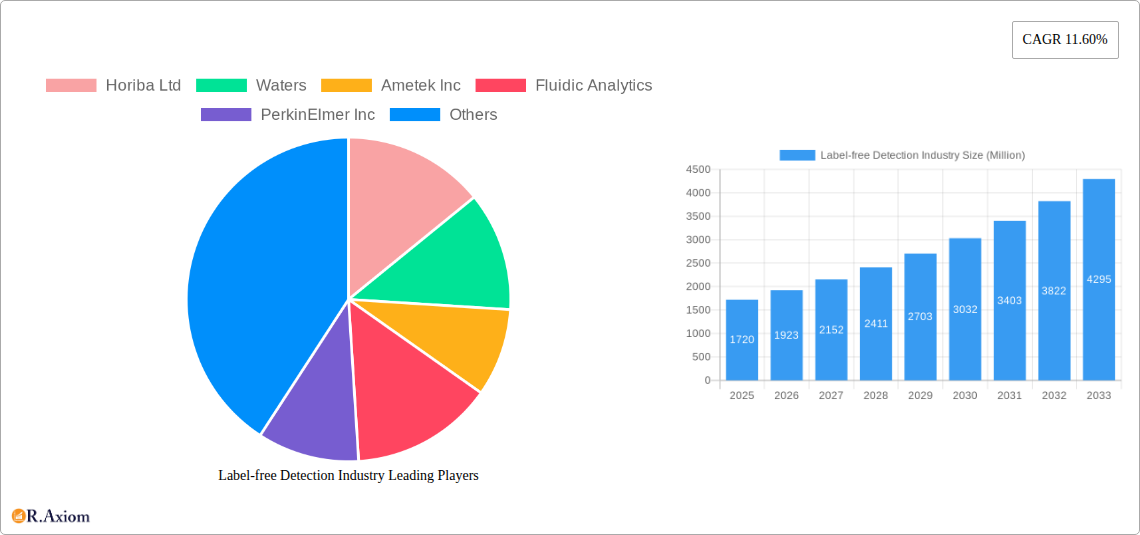
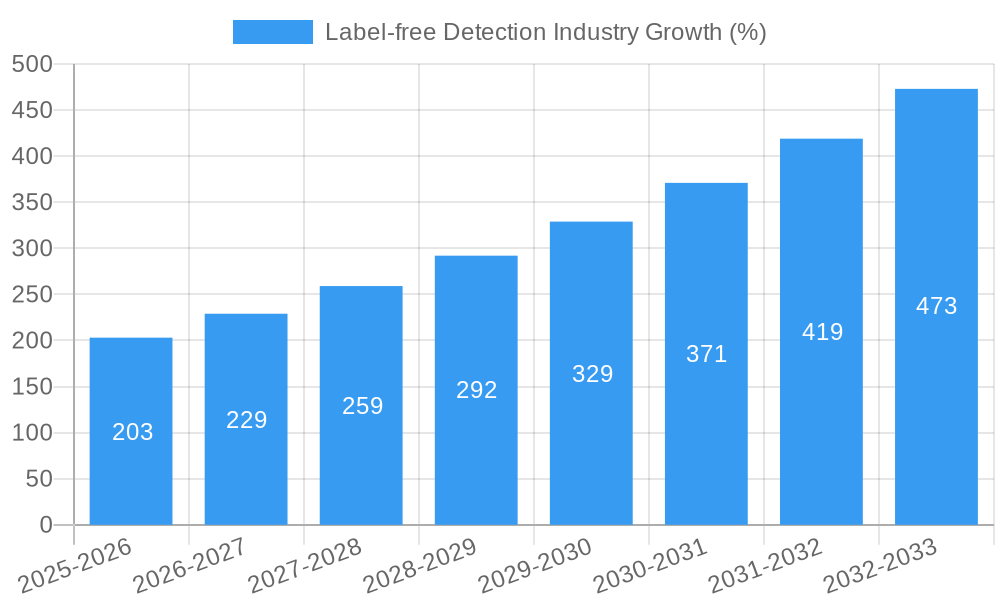
The label-free detection market, valued at $1.72 billion in 2025, is projected to experience robust growth, driven by a compound annual growth rate (CAGR) of 11.60% from 2025 to 2033. This expansion is fueled by several key factors. The increasing demand for high-throughput screening in drug discovery and development within the pharmaceutical and biotechnology sectors is a major catalyst. Advancements in technologies like surface plasmon resonance (SPR), bio-layer interferometry (BLI), and mass spectrometry (MS) are providing more sensitive and efficient label-free detection methods, enabling researchers to analyze biomolecular interactions with greater accuracy. Furthermore, the rising prevalence of chronic diseases globally is increasing the need for faster and more efficient diagnostic tools, further boosting market growth. Academic and research institutions are also significantly contributing to the market expansion through their continuous research and development efforts in this area. The segment encompassing consumables, including microplates and reagents, is expected to witness significant growth due to the high consumption rates in various applications.
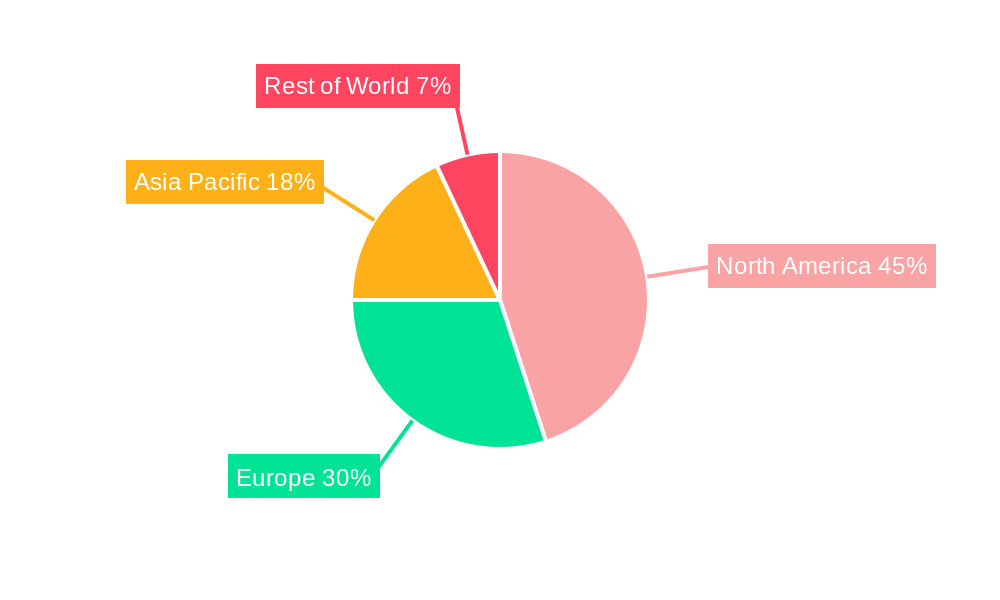
Growth within specific application areas, such as binding kinetics and thermodynamics studies, endogenous receptor detection, hit confirmation in drug discovery, and lead generation, are all significant contributors to the overall market expansion. While technological advancements drive the market forward, challenges remain. High instrument costs and the need for specialized expertise can limit market penetration, particularly in smaller research facilities. However, the ongoing development of more cost-effective instruments and user-friendly software is gradually addressing these limitations. The geographical distribution of the market shows strong growth in North America and Europe, owing to established research infrastructures and a high concentration of pharmaceutical and biotech companies. However, emerging markets in Asia-Pacific are also showing considerable potential for future growth, driven by increased investment in research and development and a rising demand for advanced diagnostic tools.
This detailed report provides a comprehensive analysis of the Label-free Detection (LFD) industry, encompassing market size, growth drivers, competitive landscape, and future projections from 2019 to 2033. The study period covers the historical period (2019-2024), the base year (2025), and the forecast period (2025-2033). This report is invaluable for industry stakeholders, investors, and researchers seeking actionable insights into this rapidly evolving market. The total market size in 2025 is estimated at $XX Million.
Label-free Detection Industry Market Concentration & Innovation
The Label-free Detection market exhibits a moderately concentrated landscape, with several key players holding significant market share. While precise market share data for each company requires further specific research, players like Thermo Fisher Scientific, Horiba Ltd, Waters, and Ametek Inc are prominent. The overall market is characterized by intense competition, driven by continuous innovation in technologies like Surface Plasmon Resonance (SPR), Bio-Layer Interferometry (BLI), and Mass Spectrometry.
Innovation Drivers:
- Advancements in miniaturization and automation of LFD systems.
- Development of novel technologies for higher sensitivity and throughput.
- Growing demand for faster and more cost-effective drug discovery and development.
Regulatory Frameworks: Stringent regulatory guidelines for medical devices and pharmaceuticals significantly impact the LFD market, particularly concerning data accuracy and validation.
Product Substitutes: While no direct substitutes exist for LFD, alternative techniques like ELISA and other label-based assays present some competition, especially in specific applications.
End-User Trends: The increasing adoption of LFD technologies by Pharmaceutical & Biotechnology Companies is a major market driver, followed by Academic & Research Institutes and Contract Research Organizations (CROs).
M&A Activities: The LFD industry has witnessed several mergers and acquisitions (M&A) in recent years, with deal values ranging from $XX Million to $XX Million. These activities reflect the strategic importance of LFD technologies and efforts to consolidate market share.
Label-free Detection Industry Industry Trends & Insights
The Label-free Detection market is experiencing robust growth, fueled by several key factors. The Compound Annual Growth Rate (CAGR) during the forecast period (2025-2033) is projected at XX%. This growth is primarily attributed to the increasing demand for high-throughput screening in drug discovery, personalized medicine, and diagnostics.
Technological disruptions, such as the development of novel label-free technologies and improved data analysis tools, are further accelerating market growth. The market penetration of LFD technologies in various applications, such as binding kinetics and thermodynamics studies, is continually expanding. Consumer preferences are increasingly shifting toward label-free technologies due to their inherent advantages, including reduced assay complexity, higher sensitivity, and lower costs. Competitive dynamics are characterized by a mix of intense competition among established players and emergence of innovative startups offering niche solutions. The market is also influenced by factors such as increasing research funding, government initiatives, and collaborations within the industry.
Dominant Markets & Segments in Label-free Detection Industry
The Pharmaceutical & Biotechnology Companies segment holds the largest market share among end-users, driven by the high demand for efficient drug discovery and development tools. North America is currently the dominant region, followed by Europe and Asia Pacific. Within applications, Binding Kinetics and Binding Thermodynamics are major segments. Instruments constitute the largest product segment, accounting for approximately XX% of the overall market value. Regarding technology, Surface Plasmon Resonance (SPR) and Bio-Layer Interferometry (BLI) hold leading positions.
Key Drivers by Segment:
- Pharmaceutical & Biotechnology Companies: High R&D spending, increasing drug discovery needs, and technological advancements.
- Academic & Research Institutes: Growing research funding and interest in life science research.
- Contract Research Organizations (CROs): Increasing outsourcing of research activities by pharmaceutical companies.
- Instruments: High demand for sophisticated and high-throughput systems.
- SPR & BLI: High sensitivity, ease of use, and established market presence.
Label-free Detection Industry Product Developments
Recent product innovations in the LFD market highlight a trend towards higher throughput, improved sensitivity, and miniaturization. Several companies have launched new instruments and consumables with enhanced features, catering to specific application requirements. For example, the introduction of advanced SPR and BLI systems with improved data analysis software is enhancing the accuracy and efficiency of label-free assays. These developments are aimed at enhancing market fit by addressing specific unmet needs and increasing user adoption.
Report Scope & Segmentation Analysis
This report segments the Label-free Detection market across various parameters:
Application: Binding Kinetics, Binding Thermodynamics, Endogenous Receptor Detection, Hit Confirmation, Lead Generation, Other Applications. Each application segment demonstrates unique growth trajectories reflecting specific market demands.
End-User: Pharmaceutical & Biotechnology Companies, Academic & Research Institutes, Contract Research Organizations. Market size and growth projections vary based on the specific end-user needs and adoption rates.
Product: Consumables, Microplates, Instruments. The instrument segment displays the highest market value, driven by the high cost of sophisticated analytical equipment.
Technology: Mass Spectrometry, Surface Plasmon Resonance (SPR), Bio-Layer Interferometry (BLI), Isothermal Titration Calorimetry, Differential Scanning Calorimetry, Other LFD Technologies. SPR and BLI hold substantial market share, yet other technologies present growth potential.
Key Drivers of Label-free Detection Industry Growth
The LFD market's growth is driven by several factors: the increasing demand for high-throughput screening in drug discovery, the rising prevalence of chronic diseases leading to increased research funding, advancements in label-free technologies offering higher sensitivity and ease of use, and the growing adoption of personalized medicine approaches. Stringent regulatory requirements, while posing challenges, also indirectly stimulate demand for reliable and validated LFD systems.
Challenges in the Label-free Detection Industry Sector
Challenges include the high cost of advanced instruments, the need for skilled personnel to operate complex equipment, and the potential for data interpretation complexities requiring sophisticated software. The availability of qualified technical support can also impact market expansion. Supply chain disruptions and intense competition among established and emerging players pose additional obstacles.
Emerging Opportunities in Label-free Detection Industry
Emerging opportunities lie in the development of point-of-care diagnostics, miniaturized LFD devices for field applications, and the integration of artificial intelligence and machine learning for improved data analysis. Expanding into emerging markets and exploring new applications in areas such as environmental monitoring and food safety also offer significant growth potential.
Leading Players in the Label-free Detection Industry Market
- Horiba Ltd
- Waters
- Ametek Inc
- Fluidic Analytics
- PerkinElmer Inc
- Malvern Panalytical
- Thermo Fisher Scientific
- Corning Incorporated
- Cytiva (Danaher Corporation)
- Shimadzu Corporation
Key Developments in Label-free Detection Industry Industry
- March 2021: Sartorius launched the Octet R series of high-performance label-free analytical systems, enhancing its product portfolio.
- October 2021: Gator Bio, Inc. introduced Gator SMAP and Gator mFC probes for small molecule-protein kinetics studies and hybridoma screening, expanding applications within BLI.
- August 2022: Bruker Corporation launched the nanoElute 2 nano-LC system, MetaboScape, and TASQ 2023 software, supporting advancements in protein-protein interaction research and metaproteomics.
Strategic Outlook for Label-free Detection Industry Market
The Label-free Detection market is poised for continued growth, driven by ongoing technological advancements, increasing R&D spending, and expanding applications in various fields. Strategic collaborations, mergers, and acquisitions will likely shape the market landscape, leading to increased innovation and broader market penetration. The focus on developing user-friendly, cost-effective, and highly sensitive systems will be crucial for market success in the coming years.
Label-free Detection Industry Segmentation
-
1. Product
-
1.1. Consumables
- 1.1.1. Biosensor Chips
- 1.1.2. Microplates
- 1.2. Instruments
-
1.1. Consumables
-
2. Technology
- 2.1. Mass Spectrometry
- 2.2. Surface Plasmon Resonance (SPR)
- 2.3. Bio-Layer Interferometry
- 2.4. Isothermal Titration Calorimetry
- 2.5. Differential Scanning Calorimetry
- 2.6. Other LFD Technologies
-
3. Application
- 3.1. Binding Kinetics
- 3.2. Binding Thermodynamics
- 3.3. Endogenous Receptor Detection
- 3.4. Hit Confirmation
- 3.5. Lead Generation
- 3.6. Other Applications
-
4. End-User
- 4.1. Pharmaceutical & Biotechnology Companies
- 4.2. Academic & Research Institutes
- 4.3. Contract Research Organizations
Label-free Detection Industry Segmentation By Geography
-
1. North America
- 1.1. United States
- 1.2. Canada
- 1.3. Mexico
-
2. Europe
- 2.1. Germany
- 2.2. United Kingdom
- 2.3. France
- 2.4. Italy
- 2.5. Spain
- 2.6. Rest of Europe
-
3. Asia Pacific
- 3.1. China
- 3.2. Japan
- 3.3. India
- 3.4. Australia
- 3.5. South Korea
- 3.6. Rest of Asia Pacific
-
4. Middle East and Africa
- 4.1. GCC
- 4.2. South Africa
- 4.3. Rest of Middle East and Africa
-
5. South America
- 5.1. Brazil
- 5.2. Argentina
- 5.3. Rest of South America
Label-free Detection Industry REPORT HIGHLIGHTS
| Aspects | Details |
|---|---|
| Study Period | 2019-2033 |
| Base Year | 2024 |
| Estimated Year | 2025 |
| Forecast Period | 2025-2033 |
| Historical Period | 2019-2024 |
| Growth Rate | CAGR of 11.60% from 2019-2033 |
| Segmentation |
|
Table of Contents
- 1. Introduction
- 1.1. Research Scope
- 1.2. Market Segmentation
- 1.3. Research Methodology
- 1.4. Definitions and Assumptions
- 2. Executive Summary
- 2.1. Introduction
- 3. Market Dynamics
- 3.1. Introduction
- 3.2. Market Drivers
- 3.2.1. Increasing R&D Activities Through Research Partnerships Between Pharmaceutical Companies and Academic Institutes; Innovations in Label-free Detection Technologies
- 3.3. Market Restrains
- 3.3.1. High Cost of Instruments; Issues in Sensitivty and Throughput
- 3.4. Market Trends
- 3.4.1. Surface Plasmon Resonance (SPR) Segment is Expected to Hold Largest Share of Global Label-Free Detection (LFD) Market
- 4. Market Factor Analysis
- 4.1. Porters Five Forces
- 4.2. Supply/Value Chain
- 4.3. PESTEL analysis
- 4.4. Market Entropy
- 4.5. Patent/Trademark Analysis
- 5. Global Label-free Detection Industry Analysis, Insights and Forecast, 2019-2031
- 5.1. Market Analysis, Insights and Forecast - by Product
- 5.1.1. Consumables
- 5.1.1.1. Biosensor Chips
- 5.1.1.2. Microplates
- 5.1.2. Instruments
- 5.1.1. Consumables
- 5.2. Market Analysis, Insights and Forecast - by Technology
- 5.2.1. Mass Spectrometry
- 5.2.2. Surface Plasmon Resonance (SPR)
- 5.2.3. Bio-Layer Interferometry
- 5.2.4. Isothermal Titration Calorimetry
- 5.2.5. Differential Scanning Calorimetry
- 5.2.6. Other LFD Technologies
- 5.3. Market Analysis, Insights and Forecast - by Application
- 5.3.1. Binding Kinetics
- 5.3.2. Binding Thermodynamics
- 5.3.3. Endogenous Receptor Detection
- 5.3.4. Hit Confirmation
- 5.3.5. Lead Generation
- 5.3.6. Other Applications
- 5.4. Market Analysis, Insights and Forecast - by End-User
- 5.4.1. Pharmaceutical & Biotechnology Companies
- 5.4.2. Academic & Research Institutes
- 5.4.3. Contract Research Organizations
- 5.5. Market Analysis, Insights and Forecast - by Region
- 5.5.1. North America
- 5.5.2. Europe
- 5.5.3. Asia Pacific
- 5.5.4. Middle East and Africa
- 5.5.5. South America
- 5.1. Market Analysis, Insights and Forecast - by Product
- 6. North America Label-free Detection Industry Analysis, Insights and Forecast, 2019-2031
- 6.1. Market Analysis, Insights and Forecast - by Product
- 6.1.1. Consumables
- 6.1.1.1. Biosensor Chips
- 6.1.1.2. Microplates
- 6.1.2. Instruments
- 6.1.1. Consumables
- 6.2. Market Analysis, Insights and Forecast - by Technology
- 6.2.1. Mass Spectrometry
- 6.2.2. Surface Plasmon Resonance (SPR)
- 6.2.3. Bio-Layer Interferometry
- 6.2.4. Isothermal Titration Calorimetry
- 6.2.5. Differential Scanning Calorimetry
- 6.2.6. Other LFD Technologies
- 6.3. Market Analysis, Insights and Forecast - by Application
- 6.3.1. Binding Kinetics
- 6.3.2. Binding Thermodynamics
- 6.3.3. Endogenous Receptor Detection
- 6.3.4. Hit Confirmation
- 6.3.5. Lead Generation
- 6.3.6. Other Applications
- 6.4. Market Analysis, Insights and Forecast - by End-User
- 6.4.1. Pharmaceutical & Biotechnology Companies
- 6.4.2. Academic & Research Institutes
- 6.4.3. Contract Research Organizations
- 6.1. Market Analysis, Insights and Forecast - by Product
- 7. Europe Label-free Detection Industry Analysis, Insights and Forecast, 2019-2031
- 7.1. Market Analysis, Insights and Forecast - by Product
- 7.1.1. Consumables
- 7.1.1.1. Biosensor Chips
- 7.1.1.2. Microplates
- 7.1.2. Instruments
- 7.1.1. Consumables
- 7.2. Market Analysis, Insights and Forecast - by Technology
- 7.2.1. Mass Spectrometry
- 7.2.2. Surface Plasmon Resonance (SPR)
- 7.2.3. Bio-Layer Interferometry
- 7.2.4. Isothermal Titration Calorimetry
- 7.2.5. Differential Scanning Calorimetry
- 7.2.6. Other LFD Technologies
- 7.3. Market Analysis, Insights and Forecast - by Application
- 7.3.1. Binding Kinetics
- 7.3.2. Binding Thermodynamics
- 7.3.3. Endogenous Receptor Detection
- 7.3.4. Hit Confirmation
- 7.3.5. Lead Generation
- 7.3.6. Other Applications
- 7.4. Market Analysis, Insights and Forecast - by End-User
- 7.4.1. Pharmaceutical & Biotechnology Companies
- 7.4.2. Academic & Research Institutes
- 7.4.3. Contract Research Organizations
- 7.1. Market Analysis, Insights and Forecast - by Product
- 8. Asia Pacific Label-free Detection Industry Analysis, Insights and Forecast, 2019-2031
- 8.1. Market Analysis, Insights and Forecast - by Product
- 8.1.1. Consumables
- 8.1.1.1. Biosensor Chips
- 8.1.1.2. Microplates
- 8.1.2. Instruments
- 8.1.1. Consumables
- 8.2. Market Analysis, Insights and Forecast - by Technology
- 8.2.1. Mass Spectrometry
- 8.2.2. Surface Plasmon Resonance (SPR)
- 8.2.3. Bio-Layer Interferometry
- 8.2.4. Isothermal Titration Calorimetry
- 8.2.5. Differential Scanning Calorimetry
- 8.2.6. Other LFD Technologies
- 8.3. Market Analysis, Insights and Forecast - by Application
- 8.3.1. Binding Kinetics
- 8.3.2. Binding Thermodynamics
- 8.3.3. Endogenous Receptor Detection
- 8.3.4. Hit Confirmation
- 8.3.5. Lead Generation
- 8.3.6. Other Applications
- 8.4. Market Analysis, Insights and Forecast - by End-User
- 8.4.1. Pharmaceutical & Biotechnology Companies
- 8.4.2. Academic & Research Institutes
- 8.4.3. Contract Research Organizations
- 8.1. Market Analysis, Insights and Forecast - by Product
- 9. Middle East and Africa Label-free Detection Industry Analysis, Insights and Forecast, 2019-2031
- 9.1. Market Analysis, Insights and Forecast - by Product
- 9.1.1. Consumables
- 9.1.1.1. Biosensor Chips
- 9.1.1.2. Microplates
- 9.1.2. Instruments
- 9.1.1. Consumables
- 9.2. Market Analysis, Insights and Forecast - by Technology
- 9.2.1. Mass Spectrometry
- 9.2.2. Surface Plasmon Resonance (SPR)
- 9.2.3. Bio-Layer Interferometry
- 9.2.4. Isothermal Titration Calorimetry
- 9.2.5. Differential Scanning Calorimetry
- 9.2.6. Other LFD Technologies
- 9.3. Market Analysis, Insights and Forecast - by Application
- 9.3.1. Binding Kinetics
- 9.3.2. Binding Thermodynamics
- 9.3.3. Endogenous Receptor Detection
- 9.3.4. Hit Confirmation
- 9.3.5. Lead Generation
- 9.3.6. Other Applications
- 9.4. Market Analysis, Insights and Forecast - by End-User
- 9.4.1. Pharmaceutical & Biotechnology Companies
- 9.4.2. Academic & Research Institutes
- 9.4.3. Contract Research Organizations
- 9.1. Market Analysis, Insights and Forecast - by Product
- 10. South America Label-free Detection Industry Analysis, Insights and Forecast, 2019-2031
- 10.1. Market Analysis, Insights and Forecast - by Product
- 10.1.1. Consumables
- 10.1.1.1. Biosensor Chips
- 10.1.1.2. Microplates
- 10.1.2. Instruments
- 10.1.1. Consumables
- 10.2. Market Analysis, Insights and Forecast - by Technology
- 10.2.1. Mass Spectrometry
- 10.2.2. Surface Plasmon Resonance (SPR)
- 10.2.3. Bio-Layer Interferometry
- 10.2.4. Isothermal Titration Calorimetry
- 10.2.5. Differential Scanning Calorimetry
- 10.2.6. Other LFD Technologies
- 10.3. Market Analysis, Insights and Forecast - by Application
- 10.3.1. Binding Kinetics
- 10.3.2. Binding Thermodynamics
- 10.3.3. Endogenous Receptor Detection
- 10.3.4. Hit Confirmation
- 10.3.5. Lead Generation
- 10.3.6. Other Applications
- 10.4. Market Analysis, Insights and Forecast - by End-User
- 10.4.1. Pharmaceutical & Biotechnology Companies
- 10.4.2. Academic & Research Institutes
- 10.4.3. Contract Research Organizations
- 10.1. Market Analysis, Insights and Forecast - by Product
- 11. North America Label-free Detection Industry Analysis, Insights and Forecast, 2019-2031
- 11.1. Market Analysis, Insights and Forecast - By Country/Sub-region
- 11.1.1 United States
- 11.1.2 Canada
- 11.1.3 Mexico
- 12. South America Label-free Detection Industry Analysis, Insights and Forecast, 2019-2031
- 12.1. Market Analysis, Insights and Forecast - By Country/Sub-region
- 12.1.1 Brazil
- 12.1.2 Mexico
- 12.1.3 Rest of South America
- 13. Europe Label-free Detection Industry Analysis, Insights and Forecast, 2019-2031
- 13.1. Market Analysis, Insights and Forecast - By Country/Sub-region
- 13.1.1 United Kingdom
- 13.1.2 Germany
- 13.1.3 France
- 13.1.4 Italy
- 13.1.5 Spain
- 13.1.6 Russia
- 13.1.7 Rest of Europe
- 14. Asia Pacific Label-free Detection Industry Analysis, Insights and Forecast, 2019-2031
- 14.1. Market Analysis, Insights and Forecast - By Country/Sub-region
- 14.1.1 China
- 14.1.2 Japan
- 14.1.3 India
- 14.1.4 South Korea
- 14.1.5 Taiwan
- 14.1.6 Australia
- 14.1.7 Rest of Asia-Pacific
- 15. MEA Label-free Detection Industry Analysis, Insights and Forecast, 2019-2031
- 15.1. Market Analysis, Insights and Forecast - By Country/Sub-region
- 15.1.1 Middle East
- 15.1.2 Africa
- 16. Competitive Analysis
- 16.1. Global Market Share Analysis 2024
- 16.2. Company Profiles
- 16.2.1 Horiba Ltd
- 16.2.1.1. Overview
- 16.2.1.2. Products
- 16.2.1.3. SWOT Analysis
- 16.2.1.4. Recent Developments
- 16.2.1.5. Financials (Based on Availability)
- 16.2.2 Waters
- 16.2.2.1. Overview
- 16.2.2.2. Products
- 16.2.2.3. SWOT Analysis
- 16.2.2.4. Recent Developments
- 16.2.2.5. Financials (Based on Availability)
- 16.2.3 Ametek Inc
- 16.2.3.1. Overview
- 16.2.3.2. Products
- 16.2.3.3. SWOT Analysis
- 16.2.3.4. Recent Developments
- 16.2.3.5. Financials (Based on Availability)
- 16.2.4 Fluidic Analytics
- 16.2.4.1. Overview
- 16.2.4.2. Products
- 16.2.4.3. SWOT Analysis
- 16.2.4.4. Recent Developments
- 16.2.4.5. Financials (Based on Availability)
- 16.2.5 PerkinElmer Inc
- 16.2.5.1. Overview
- 16.2.5.2. Products
- 16.2.5.3. SWOT Analysis
- 16.2.5.4. Recent Developments
- 16.2.5.5. Financials (Based on Availability)
- 16.2.6 Malvern Panalytical
- 16.2.6.1. Overview
- 16.2.6.2. Products
- 16.2.6.3. SWOT Analysis
- 16.2.6.4. Recent Developments
- 16.2.6.5. Financials (Based on Availability)
- 16.2.7 Thermo Fisher Scientific
- 16.2.7.1. Overview
- 16.2.7.2. Products
- 16.2.7.3. SWOT Analysis
- 16.2.7.4. Recent Developments
- 16.2.7.5. Financials (Based on Availability)
- 16.2.8 Corning Incorporated
- 16.2.8.1. Overview
- 16.2.8.2. Products
- 16.2.8.3. SWOT Analysis
- 16.2.8.4. Recent Developments
- 16.2.8.5. Financials (Based on Availability)
- 16.2.9 Cytiva (Danaher Corporation)
- 16.2.9.1. Overview
- 16.2.9.2. Products
- 16.2.9.3. SWOT Analysis
- 16.2.9.4. Recent Developments
- 16.2.9.5. Financials (Based on Availability)
- 16.2.10 Shimadzu Corporation
- 16.2.10.1. Overview
- 16.2.10.2. Products
- 16.2.10.3. SWOT Analysis
- 16.2.10.4. Recent Developments
- 16.2.10.5. Financials (Based on Availability)
- 16.2.1 Horiba Ltd
List of Figures
- Figure 1: Global Label-free Detection Industry Revenue Breakdown (Million, %) by Region 2024 & 2032
- Figure 2: North America Label-free Detection Industry Revenue (Million), by Country 2024 & 2032
- Figure 3: North America Label-free Detection Industry Revenue Share (%), by Country 2024 & 2032
- Figure 4: South America Label-free Detection Industry Revenue (Million), by Country 2024 & 2032
- Figure 5: South America Label-free Detection Industry Revenue Share (%), by Country 2024 & 2032
- Figure 6: Europe Label-free Detection Industry Revenue (Million), by Country 2024 & 2032
- Figure 7: Europe Label-free Detection Industry Revenue Share (%), by Country 2024 & 2032
- Figure 8: Asia Pacific Label-free Detection Industry Revenue (Million), by Country 2024 & 2032
- Figure 9: Asia Pacific Label-free Detection Industry Revenue Share (%), by Country 2024 & 2032
- Figure 10: MEA Label-free Detection Industry Revenue (Million), by Country 2024 & 2032
- Figure 11: MEA Label-free Detection Industry Revenue Share (%), by Country 2024 & 2032
- Figure 12: North America Label-free Detection Industry Revenue (Million), by Product 2024 & 2032
- Figure 13: North America Label-free Detection Industry Revenue Share (%), by Product 2024 & 2032
- Figure 14: North America Label-free Detection Industry Revenue (Million), by Technology 2024 & 2032
- Figure 15: North America Label-free Detection Industry Revenue Share (%), by Technology 2024 & 2032
- Figure 16: North America Label-free Detection Industry Revenue (Million), by Application 2024 & 2032
- Figure 17: North America Label-free Detection Industry Revenue Share (%), by Application 2024 & 2032
- Figure 18: North America Label-free Detection Industry Revenue (Million), by End-User 2024 & 2032
- Figure 19: North America Label-free Detection Industry Revenue Share (%), by End-User 2024 & 2032
- Figure 20: North America Label-free Detection Industry Revenue (Million), by Country 2024 & 2032
- Figure 21: North America Label-free Detection Industry Revenue Share (%), by Country 2024 & 2032
- Figure 22: Europe Label-free Detection Industry Revenue (Million), by Product 2024 & 2032
- Figure 23: Europe Label-free Detection Industry Revenue Share (%), by Product 2024 & 2032
- Figure 24: Europe Label-free Detection Industry Revenue (Million), by Technology 2024 & 2032
- Figure 25: Europe Label-free Detection Industry Revenue Share (%), by Technology 2024 & 2032
- Figure 26: Europe Label-free Detection Industry Revenue (Million), by Application 2024 & 2032
- Figure 27: Europe Label-free Detection Industry Revenue Share (%), by Application 2024 & 2032
- Figure 28: Europe Label-free Detection Industry Revenue (Million), by End-User 2024 & 2032
- Figure 29: Europe Label-free Detection Industry Revenue Share (%), by End-User 2024 & 2032
- Figure 30: Europe Label-free Detection Industry Revenue (Million), by Country 2024 & 2032
- Figure 31: Europe Label-free Detection Industry Revenue Share (%), by Country 2024 & 2032
- Figure 32: Asia Pacific Label-free Detection Industry Revenue (Million), by Product 2024 & 2032
- Figure 33: Asia Pacific Label-free Detection Industry Revenue Share (%), by Product 2024 & 2032
- Figure 34: Asia Pacific Label-free Detection Industry Revenue (Million), by Technology 2024 & 2032
- Figure 35: Asia Pacific Label-free Detection Industry Revenue Share (%), by Technology 2024 & 2032
- Figure 36: Asia Pacific Label-free Detection Industry Revenue (Million), by Application 2024 & 2032
- Figure 37: Asia Pacific Label-free Detection Industry Revenue Share (%), by Application 2024 & 2032
- Figure 38: Asia Pacific Label-free Detection Industry Revenue (Million), by End-User 2024 & 2032
- Figure 39: Asia Pacific Label-free Detection Industry Revenue Share (%), by End-User 2024 & 2032
- Figure 40: Asia Pacific Label-free Detection Industry Revenue (Million), by Country 2024 & 2032
- Figure 41: Asia Pacific Label-free Detection Industry Revenue Share (%), by Country 2024 & 2032
- Figure 42: Middle East and Africa Label-free Detection Industry Revenue (Million), by Product 2024 & 2032
- Figure 43: Middle East and Africa Label-free Detection Industry Revenue Share (%), by Product 2024 & 2032
- Figure 44: Middle East and Africa Label-free Detection Industry Revenue (Million), by Technology 2024 & 2032
- Figure 45: Middle East and Africa Label-free Detection Industry Revenue Share (%), by Technology 2024 & 2032
- Figure 46: Middle East and Africa Label-free Detection Industry Revenue (Million), by Application 2024 & 2032
- Figure 47: Middle East and Africa Label-free Detection Industry Revenue Share (%), by Application 2024 & 2032
- Figure 48: Middle East and Africa Label-free Detection Industry Revenue (Million), by End-User 2024 & 2032
- Figure 49: Middle East and Africa Label-free Detection Industry Revenue Share (%), by End-User 2024 & 2032
- Figure 50: Middle East and Africa Label-free Detection Industry Revenue (Million), by Country 2024 & 2032
- Figure 51: Middle East and Africa Label-free Detection Industry Revenue Share (%), by Country 2024 & 2032
- Figure 52: South America Label-free Detection Industry Revenue (Million), by Product 2024 & 2032
- Figure 53: South America Label-free Detection Industry Revenue Share (%), by Product 2024 & 2032
- Figure 54: South America Label-free Detection Industry Revenue (Million), by Technology 2024 & 2032
- Figure 55: South America Label-free Detection Industry Revenue Share (%), by Technology 2024 & 2032
- Figure 56: South America Label-free Detection Industry Revenue (Million), by Application 2024 & 2032
- Figure 57: South America Label-free Detection Industry Revenue Share (%), by Application 2024 & 2032
- Figure 58: South America Label-free Detection Industry Revenue (Million), by End-User 2024 & 2032
- Figure 59: South America Label-free Detection Industry Revenue Share (%), by End-User 2024 & 2032
- Figure 60: South America Label-free Detection Industry Revenue (Million), by Country 2024 & 2032
- Figure 61: South America Label-free Detection Industry Revenue Share (%), by Country 2024 & 2032
List of Tables
- Table 1: Global Label-free Detection Industry Revenue Million Forecast, by Region 2019 & 2032
- Table 2: Global Label-free Detection Industry Revenue Million Forecast, by Product 2019 & 2032
- Table 3: Global Label-free Detection Industry Revenue Million Forecast, by Technology 2019 & 2032
- Table 4: Global Label-free Detection Industry Revenue Million Forecast, by Application 2019 & 2032
- Table 5: Global Label-free Detection Industry Revenue Million Forecast, by End-User 2019 & 2032
- Table 6: Global Label-free Detection Industry Revenue Million Forecast, by Region 2019 & 2032
- Table 7: Global Label-free Detection Industry Revenue Million Forecast, by Country 2019 & 2032
- Table 8: United States Label-free Detection Industry Revenue (Million) Forecast, by Application 2019 & 2032
- Table 9: Canada Label-free Detection Industry Revenue (Million) Forecast, by Application 2019 & 2032
- Table 10: Mexico Label-free Detection Industry Revenue (Million) Forecast, by Application 2019 & 2032
- Table 11: Global Label-free Detection Industry Revenue Million Forecast, by Country 2019 & 2032
- Table 12: Brazil Label-free Detection Industry Revenue (Million) Forecast, by Application 2019 & 2032
- Table 13: Mexico Label-free Detection Industry Revenue (Million) Forecast, by Application 2019 & 2032
- Table 14: Rest of South America Label-free Detection Industry Revenue (Million) Forecast, by Application 2019 & 2032
- Table 15: Global Label-free Detection Industry Revenue Million Forecast, by Country 2019 & 2032
- Table 16: United Kingdom Label-free Detection Industry Revenue (Million) Forecast, by Application 2019 & 2032
- Table 17: Germany Label-free Detection Industry Revenue (Million) Forecast, by Application 2019 & 2032
- Table 18: France Label-free Detection Industry Revenue (Million) Forecast, by Application 2019 & 2032
- Table 19: Italy Label-free Detection Industry Revenue (Million) Forecast, by Application 2019 & 2032
- Table 20: Spain Label-free Detection Industry Revenue (Million) Forecast, by Application 2019 & 2032
- Table 21: Russia Label-free Detection Industry Revenue (Million) Forecast, by Application 2019 & 2032
- Table 22: Rest of Europe Label-free Detection Industry Revenue (Million) Forecast, by Application 2019 & 2032
- Table 23: Global Label-free Detection Industry Revenue Million Forecast, by Country 2019 & 2032
- Table 24: China Label-free Detection Industry Revenue (Million) Forecast, by Application 2019 & 2032
- Table 25: Japan Label-free Detection Industry Revenue (Million) Forecast, by Application 2019 & 2032
- Table 26: India Label-free Detection Industry Revenue (Million) Forecast, by Application 2019 & 2032
- Table 27: South Korea Label-free Detection Industry Revenue (Million) Forecast, by Application 2019 & 2032
- Table 28: Taiwan Label-free Detection Industry Revenue (Million) Forecast, by Application 2019 & 2032
- Table 29: Australia Label-free Detection Industry Revenue (Million) Forecast, by Application 2019 & 2032
- Table 30: Rest of Asia-Pacific Label-free Detection Industry Revenue (Million) Forecast, by Application 2019 & 2032
- Table 31: Global Label-free Detection Industry Revenue Million Forecast, by Country 2019 & 2032
- Table 32: Middle East Label-free Detection Industry Revenue (Million) Forecast, by Application 2019 & 2032
- Table 33: Africa Label-free Detection Industry Revenue (Million) Forecast, by Application 2019 & 2032
- Table 34: Global Label-free Detection Industry Revenue Million Forecast, by Product 2019 & 2032
- Table 35: Global Label-free Detection Industry Revenue Million Forecast, by Technology 2019 & 2032
- Table 36: Global Label-free Detection Industry Revenue Million Forecast, by Application 2019 & 2032
- Table 37: Global Label-free Detection Industry Revenue Million Forecast, by End-User 2019 & 2032
- Table 38: Global Label-free Detection Industry Revenue Million Forecast, by Country 2019 & 2032
- Table 39: United States Label-free Detection Industry Revenue (Million) Forecast, by Application 2019 & 2032
- Table 40: Canada Label-free Detection Industry Revenue (Million) Forecast, by Application 2019 & 2032
- Table 41: Mexico Label-free Detection Industry Revenue (Million) Forecast, by Application 2019 & 2032
- Table 42: Global Label-free Detection Industry Revenue Million Forecast, by Product 2019 & 2032
- Table 43: Global Label-free Detection Industry Revenue Million Forecast, by Technology 2019 & 2032
- Table 44: Global Label-free Detection Industry Revenue Million Forecast, by Application 2019 & 2032
- Table 45: Global Label-free Detection Industry Revenue Million Forecast, by End-User 2019 & 2032
- Table 46: Global Label-free Detection Industry Revenue Million Forecast, by Country 2019 & 2032
- Table 47: Germany Label-free Detection Industry Revenue (Million) Forecast, by Application 2019 & 2032
- Table 48: United Kingdom Label-free Detection Industry Revenue (Million) Forecast, by Application 2019 & 2032
- Table 49: France Label-free Detection Industry Revenue (Million) Forecast, by Application 2019 & 2032
- Table 50: Italy Label-free Detection Industry Revenue (Million) Forecast, by Application 2019 & 2032
- Table 51: Spain Label-free Detection Industry Revenue (Million) Forecast, by Application 2019 & 2032
- Table 52: Rest of Europe Label-free Detection Industry Revenue (Million) Forecast, by Application 2019 & 2032
- Table 53: Global Label-free Detection Industry Revenue Million Forecast, by Product 2019 & 2032
- Table 54: Global Label-free Detection Industry Revenue Million Forecast, by Technology 2019 & 2032
- Table 55: Global Label-free Detection Industry Revenue Million Forecast, by Application 2019 & 2032
- Table 56: Global Label-free Detection Industry Revenue Million Forecast, by End-User 2019 & 2032
- Table 57: Global Label-free Detection Industry Revenue Million Forecast, by Country 2019 & 2032
- Table 58: China Label-free Detection Industry Revenue (Million) Forecast, by Application 2019 & 2032
- Table 59: Japan Label-free Detection Industry Revenue (Million) Forecast, by Application 2019 & 2032
- Table 60: India Label-free Detection Industry Revenue (Million) Forecast, by Application 2019 & 2032
- Table 61: Australia Label-free Detection Industry Revenue (Million) Forecast, by Application 2019 & 2032
- Table 62: South Korea Label-free Detection Industry Revenue (Million) Forecast, by Application 2019 & 2032
- Table 63: Rest of Asia Pacific Label-free Detection Industry Revenue (Million) Forecast, by Application 2019 & 2032
- Table 64: Global Label-free Detection Industry Revenue Million Forecast, by Product 2019 & 2032
- Table 65: Global Label-free Detection Industry Revenue Million Forecast, by Technology 2019 & 2032
- Table 66: Global Label-free Detection Industry Revenue Million Forecast, by Application 2019 & 2032
- Table 67: Global Label-free Detection Industry Revenue Million Forecast, by End-User 2019 & 2032
- Table 68: Global Label-free Detection Industry Revenue Million Forecast, by Country 2019 & 2032
- Table 69: GCC Label-free Detection Industry Revenue (Million) Forecast, by Application 2019 & 2032
- Table 70: South Africa Label-free Detection Industry Revenue (Million) Forecast, by Application 2019 & 2032
- Table 71: Rest of Middle East and Africa Label-free Detection Industry Revenue (Million) Forecast, by Application 2019 & 2032
- Table 72: Global Label-free Detection Industry Revenue Million Forecast, by Product 2019 & 2032
- Table 73: Global Label-free Detection Industry Revenue Million Forecast, by Technology 2019 & 2032
- Table 74: Global Label-free Detection Industry Revenue Million Forecast, by Application 2019 & 2032
- Table 75: Global Label-free Detection Industry Revenue Million Forecast, by End-User 2019 & 2032
- Table 76: Global Label-free Detection Industry Revenue Million Forecast, by Country 2019 & 2032
- Table 77: Brazil Label-free Detection Industry Revenue (Million) Forecast, by Application 2019 & 2032
- Table 78: Argentina Label-free Detection Industry Revenue (Million) Forecast, by Application 2019 & 2032
- Table 79: Rest of South America Label-free Detection Industry Revenue (Million) Forecast, by Application 2019 & 2032
Frequently Asked Questions
1. What is the projected Compound Annual Growth Rate (CAGR) of the Label-free Detection Industry?
The projected CAGR is approximately 11.60%.
2. Which companies are prominent players in the Label-free Detection Industry?
Key companies in the market include Horiba Ltd, Waters, Ametek Inc, Fluidic Analytics, PerkinElmer Inc, Malvern Panalytical, Thermo Fisher Scientific, Corning Incorporated, Cytiva (Danaher Corporation), Shimadzu Corporation.
3. What are the main segments of the Label-free Detection Industry?
The market segments include Product, Technology, Application, End-User.
4. Can you provide details about the market size?
The market size is estimated to be USD 1.72 Million as of 2022.
5. What are some drivers contributing to market growth?
Increasing R&D Activities Through Research Partnerships Between Pharmaceutical Companies and Academic Institutes; Innovations in Label-free Detection Technologies.
6. What are the notable trends driving market growth?
Surface Plasmon Resonance (SPR) Segment is Expected to Hold Largest Share of Global Label-Free Detection (LFD) Market.
7. Are there any restraints impacting market growth?
High Cost of Instruments; Issues in Sensitivty and Throughput.
8. Can you provide examples of recent developments in the market?
August 2022: Bruker Corporation announced the launch of the new nanoElute 2 nano-LC, MetaboScape, and TASQ 2023 software supporting fluxomics and the latest advances in PaSERs intelligent acquisition to enhance research in protein-protein interactions (PPIs) and metaproteomics applications. nanoElute 2 features nano-LC advances that support automated single-cell sample preparation from label-free ProteoCHIP on the CellenONE platform.
9. What pricing options are available for accessing the report?
Pricing options include single-user, multi-user, and enterprise licenses priced at USD 4750, USD 5250, and USD 8750 respectively.
10. Is the market size provided in terms of value or volume?
The market size is provided in terms of value, measured in Million.
11. Are there any specific market keywords associated with the report?
Yes, the market keyword associated with the report is "Label-free Detection Industry," which aids in identifying and referencing the specific market segment covered.
12. How do I determine which pricing option suits my needs best?
The pricing options vary based on user requirements and access needs. Individual users may opt for single-user licenses, while businesses requiring broader access may choose multi-user or enterprise licenses for cost-effective access to the report.
13. Are there any additional resources or data provided in the Label-free Detection Industry report?
While the report offers comprehensive insights, it's advisable to review the specific contents or supplementary materials provided to ascertain if additional resources or data are available.
14. How can I stay updated on further developments or reports in the Label-free Detection Industry?
To stay informed about further developments, trends, and reports in the Label-free Detection Industry, consider subscribing to industry newsletters, following relevant companies and organizations, or regularly checking reputable industry news sources and publications.
Methodology
Step 1 - Identification of Relevant Samples Size from Population Database


Step 2 - Approaches for Defining Global Market Size (Value, Volume* & Price*)

Note*: In applicable scenarios
Step 3 - Data Sources
Primary Research
- Web Analytics
- Survey Reports
- Research Institute
- Latest Research Reports
- Opinion Leaders
Secondary Research
- Annual Reports
- White Paper
- Latest Press Release
- Industry Association
- Paid Database
- Investor Presentations

Step 4 - Data Triangulation
Involves using different sources of information in order to increase the validity of a study
These sources are likely to be stakeholders in a program - participants, other researchers, program staff, other community members, and so on.
Then we put all data in single framework & apply various statistical tools to find out the dynamic on the market.
During the analysis stage, feedback from the stakeholder groups would be compared to determine areas of agreement as well as areas of divergence


