
Key Insights
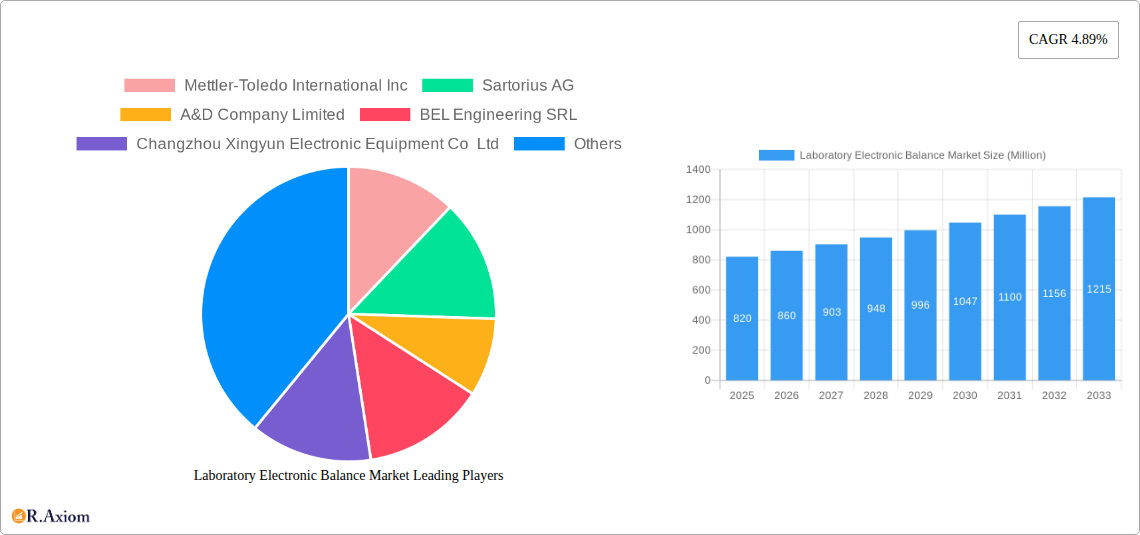
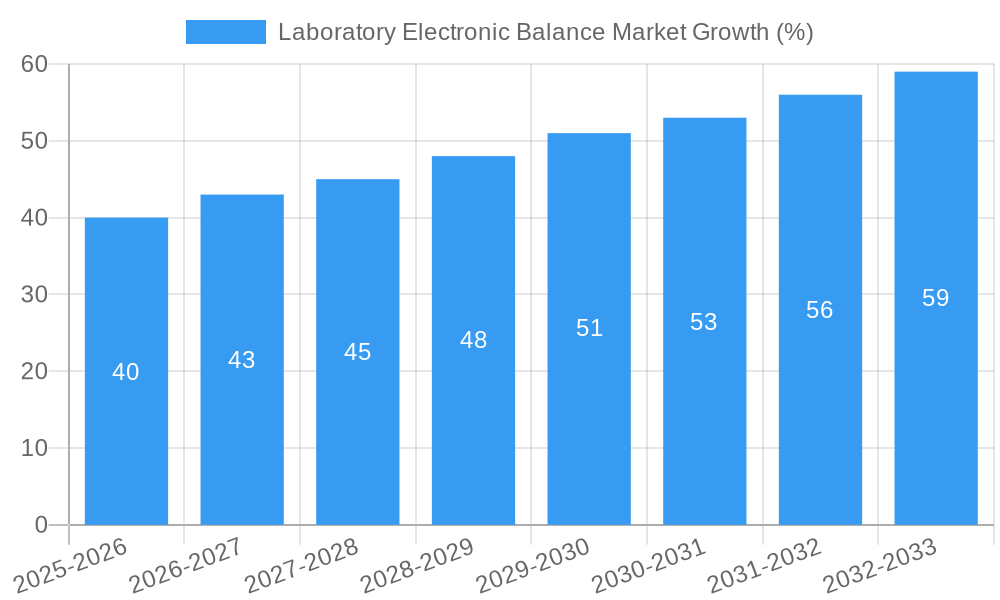
The global laboratory electronic balance market, valued at approximately $820 million in 2025, is projected to experience robust growth, driven by a compound annual growth rate (CAGR) of 4.89% from 2025 to 2033. This expansion is fueled by several key factors. The increasing adoption of advanced analytical techniques in research and development across diverse sectors like pharmaceuticals, biotechnology, and food and beverage necessitates precise and efficient weighing instruments. Furthermore, the rising demand for quality control and assurance in various industries is driving the adoption of high-precision electronic balances. Technological advancements, such as increased accuracy, improved connectivity features (e.g., data logging and integration with LIMS systems), and user-friendly interfaces are further boosting market growth. The market is witnessing a shift towards compact, portable, and versatile balances catering to the needs of various laboratory settings, from large research institutions to smaller clinical laboratories. The competitive landscape is characterized by both established players like Mettler-Toledo International Inc. and Sartorius AG, and smaller regional manufacturers, fostering innovation and price competition.
The market segmentation shows a diverse range of applications and balance types, likely including analytical balances, precision balances, and moisture balances. The geographic distribution is anticipated to be skewed towards developed regions such as North America and Europe, due to higher research spending and stricter regulatory frameworks. However, emerging economies in Asia-Pacific and Latin America are expected to witness significant growth in the coming years, driven by increasing investments in infrastructure and healthcare. Despite the positive outlook, the market may face certain challenges, such as intense competition, price sensitivity, and the need for continuous technological upgrades to stay ahead in the market. Nevertheless, the overall market trajectory indicates significant potential for growth throughout the forecast period.
Laboratory Electronic Balance Market: A Comprehensive Report (2019-2033)
This comprehensive report provides an in-depth analysis of the Laboratory Electronic Balance Market, offering valuable insights into market dynamics, growth drivers, and future trends. The study period covers 2019-2033, with 2025 as the base and estimated year. The report is essential for stakeholders including manufacturers, distributors, researchers, and investors seeking to understand this crucial sector.
Laboratory Electronic Balance Market Market Concentration & Innovation
The Laboratory Electronic Balance market exhibits a moderately concentrated landscape, with key players such as Mettler-Toledo International Inc., Sartorius AG, and OHAUS Instruments holding significant market share. Precise market share figures vary by segment and region, but estimates indicate that the top five players collectively control approximately xx% of the global market in 2025. Innovation is a crucial driver, fueled by the demand for higher accuracy, faster weighing speeds, and enhanced features such as automated calibration and data connectivity. Regulatory frameworks, particularly those pertaining to safety and measurement accuracy, influence product design and manufacturing. The market witnesses continuous innovation, with new features and functionalities being introduced regularly. Product substitutes, while limited, include traditional mechanical balances, but electronic balances are preferred due to their superior accuracy and efficiency. End-user trends show an increasing preference for integrated systems and data management capabilities, driving demand for balances with advanced connectivity options. M&A activity within the sector has been relatively low in recent years with total deal value estimated at approximately $xx Million between 2019-2024, reflecting industry consolidation and strategic partnerships.
- Key Players: Mettler-Toledo International Inc., Sartorius AG, OHAUS Instruments, and others.
- Market Concentration: Moderately concentrated, with top 5 players holding approximately xx% market share in 2025.
- Innovation Drivers: Higher accuracy, speed, automated features, data connectivity.
- M&A Activity (2019-2024): Total deal value estimated at $xx Million.
Laboratory Electronic Balance Market Industry Trends & Insights
The Laboratory Electronic Balance market is experiencing robust growth, driven by the expansion of research and development activities across various industries, including pharmaceuticals, biotechnology, food and beverage, and chemicals. The market is projected to register a Compound Annual Growth Rate (CAGR) of xx% during the forecast period (2025-2033). Technological disruptions, such as the integration of IoT capabilities and advanced analytics, are reshaping the landscape. Consumer preferences are shifting towards user-friendly interfaces, improved accuracy, and enhanced data management features. The competitive dynamics are characterized by intense rivalry among established players and emerging entrants, leading to continuous product innovation and price competition. Market penetration is highest in developed regions, but emerging economies are showing significant growth potential. The increasing adoption of advanced analytical techniques and the growing demand for precise measurements in various applications continue to drive market expansion. Furthermore, stringent quality control measures in regulated industries further contribute to the market growth.
Dominant Markets & Segments in Laboratory Electronic Balance Market
The North American region currently holds the largest market share in the global laboratory electronic balance market. Key drivers for this dominance include:
- Robust R&D Investment: High levels of investment in research and development across various sectors.
- Stringent Regulatory Standards: Strict regulatory requirements necessitate high-accuracy weighing equipment.
- Well-Established Infrastructure: A mature and well-developed laboratory infrastructure supports market growth.
- High Adoption Rates: Higher adoption rates of advanced laboratory technologies compared to other regions.
Europe and Asia-Pacific regions are also significant markets, exhibiting strong growth potential driven by increasing industrialization and rising investments in healthcare and research facilities. In terms of segments, analytical balances hold the largest market share due to their wide use across diverse research and quality control applications. Microbalances and precision balances also demonstrate significant growth, influenced by their niche applications requiring extremely high precision.
Laboratory Electronic Balance Market Product Developments
Recent product innovations focus on enhanced accuracy, speed, and connectivity. Mettler Toledo's XPR Essential Analytical Balances and Sartorius' Quintix Pro exemplify these trends. Technological advancements include improved load cell technology, advanced algorithms for data processing, and integrated software for data analysis and management. These advancements directly translate to improved efficiency, reduced errors, and enhanced data integrity for end-users, strengthening their competitive advantage within the market.
Report Scope & Segmentation Analysis
This report comprehensively segments the Laboratory Electronic Balance market based on several key parameters:
By Product Type: Analytical Balances, Precision Balances, Microbalances, Moisture Balances, and others. Each segment showcases unique growth trajectories, with analytical balances dominating the market due to widespread application.
By Application: Pharmaceutical, Biotechnology, Chemical, Food & Beverage, and others. Application-specific needs drive demand for certain balance types, leading to varied growth rates across segments.
By Region: North America, Europe, Asia-Pacific, Latin America, and Middle East & Africa. Market size and growth prospects vary considerably across regions, with North America and Europe holding significant shares currently, while Asia-Pacific exhibits robust growth potential.
By End-User: Research Institutions, Hospitals, Industries (Pharmaceuticals, Food, Chemicals etc.). Differing budgetary constraints and demands across end users lead to distinct purchase behaviors and influence market dynamics.
Key Drivers of Laboratory Electronic Balance Market Growth
Several key factors propel the growth of the Laboratory Electronic Balance market:
- Technological advancements: Improved accuracy, speed, and connectivity features.
- Rising R&D spending: Increased research and development activities globally.
- Stringent quality control regulations: The need for precise measurements in regulated industries.
- Growing demand across diverse applications: Expansion of applications across various sectors.
Challenges in the Laboratory Electronic Balance Market Sector
The Laboratory Electronic Balance market faces several challenges:
- Intense competition: High competitive intensity among established and emerging players.
- Supply chain disruptions: Global supply chain uncertainties impacting manufacturing and distribution.
- Economic fluctuations: Impact of economic downturns on R&D spending and equipment purchases.
- Regulatory complexities: Compliance with varying regulatory standards across different regions.
Emerging Opportunities in Laboratory Electronic Balance Market
Emerging opportunities exist in:
- Developing economies: Expanding laboratory infrastructure in emerging markets presents significant growth opportunities.
- Integration with laboratory information management systems (LIMS): Seamless integration with laboratory workflows offers enhanced efficiency.
- Advanced features: Demand for balances with advanced features like automated calibration and data analysis.
- Specialized applications: Growing demand for balances tailored for specific applications in niche industries.
Leading Players in the Laboratory Electronic Balance Market Market
- Mettler-Toledo International Inc
- Sartorius AG
- A&D Company Limited
- BEL Engineering SRL
- Changzhou Xingyun Electronic Equipment Co Ltd
- CAS Corporation
- Brecknell scales
- Adam Equipment
- Precisa
- OHAUS Instruments (Shanghai) Co Ltd
- RADWAG Balances and Scales
- Shimadzu Corporation
- KERN & SOHN GmbH
- BONSO Electronics International Inc
- Brecknell Scales (Avery Weigh-Tronix LLC)
- List Not Exhaustive
Key Developments in Laboratory Electronic Balance Market Industry
July 2024: Mettler Toledo launched the XPR Essential Analytical Balances and Microbalances, featuring advanced load cell technology and an innovative hanging weighing pan design. This launch significantly enhances their portfolio and strengthens their competitive position.
April 2024: Sartorius introduced the Quintix Pro laboratory balance, highlighting improved usability, flexibility, and sustainability through a 7-inch full-touch graphic display and automated motorized leveling system. This launch underscores the ongoing focus on enhancing user experience and productivity.
Strategic Outlook for Laboratory Electronic Balance Market Market
The Laboratory Electronic Balance market is poised for continued growth, driven by technological innovation, expanding research activities, and increasing demand across various sectors. Opportunities lie in developing advanced functionalities, expanding into emerging markets, and strengthening partnerships to enhance market penetration. Continuous investment in R&D and a focus on meeting evolving customer demands will be crucial for success in this dynamic market.
Laboratory Electronic Balance Market Segmentation
-
1. Type
- 1.1. Analytical Balance
- 1.2. Precision Balance
- 1.3. Compact Balances
- 1.4. Other Types
-
2. End-user Vertical
- 2.1. Pharmaceutical
- 2.2. Food and Beverage
- 2.3. Chemical
- 2.4. Biotechnology
- 2.5. Other End-user Verticals
Laboratory Electronic Balance Market Segmentation By Geography
- 1. North America
- 2. Europe
- 3. Asia
- 4. Australia and New Zealand
- 5. Latin America
- 6. Middle East and Africa

Laboratory Electronic Balance Market REPORT HIGHLIGHTS
| Aspects | Details |
|---|---|
| Study Period | 2019-2033 |
| Base Year | 2024 |
| Estimated Year | 2025 |
| Forecast Period | 2025-2033 |
| Historical Period | 2019-2024 |
| Growth Rate | CAGR of 4.89% from 2019-2033 |
| Segmentation |
|
Table of Contents
- 1. Introduction
- 1.1. Research Scope
- 1.2. Market Segmentation
- 1.3. Research Methodology
- 1.4. Definitions and Assumptions
- 2. Executive Summary
- 2.1. Introduction
- 3. Market Dynamics
- 3.1. Introduction
- 3.2. Market Drivers
- 3.2.1. Expanding Scope of Scientific Research and Industrial Applications; Rising Demand for Accurate and Reliable Measurements
- 3.3. Market Restrains
- 3.3.1. Expanding Scope of Scientific Research and Industrial Applications; Rising Demand for Accurate and Reliable Measurements
- 3.4. Market Trends
- 3.4.1. The Pharmaceutical Research Application Segment is Expected to Hold a Significant Share in the Market
- 4. Market Factor Analysis
- 4.1. Porters Five Forces
- 4.2. Supply/Value Chain
- 4.3. PESTEL analysis
- 4.4. Market Entropy
- 4.5. Patent/Trademark Analysis
- 5. Global Laboratory Electronic Balance Market Analysis, Insights and Forecast, 2019-2031
- 5.1. Market Analysis, Insights and Forecast - by Type
- 5.1.1. Analytical Balance
- 5.1.2. Precision Balance
- 5.1.3. Compact Balances
- 5.1.4. Other Types
- 5.2. Market Analysis, Insights and Forecast - by End-user Vertical
- 5.2.1. Pharmaceutical
- 5.2.2. Food and Beverage
- 5.2.3. Chemical
- 5.2.4. Biotechnology
- 5.2.5. Other End-user Verticals
- 5.3. Market Analysis, Insights and Forecast - by Region
- 5.3.1. North America
- 5.3.2. Europe
- 5.3.3. Asia
- 5.3.4. Australia and New Zealand
- 5.3.5. Latin America
- 5.3.6. Middle East and Africa
- 5.1. Market Analysis, Insights and Forecast - by Type
- 6. North America Laboratory Electronic Balance Market Analysis, Insights and Forecast, 2019-2031
- 6.1. Market Analysis, Insights and Forecast - by Type
- 6.1.1. Analytical Balance
- 6.1.2. Precision Balance
- 6.1.3. Compact Balances
- 6.1.4. Other Types
- 6.2. Market Analysis, Insights and Forecast - by End-user Vertical
- 6.2.1. Pharmaceutical
- 6.2.2. Food and Beverage
- 6.2.3. Chemical
- 6.2.4. Biotechnology
- 6.2.5. Other End-user Verticals
- 6.1. Market Analysis, Insights and Forecast - by Type
- 7. Europe Laboratory Electronic Balance Market Analysis, Insights and Forecast, 2019-2031
- 7.1. Market Analysis, Insights and Forecast - by Type
- 7.1.1. Analytical Balance
- 7.1.2. Precision Balance
- 7.1.3. Compact Balances
- 7.1.4. Other Types
- 7.2. Market Analysis, Insights and Forecast - by End-user Vertical
- 7.2.1. Pharmaceutical
- 7.2.2. Food and Beverage
- 7.2.3. Chemical
- 7.2.4. Biotechnology
- 7.2.5. Other End-user Verticals
- 7.1. Market Analysis, Insights and Forecast - by Type
- 8. Asia Laboratory Electronic Balance Market Analysis, Insights and Forecast, 2019-2031
- 8.1. Market Analysis, Insights and Forecast - by Type
- 8.1.1. Analytical Balance
- 8.1.2. Precision Balance
- 8.1.3. Compact Balances
- 8.1.4. Other Types
- 8.2. Market Analysis, Insights and Forecast - by End-user Vertical
- 8.2.1. Pharmaceutical
- 8.2.2. Food and Beverage
- 8.2.3. Chemical
- 8.2.4. Biotechnology
- 8.2.5. Other End-user Verticals
- 8.1. Market Analysis, Insights and Forecast - by Type
- 9. Australia and New Zealand Laboratory Electronic Balance Market Analysis, Insights and Forecast, 2019-2031
- 9.1. Market Analysis, Insights and Forecast - by Type
- 9.1.1. Analytical Balance
- 9.1.2. Precision Balance
- 9.1.3. Compact Balances
- 9.1.4. Other Types
- 9.2. Market Analysis, Insights and Forecast - by End-user Vertical
- 9.2.1. Pharmaceutical
- 9.2.2. Food and Beverage
- 9.2.3. Chemical
- 9.2.4. Biotechnology
- 9.2.5. Other End-user Verticals
- 9.1. Market Analysis, Insights and Forecast - by Type
- 10. Latin America Laboratory Electronic Balance Market Analysis, Insights and Forecast, 2019-2031
- 10.1. Market Analysis, Insights and Forecast - by Type
- 10.1.1. Analytical Balance
- 10.1.2. Precision Balance
- 10.1.3. Compact Balances
- 10.1.4. Other Types
- 10.2. Market Analysis, Insights and Forecast - by End-user Vertical
- 10.2.1. Pharmaceutical
- 10.2.2. Food and Beverage
- 10.2.3. Chemical
- 10.2.4. Biotechnology
- 10.2.5. Other End-user Verticals
- 10.1. Market Analysis, Insights and Forecast - by Type
- 11. Middle East and Africa Laboratory Electronic Balance Market Analysis, Insights and Forecast, 2019-2031
- 11.1. Market Analysis, Insights and Forecast - by Type
- 11.1.1. Analytical Balance
- 11.1.2. Precision Balance
- 11.1.3. Compact Balances
- 11.1.4. Other Types
- 11.2. Market Analysis, Insights and Forecast - by End-user Vertical
- 11.2.1. Pharmaceutical
- 11.2.2. Food and Beverage
- 11.2.3. Chemical
- 11.2.4. Biotechnology
- 11.2.5. Other End-user Verticals
- 11.1. Market Analysis, Insights and Forecast - by Type
- 12. Competitive Analysis
- 12.1. Global Market Share Analysis 2024
- 12.2. Company Profiles
- 12.2.1 Mettler-Toledo International Inc
- 12.2.1.1. Overview
- 12.2.1.2. Products
- 12.2.1.3. SWOT Analysis
- 12.2.1.4. Recent Developments
- 12.2.1.5. Financials (Based on Availability)
- 12.2.2 Sartorius AG
- 12.2.2.1. Overview
- 12.2.2.2. Products
- 12.2.2.3. SWOT Analysis
- 12.2.2.4. Recent Developments
- 12.2.2.5. Financials (Based on Availability)
- 12.2.3 A&D Company Limited
- 12.2.3.1. Overview
- 12.2.3.2. Products
- 12.2.3.3. SWOT Analysis
- 12.2.3.4. Recent Developments
- 12.2.3.5. Financials (Based on Availability)
- 12.2.4 BEL Engineering SRL
- 12.2.4.1. Overview
- 12.2.4.2. Products
- 12.2.4.3. SWOT Analysis
- 12.2.4.4. Recent Developments
- 12.2.4.5. Financials (Based on Availability)
- 12.2.5 Changzhou Xingyun Electronic Equipment Co Ltd
- 12.2.5.1. Overview
- 12.2.5.2. Products
- 12.2.5.3. SWOT Analysis
- 12.2.5.4. Recent Developments
- 12.2.5.5. Financials (Based on Availability)
- 12.2.6 CAS Corporation
- 12.2.6.1. Overview
- 12.2.6.2. Products
- 12.2.6.3. SWOT Analysis
- 12.2.6.4. Recent Developments
- 12.2.6.5. Financials (Based on Availability)
- 12.2.7 Brecknell scales
- 12.2.7.1. Overview
- 12.2.7.2. Products
- 12.2.7.3. SWOT Analysis
- 12.2.7.4. Recent Developments
- 12.2.7.5. Financials (Based on Availability)
- 12.2.8 Adam Equipment
- 12.2.8.1. Overview
- 12.2.8.2. Products
- 12.2.8.3. SWOT Analysis
- 12.2.8.4. Recent Developments
- 12.2.8.5. Financials (Based on Availability)
- 12.2.9 Precisa
- 12.2.9.1. Overview
- 12.2.9.2. Products
- 12.2.9.3. SWOT Analysis
- 12.2.9.4. Recent Developments
- 12.2.9.5. Financials (Based on Availability)
- 12.2.10 OHAUS Instruments (Shanghai) Co Ltd
- 12.2.10.1. Overview
- 12.2.10.2. Products
- 12.2.10.3. SWOT Analysis
- 12.2.10.4. Recent Developments
- 12.2.10.5. Financials (Based on Availability)
- 12.2.11 RADWAG Balances and Scales
- 12.2.11.1. Overview
- 12.2.11.2. Products
- 12.2.11.3. SWOT Analysis
- 12.2.11.4. Recent Developments
- 12.2.11.5. Financials (Based on Availability)
- 12.2.12 Shimadzu Corporation
- 12.2.12.1. Overview
- 12.2.12.2. Products
- 12.2.12.3. SWOT Analysis
- 12.2.12.4. Recent Developments
- 12.2.12.5. Financials (Based on Availability)
- 12.2.13 KERN & SOHN GmbH
- 12.2.13.1. Overview
- 12.2.13.2. Products
- 12.2.13.3. SWOT Analysis
- 12.2.13.4. Recent Developments
- 12.2.13.5. Financials (Based on Availability)
- 12.2.14 BONSO Electronics International Inc
- 12.2.14.1. Overview
- 12.2.14.2. Products
- 12.2.14.3. SWOT Analysis
- 12.2.14.4. Recent Developments
- 12.2.14.5. Financials (Based on Availability)
- 12.2.15 Brecknell Scales (Avery Weigh-Tronix LLC)*List Not Exhaustive
- 12.2.15.1. Overview
- 12.2.15.2. Products
- 12.2.15.3. SWOT Analysis
- 12.2.15.4. Recent Developments
- 12.2.15.5. Financials (Based on Availability)
- 12.2.1 Mettler-Toledo International Inc
List of Figures
- Figure 1: Global Laboratory Electronic Balance Market Revenue Breakdown (Million, %) by Region 2024 & 2032
- Figure 2: Global Laboratory Electronic Balance Market Volume Breakdown (Billion, %) by Region 2024 & 2032
- Figure 3: North America Laboratory Electronic Balance Market Revenue (Million), by Type 2024 & 2032
- Figure 4: North America Laboratory Electronic Balance Market Volume (Billion), by Type 2024 & 2032
- Figure 5: North America Laboratory Electronic Balance Market Revenue Share (%), by Type 2024 & 2032
- Figure 6: North America Laboratory Electronic Balance Market Volume Share (%), by Type 2024 & 2032
- Figure 7: North America Laboratory Electronic Balance Market Revenue (Million), by End-user Vertical 2024 & 2032
- Figure 8: North America Laboratory Electronic Balance Market Volume (Billion), by End-user Vertical 2024 & 2032
- Figure 9: North America Laboratory Electronic Balance Market Revenue Share (%), by End-user Vertical 2024 & 2032
- Figure 10: North America Laboratory Electronic Balance Market Volume Share (%), by End-user Vertical 2024 & 2032
- Figure 11: North America Laboratory Electronic Balance Market Revenue (Million), by Country 2024 & 2032
- Figure 12: North America Laboratory Electronic Balance Market Volume (Billion), by Country 2024 & 2032
- Figure 13: North America Laboratory Electronic Balance Market Revenue Share (%), by Country 2024 & 2032
- Figure 14: North America Laboratory Electronic Balance Market Volume Share (%), by Country 2024 & 2032
- Figure 15: Europe Laboratory Electronic Balance Market Revenue (Million), by Type 2024 & 2032
- Figure 16: Europe Laboratory Electronic Balance Market Volume (Billion), by Type 2024 & 2032
- Figure 17: Europe Laboratory Electronic Balance Market Revenue Share (%), by Type 2024 & 2032
- Figure 18: Europe Laboratory Electronic Balance Market Volume Share (%), by Type 2024 & 2032
- Figure 19: Europe Laboratory Electronic Balance Market Revenue (Million), by End-user Vertical 2024 & 2032
- Figure 20: Europe Laboratory Electronic Balance Market Volume (Billion), by End-user Vertical 2024 & 2032
- Figure 21: Europe Laboratory Electronic Balance Market Revenue Share (%), by End-user Vertical 2024 & 2032
- Figure 22: Europe Laboratory Electronic Balance Market Volume Share (%), by End-user Vertical 2024 & 2032
- Figure 23: Europe Laboratory Electronic Balance Market Revenue (Million), by Country 2024 & 2032
- Figure 24: Europe Laboratory Electronic Balance Market Volume (Billion), by Country 2024 & 2032
- Figure 25: Europe Laboratory Electronic Balance Market Revenue Share (%), by Country 2024 & 2032
- Figure 26: Europe Laboratory Electronic Balance Market Volume Share (%), by Country 2024 & 2032
- Figure 27: Asia Laboratory Electronic Balance Market Revenue (Million), by Type 2024 & 2032
- Figure 28: Asia Laboratory Electronic Balance Market Volume (Billion), by Type 2024 & 2032
- Figure 29: Asia Laboratory Electronic Balance Market Revenue Share (%), by Type 2024 & 2032
- Figure 30: Asia Laboratory Electronic Balance Market Volume Share (%), by Type 2024 & 2032
- Figure 31: Asia Laboratory Electronic Balance Market Revenue (Million), by End-user Vertical 2024 & 2032
- Figure 32: Asia Laboratory Electronic Balance Market Volume (Billion), by End-user Vertical 2024 & 2032
- Figure 33: Asia Laboratory Electronic Balance Market Revenue Share (%), by End-user Vertical 2024 & 2032
- Figure 34: Asia Laboratory Electronic Balance Market Volume Share (%), by End-user Vertical 2024 & 2032
- Figure 35: Asia Laboratory Electronic Balance Market Revenue (Million), by Country 2024 & 2032
- Figure 36: Asia Laboratory Electronic Balance Market Volume (Billion), by Country 2024 & 2032
- Figure 37: Asia Laboratory Electronic Balance Market Revenue Share (%), by Country 2024 & 2032
- Figure 38: Asia Laboratory Electronic Balance Market Volume Share (%), by Country 2024 & 2032
- Figure 39: Australia and New Zealand Laboratory Electronic Balance Market Revenue (Million), by Type 2024 & 2032
- Figure 40: Australia and New Zealand Laboratory Electronic Balance Market Volume (Billion), by Type 2024 & 2032
- Figure 41: Australia and New Zealand Laboratory Electronic Balance Market Revenue Share (%), by Type 2024 & 2032
- Figure 42: Australia and New Zealand Laboratory Electronic Balance Market Volume Share (%), by Type 2024 & 2032
- Figure 43: Australia and New Zealand Laboratory Electronic Balance Market Revenue (Million), by End-user Vertical 2024 & 2032
- Figure 44: Australia and New Zealand Laboratory Electronic Balance Market Volume (Billion), by End-user Vertical 2024 & 2032
- Figure 45: Australia and New Zealand Laboratory Electronic Balance Market Revenue Share (%), by End-user Vertical 2024 & 2032
- Figure 46: Australia and New Zealand Laboratory Electronic Balance Market Volume Share (%), by End-user Vertical 2024 & 2032
- Figure 47: Australia and New Zealand Laboratory Electronic Balance Market Revenue (Million), by Country 2024 & 2032
- Figure 48: Australia and New Zealand Laboratory Electronic Balance Market Volume (Billion), by Country 2024 & 2032
- Figure 49: Australia and New Zealand Laboratory Electronic Balance Market Revenue Share (%), by Country 2024 & 2032
- Figure 50: Australia and New Zealand Laboratory Electronic Balance Market Volume Share (%), by Country 2024 & 2032
- Figure 51: Latin America Laboratory Electronic Balance Market Revenue (Million), by Type 2024 & 2032
- Figure 52: Latin America Laboratory Electronic Balance Market Volume (Billion), by Type 2024 & 2032
- Figure 53: Latin America Laboratory Electronic Balance Market Revenue Share (%), by Type 2024 & 2032
- Figure 54: Latin America Laboratory Electronic Balance Market Volume Share (%), by Type 2024 & 2032
- Figure 55: Latin America Laboratory Electronic Balance Market Revenue (Million), by End-user Vertical 2024 & 2032
- Figure 56: Latin America Laboratory Electronic Balance Market Volume (Billion), by End-user Vertical 2024 & 2032
- Figure 57: Latin America Laboratory Electronic Balance Market Revenue Share (%), by End-user Vertical 2024 & 2032
- Figure 58: Latin America Laboratory Electronic Balance Market Volume Share (%), by End-user Vertical 2024 & 2032
- Figure 59: Latin America Laboratory Electronic Balance Market Revenue (Million), by Country 2024 & 2032
- Figure 60: Latin America Laboratory Electronic Balance Market Volume (Billion), by Country 2024 & 2032
- Figure 61: Latin America Laboratory Electronic Balance Market Revenue Share (%), by Country 2024 & 2032
- Figure 62: Latin America Laboratory Electronic Balance Market Volume Share (%), by Country 2024 & 2032
- Figure 63: Middle East and Africa Laboratory Electronic Balance Market Revenue (Million), by Type 2024 & 2032
- Figure 64: Middle East and Africa Laboratory Electronic Balance Market Volume (Billion), by Type 2024 & 2032
- Figure 65: Middle East and Africa Laboratory Electronic Balance Market Revenue Share (%), by Type 2024 & 2032
- Figure 66: Middle East and Africa Laboratory Electronic Balance Market Volume Share (%), by Type 2024 & 2032
- Figure 67: Middle East and Africa Laboratory Electronic Balance Market Revenue (Million), by End-user Vertical 2024 & 2032
- Figure 68: Middle East and Africa Laboratory Electronic Balance Market Volume (Billion), by End-user Vertical 2024 & 2032
- Figure 69: Middle East and Africa Laboratory Electronic Balance Market Revenue Share (%), by End-user Vertical 2024 & 2032
- Figure 70: Middle East and Africa Laboratory Electronic Balance Market Volume Share (%), by End-user Vertical 2024 & 2032
- Figure 71: Middle East and Africa Laboratory Electronic Balance Market Revenue (Million), by Country 2024 & 2032
- Figure 72: Middle East and Africa Laboratory Electronic Balance Market Volume (Billion), by Country 2024 & 2032
- Figure 73: Middle East and Africa Laboratory Electronic Balance Market Revenue Share (%), by Country 2024 & 2032
- Figure 74: Middle East and Africa Laboratory Electronic Balance Market Volume Share (%), by Country 2024 & 2032
List of Tables
- Table 1: Global Laboratory Electronic Balance Market Revenue Million Forecast, by Region 2019 & 2032
- Table 2: Global Laboratory Electronic Balance Market Volume Billion Forecast, by Region 2019 & 2032
- Table 3: Global Laboratory Electronic Balance Market Revenue Million Forecast, by Type 2019 & 2032
- Table 4: Global Laboratory Electronic Balance Market Volume Billion Forecast, by Type 2019 & 2032
- Table 5: Global Laboratory Electronic Balance Market Revenue Million Forecast, by End-user Vertical 2019 & 2032
- Table 6: Global Laboratory Electronic Balance Market Volume Billion Forecast, by End-user Vertical 2019 & 2032
- Table 7: Global Laboratory Electronic Balance Market Revenue Million Forecast, by Region 2019 & 2032
- Table 8: Global Laboratory Electronic Balance Market Volume Billion Forecast, by Region 2019 & 2032
- Table 9: Global Laboratory Electronic Balance Market Revenue Million Forecast, by Type 2019 & 2032
- Table 10: Global Laboratory Electronic Balance Market Volume Billion Forecast, by Type 2019 & 2032
- Table 11: Global Laboratory Electronic Balance Market Revenue Million Forecast, by End-user Vertical 2019 & 2032
- Table 12: Global Laboratory Electronic Balance Market Volume Billion Forecast, by End-user Vertical 2019 & 2032
- Table 13: Global Laboratory Electronic Balance Market Revenue Million Forecast, by Country 2019 & 2032
- Table 14: Global Laboratory Electronic Balance Market Volume Billion Forecast, by Country 2019 & 2032
- Table 15: Global Laboratory Electronic Balance Market Revenue Million Forecast, by Type 2019 & 2032
- Table 16: Global Laboratory Electronic Balance Market Volume Billion Forecast, by Type 2019 & 2032
- Table 17: Global Laboratory Electronic Balance Market Revenue Million Forecast, by End-user Vertical 2019 & 2032
- Table 18: Global Laboratory Electronic Balance Market Volume Billion Forecast, by End-user Vertical 2019 & 2032
- Table 19: Global Laboratory Electronic Balance Market Revenue Million Forecast, by Country 2019 & 2032
- Table 20: Global Laboratory Electronic Balance Market Volume Billion Forecast, by Country 2019 & 2032
- Table 21: Global Laboratory Electronic Balance Market Revenue Million Forecast, by Type 2019 & 2032
- Table 22: Global Laboratory Electronic Balance Market Volume Billion Forecast, by Type 2019 & 2032
- Table 23: Global Laboratory Electronic Balance Market Revenue Million Forecast, by End-user Vertical 2019 & 2032
- Table 24: Global Laboratory Electronic Balance Market Volume Billion Forecast, by End-user Vertical 2019 & 2032
- Table 25: Global Laboratory Electronic Balance Market Revenue Million Forecast, by Country 2019 & 2032
- Table 26: Global Laboratory Electronic Balance Market Volume Billion Forecast, by Country 2019 & 2032
- Table 27: Global Laboratory Electronic Balance Market Revenue Million Forecast, by Type 2019 & 2032
- Table 28: Global Laboratory Electronic Balance Market Volume Billion Forecast, by Type 2019 & 2032
- Table 29: Global Laboratory Electronic Balance Market Revenue Million Forecast, by End-user Vertical 2019 & 2032
- Table 30: Global Laboratory Electronic Balance Market Volume Billion Forecast, by End-user Vertical 2019 & 2032
- Table 31: Global Laboratory Electronic Balance Market Revenue Million Forecast, by Country 2019 & 2032
- Table 32: Global Laboratory Electronic Balance Market Volume Billion Forecast, by Country 2019 & 2032
- Table 33: Global Laboratory Electronic Balance Market Revenue Million Forecast, by Type 2019 & 2032
- Table 34: Global Laboratory Electronic Balance Market Volume Billion Forecast, by Type 2019 & 2032
- Table 35: Global Laboratory Electronic Balance Market Revenue Million Forecast, by End-user Vertical 2019 & 2032
- Table 36: Global Laboratory Electronic Balance Market Volume Billion Forecast, by End-user Vertical 2019 & 2032
- Table 37: Global Laboratory Electronic Balance Market Revenue Million Forecast, by Country 2019 & 2032
- Table 38: Global Laboratory Electronic Balance Market Volume Billion Forecast, by Country 2019 & 2032
- Table 39: Global Laboratory Electronic Balance Market Revenue Million Forecast, by Type 2019 & 2032
- Table 40: Global Laboratory Electronic Balance Market Volume Billion Forecast, by Type 2019 & 2032
- Table 41: Global Laboratory Electronic Balance Market Revenue Million Forecast, by End-user Vertical 2019 & 2032
- Table 42: Global Laboratory Electronic Balance Market Volume Billion Forecast, by End-user Vertical 2019 & 2032
- Table 43: Global Laboratory Electronic Balance Market Revenue Million Forecast, by Country 2019 & 2032
- Table 44: Global Laboratory Electronic Balance Market Volume Billion Forecast, by Country 2019 & 2032
Frequently Asked Questions
1. What is the projected Compound Annual Growth Rate (CAGR) of the Laboratory Electronic Balance Market?
The projected CAGR is approximately 4.89%.
2. Which companies are prominent players in the Laboratory Electronic Balance Market?
Key companies in the market include Mettler-Toledo International Inc, Sartorius AG, A&D Company Limited, BEL Engineering SRL, Changzhou Xingyun Electronic Equipment Co Ltd, CAS Corporation, Brecknell scales, Adam Equipment, Precisa, OHAUS Instruments (Shanghai) Co Ltd, RADWAG Balances and Scales, Shimadzu Corporation, KERN & SOHN GmbH, BONSO Electronics International Inc, Brecknell Scales (Avery Weigh-Tronix LLC)*List Not Exhaustive.
3. What are the main segments of the Laboratory Electronic Balance Market?
The market segments include Type, End-user Vertical.
4. Can you provide details about the market size?
The market size is estimated to be USD 0.82 Million as of 2022.
5. What are some drivers contributing to market growth?
Expanding Scope of Scientific Research and Industrial Applications; Rising Demand for Accurate and Reliable Measurements.
6. What are the notable trends driving market growth?
The Pharmaceutical Research Application Segment is Expected to Hold a Significant Share in the Market.
7. Are there any restraints impacting market growth?
Expanding Scope of Scientific Research and Industrial Applications; Rising Demand for Accurate and Reliable Measurements.
8. Can you provide examples of recent developments in the market?
July 2024: Mettler Toledo introduced its latest offerings: the XPR Essential Analytical Balances and Microbalances. The XPR Essential Analytical Balances are engineered to provide swift and precise results. Their advanced load cell technology and innovative hanging weighing pan design ensure accurate measurements of small samples, effectively minimizing waste and optimizing costs. In tandem with these launches, Mettler Toledo is enhancing its XPR Analytical and Automatic Balance portfolio with notable upgrades.April 2024: Sartorius introduced its latest innovation: the Quintix Pro laboratory balance. This cutting-edge device redefines standard laboratory weighing. Tailored for the dynamic needs of contemporary labs, the Quintix Pro stands out in usability, flexibility, and sustainability. Leveraging advanced engineering and top-tier features, it promises an unparalleled user experience. Its 7-inch, high-resolution, full-touch graphic display simplifies menu navigation and boosts productivity. Additionally, the series boasts an automated motorized leveling system, streamlining daily tasks and ensuring precise results every time.
9. What pricing options are available for accessing the report?
Pricing options include single-user, multi-user, and enterprise licenses priced at USD 4750, USD 5250, and USD 8750 respectively.
10. Is the market size provided in terms of value or volume?
The market size is provided in terms of value, measured in Million and volume, measured in Billion.
11. Are there any specific market keywords associated with the report?
Yes, the market keyword associated with the report is "Laboratory Electronic Balance Market," which aids in identifying and referencing the specific market segment covered.
12. How do I determine which pricing option suits my needs best?
The pricing options vary based on user requirements and access needs. Individual users may opt for single-user licenses, while businesses requiring broader access may choose multi-user or enterprise licenses for cost-effective access to the report.
13. Are there any additional resources or data provided in the Laboratory Electronic Balance Market report?
While the report offers comprehensive insights, it's advisable to review the specific contents or supplementary materials provided to ascertain if additional resources or data are available.
14. How can I stay updated on further developments or reports in the Laboratory Electronic Balance Market?
To stay informed about further developments, trends, and reports in the Laboratory Electronic Balance Market, consider subscribing to industry newsletters, following relevant companies and organizations, or regularly checking reputable industry news sources and publications.
Methodology
Step 1 - Identification of Relevant Samples Size from Population Database


Step 2 - Approaches for Defining Global Market Size (Value, Volume* & Price*)

Note*: In applicable scenarios
Step 3 - Data Sources
Primary Research
- Web Analytics
- Survey Reports
- Research Institute
- Latest Research Reports
- Opinion Leaders
Secondary Research
- Annual Reports
- White Paper
- Latest Press Release
- Industry Association
- Paid Database
- Investor Presentations

Step 4 - Data Triangulation
Involves using different sources of information in order to increase the validity of a study
These sources are likely to be stakeholders in a program - participants, other researchers, program staff, other community members, and so on.
Then we put all data in single framework & apply various statistical tools to find out the dynamic on the market.
During the analysis stage, feedback from the stakeholder groups would be compared to determine areas of agreement as well as areas of divergence


