

Key Insights
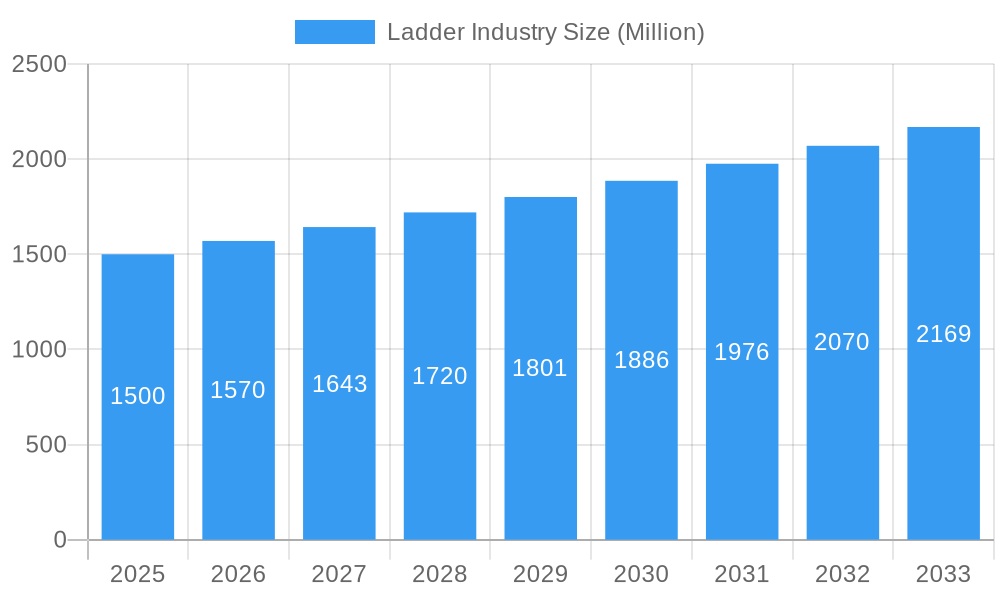
The global ladder industry, valued at approximately $XX million in 2025, is experiencing robust growth, projected to expand at a Compound Annual Growth Rate (CAGR) exceeding 4.50% from 2025 to 2033. This growth is fueled by several key drivers. Increasing construction activity globally, particularly in developing economies, necessitates a high demand for ladders across residential, commercial, and industrial sectors. Furthermore, rising disposable incomes in emerging markets are boosting consumer spending on home improvement projects, thereby increasing ladder sales. The industry is witnessing a trend towards lightweight yet durable materials, such as aluminum and fiberglass, replacing traditional heavier materials like wood and steel. This shift reflects a focus on improved ergonomics and safety, key concerns for both professionals and DIY enthusiasts. However, fluctuating raw material prices and stringent safety regulations pose challenges to sustained growth. The market is segmented by material type (aluminum, steel, wood, fiberglass, others) and application (household, commercial, industrial, others). Aluminum ladders dominate due to their lightweight nature and cost-effectiveness, while fiberglass ladders are gaining traction due to their superior electrical insulation properties. The North American and European markets currently hold significant shares, but the Asia-Pacific region is emerging as a key growth driver, spurred by rapid urbanization and infrastructure development. Leading players such as Werner Co, Louisville Ladder, and Little Giant Ladder are focusing on innovation, product diversification, and strategic acquisitions to maintain their competitive edge.
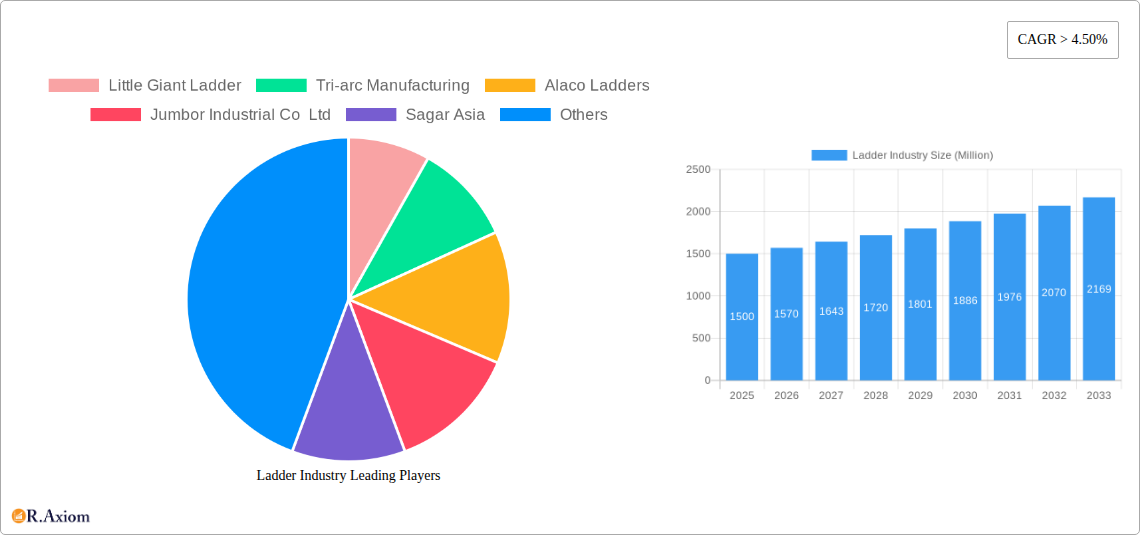
Ladder Industry Market Size (In Billion)
The forecast period (2025-2033) suggests continued expansion, driven by sustained growth in construction and infrastructure projects, alongside ongoing product innovation and expansion into new markets. While challenges like raw material volatility and economic downturns remain, the long-term outlook for the ladder industry remains positive. The industry's growth trajectory will likely be influenced by factors such as government policies related to construction and infrastructure, technological advancements in ladder design and manufacturing, and evolving safety standards. Companies are likely to focus on sustainable manufacturing practices and environmentally friendly materials to cater to growing environmental concerns. Regional variations in market growth will depend on factors like economic conditions, construction activity, and government regulations.
Ladder Industry Company Market Share
Ladder Industry Market Report: 2019-2033 - A Comprehensive Analysis
This comprehensive report provides an in-depth analysis of the global ladder industry, offering valuable insights for stakeholders, investors, and industry professionals. The report covers the period from 2019 to 2033, with a focus on the estimated year 2025 and a forecast period from 2025 to 2033. The analysis encompasses market size, segmentation, competitive landscape, growth drivers, challenges, and emerging opportunities within the ladder industry. The total market value in 2025 is estimated at $XX Million.
Ladder Industry Market Concentration & Innovation
The ladder industry is characterized by a moderately concentrated market, where a few prominent manufacturers hold a substantial share of the global market. Key players such as Werner Co (Werner ladder), Louisville Ladder, and Little Giant Ladder collectively commanded a significant market share, exceeding xx% in 2025. Despite this concentration, a vibrant competitive landscape persists, thanks to the presence of numerous regional and specialized companies. Innovation within the sector is predominantly focused on advancing safety features, optimizing ergonomic design, and pioneering the use of lightweight yet highly durable materials. The escalating demand for user-friendly, lightweight ladders, particularly within the residential sector, has been a major catalyst for innovation in materials science and product development. Furthermore, regulatory frameworks, especially those pertaining to safety standards like ANSI and OSHA regulations, exert a considerable influence on industry practices and product design. While the market has witnessed some merger and acquisition (M&A) activities, deals exceeding $XX Million remain relatively infrequent. Notable M&A transactions include [mention specific M&A activities, including details if available such as acquisition year and value, otherwise mention xx].
- Market Share (2025 Estimates): Werner Co: xx%, Louisville Ladder: xx%, Little Giant Ladder: xx%
- M&A Activity: Limited large-scale transactions; estimated total M&A deal value over the past 5 years: $XX Million.
- Key Innovation Drivers: Development of advanced lightweight materials, enhancement of safety mechanisms, and improvement of ergonomic features.
- Regulatory Landscape: Strict adherence to safety standards, including ANSI and OSHA regulations, is a critical factor.
- Potential Product Substitutes: Scaffolding systems and elevated work platforms are considered alternative solutions.
Ladder Industry Industry Trends & Insights
The global ladder industry is projected to witness a Compound Annual Growth Rate (CAGR) of xx% during the forecast period (2025-2033), driven by robust growth in construction and renovation activities across various regions. Rising disposable incomes in developing economies are fueling demand for ladders in residential applications. Technological disruptions, such as the adoption of advanced materials (e.g., carbon fiber) and smart features (e.g., integrated sensors), are transforming the product landscape. Consumer preference is shifting toward lightweight, easy-to-handle, and multi-functional ladders. Competitive dynamics are characterized by intense rivalry amongst established players and the emergence of new entrants offering innovative products. The market penetration of aluminum ladders remains high, but fiberglass and other composite materials are gaining traction due to their enhanced safety and durability features. The market penetration of Aluminum ladders is currently at xx%
Dominant Markets & Segments in Ladder Industry
The North American and European regions currently lead the global ladder market, primarily driven by strong construction sectors and robust consumer spending power. Within the material segment, aluminum ladders continue to dominate due to their exceptional balance of being lightweight, durable, and cost-effective. In terms of application, the commercial and industrial sectors represent significant contributors to market demand, largely due to ongoing infrastructural development projects and industrial maintenance requirements.
- Primary Growth Drivers (North America & Europe):
- Sustained construction and renovation booms.
- High levels of disposable income.
- The imperative of adopting safer ladder solutions driven by stringent safety regulations.
- Aluminum Ladders: Maintain a leading market share owing to their cost-effectiveness and lightweight properties.
- Commercial & Industrial Applications: Experience high demand fueled by extensive infrastructural projects and ongoing industrial maintenance needs.
Ladder Industry Product Developments
Recent product innovations focus on enhancing safety and ergonomics, incorporating features like wider steps, improved gripping surfaces, and lightweight yet durable materials such as carbon fiber composites. These innovations address safety concerns and enhance user experience, leading to increased market penetration and improved competitive advantages for manufacturers. The integration of smart technology, such as integrated sensors for fall detection, is an emerging trend that could potentially revolutionize the industry in the near future. The market is witnessing a gradual shift towards specialized ladders catering to specific applications (e.g., attic ladders, painter's ladders).
Report Scope & Segmentation Analysis
This report provides a comprehensive analysis of the ladder market, segmented by material type (including Aluminum, Steel, Wood, Fiberglass, and Other Material Types) and by application (covering Household, Commercial, Industrial, and Other Applications). Each segment is meticulously analyzed for its market size, projected growth, and competitive dynamics. The aluminum segment is forecasted to retain its leading position, while fiberglass and other advanced materials are anticipated to experience substantial growth. The commercial and industrial application segments are projected to be major drivers of market demand throughout the forecast period.
- Market Segmentation by Material (2025 Estimates): Aluminum (xx Million), Steel (xx Million), Wood (xx Million), Fiberglass (xx Million), Other (xx Million).
- Market Segmentation by Application (2025 Estimates): Household (xx Million), Commercial (xx Million), Industrial (xx Million), Other (xx Million).
Key Drivers of Ladder Industry Growth
The ladder industry is experiencing robust growth propelled by several key factors. The global increase in construction activity, coupled with rising disposable incomes in emerging economies, is spurring greater investment in home improvement. Furthermore, the stringent enforcement of safety regulations is driving the adoption of more secure and advanced ladder designs. Technological advancements in materials science and manufacturing processes are also contributing significantly to the industry's expansion. The growing demand for specialized ladders designed for niche applications, such as tree care and window cleaning, further bolsters market growth.
Challenges in the Ladder Industry Sector
The ladder industry faces several challenges including fluctuating raw material prices, particularly for aluminum and steel, impacting production costs. Supply chain disruptions caused by global events can also hamper production and distribution. Intense competition, particularly amongst established players, puts pressure on profit margins. Stringent safety regulations increase the cost of manufacturing and compliance, requiring investments in advanced testing and certification procedures.
Emerging Opportunities in Ladder Industry
Emerging opportunities include the growth of specialized ladders for niche applications and the adoption of advanced materials like carbon fiber and lightweight alloys to improve product performance. The potential for incorporating smart technologies, such as fall detection systems and integrated lighting, presents a significant opportunity for innovation and market differentiation. Expansion into emerging markets with growing construction activity and rising disposable incomes offers significant growth potential.
Leading Players in the Ladder Industry Market
- Little Giant Ladder
- Tri-arc Manufacturing
- Alaco Ladders
- Jumbor Industrial Co Ltd
- Sagar Asia
- TB Davies (Cardiff)
- Bauer Ladder Inc
- Louisville Ladder
- Tubesca-comabi
- Werner Co (Werner ladder)
- Gorilla Ladder
Key Developments in Ladder Industry Industry
- 2022-Q4: Werner Co launched a new line of lightweight aluminum ladders.
- 2023-Q1: Louisville Ladder acquired a smaller regional competitor.
- 2024-Q2: New ANSI safety standards for ladders were implemented.
- [Add more developments with year/month and impact on market dynamics. If data is unavailable, use "xx"]
Strategic Outlook for Ladder Industry Market
The ladder industry is poised for continued growth, driven by strong fundamentals in the construction and home improvement sectors. Technological innovations and the emergence of new applications will fuel market expansion. Companies that successfully adapt to evolving safety regulations and consumer preferences, while embracing technological advancements, are well-positioned to capture significant market share in the coming years. The industry's future is bright, with continued opportunities for growth and innovation.
Ladder Industry Segmentation
- 1. Production Analysis
- 2. Consumption Analysis
- 3. Import Market Analysis (Value & Volume)
- 4. Export Market Analysis (Value & Volume)
- 5. Price Trend Analysis
Ladder Industry Segmentation By Geography
-
1. North America
- 1.1. United States
- 1.2. Canada
- 1.3. Mexico
-
2. South America
- 2.1. Brazil
- 2.2. Argentina
- 2.3. Rest of South America
-
3. Europe
- 3.1. United Kingdom
- 3.2. Germany
- 3.3. France
- 3.4. Italy
- 3.5. Spain
- 3.6. Russia
- 3.7. Benelux
- 3.8. Nordics
- 3.9. Rest of Europe
-
4. Middle East & Africa
- 4.1. Turkey
- 4.2. Israel
- 4.3. GCC
- 4.4. North Africa
- 4.5. South Africa
- 4.6. Rest of Middle East & Africa
-
5. Asia Pacific
- 5.1. China
- 5.2. India
- 5.3. Japan
- 5.4. South Korea
- 5.5. ASEAN
- 5.6. Oceania
- 5.7. Rest of Asia Pacific
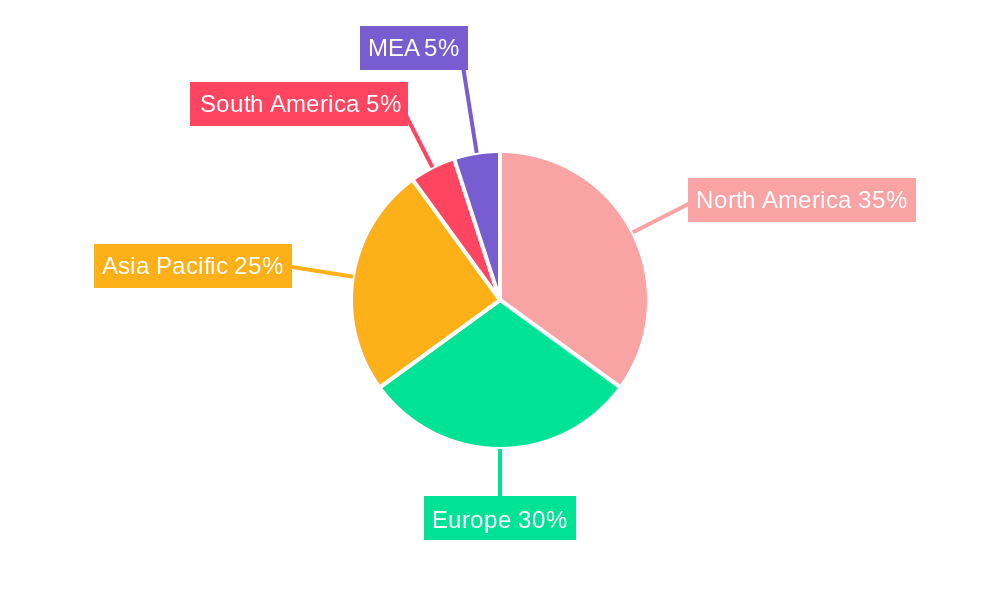
Ladder Industry Regional Market Share
Geographic Coverage of Ladder Industry
Ladder Industry REPORT HIGHLIGHTS
| Aspects | Details |
|---|---|
| Study Period | 2020-2034 |
| Base Year | 2025 |
| Estimated Year | 2026 |
| Forecast Period | 2026-2034 |
| Historical Period | 2020-2025 |
| Growth Rate | CAGR of > 4.50% from 2020-2034 |
| Segmentation |
|
Table of Contents
- 1. Introduction
- 1.1. Research Scope
- 1.2. Market Segmentation
- 1.3. Research Objective
- 1.4. Definitions and Assumptions
- 2. Executive Summary
- 2.1. Market Snapshot
- 3. Market Dynamics
- 3.1. Market Drivers
- 3.2. Market Restrains
- 3.3. Market Trends
- 3.4. Market Opportunities
- 4. Market Factor Analysis
- 4.1. Porters Five Forces
- 4.1.1. Bargaining Power of Suppliers
- 4.1.2. Bargaining Power of Buyers
- 4.1.3. Threat of New Entrants
- 4.1.4. Threat of Substitutes
- 4.1.5. Competitive Rivalry
- 4.2. PESTEL analysis
- 4.3. BCG Analysis
- 4.3.1. Stars (High Growth, High Market Share)
- 4.3.2. Cash Cows (Low Growth, High Market Share)
- 4.3.3. Question Mark (High Growth, Low Market Share)
- 4.3.4. Dogs (Low Growth, Low Market Share)
- 4.4. Ansoff Matrix Analysis
- 4.5. Supply Chain Analysis
- 4.6. Regulatory Landscape
- 4.7. Current Market Potential and Opportunity Assessment (TAM–SAM–SOM Framework)
- 4.8. RAX Analyst Note
- 4.1. Porters Five Forces
- 5. Market Analysis, Insights and Forecast 2021-2033
- 5.1. Market Analysis, Insights and Forecast - by Production Analysis
- 5.2. Market Analysis, Insights and Forecast - by Consumption Analysis
- 5.3. Market Analysis, Insights and Forecast - by Import Market Analysis (Value & Volume)
- 5.4. Market Analysis, Insights and Forecast - by Export Market Analysis (Value & Volume)
- 5.5. Market Analysis, Insights and Forecast - by Price Trend Analysis
- 5.6. Market Analysis, Insights and Forecast - by Region
- 5.6.1. North America
- 5.6.2. South America
- 5.6.3. Europe
- 5.6.4. Middle East & Africa
- 5.6.5. Asia Pacific
- 6. Global Ladder Industry Analysis, Insights and Forecast, 2021-2033
- 6.1. Market Analysis, Insights and Forecast - by Production Analysis
- 6.2. Market Analysis, Insights and Forecast - by Consumption Analysis
- 6.3. Market Analysis, Insights and Forecast - by Import Market Analysis (Value & Volume)
- 6.4. Market Analysis, Insights and Forecast - by Export Market Analysis (Value & Volume)
- 6.5. Market Analysis, Insights and Forecast - by Price Trend Analysis
- 7. North America Ladder Industry Analysis, Insights and Forecast, 2020-2032
- 7.1. Market Analysis, Insights and Forecast - by Production Analysis
- 7.2. Market Analysis, Insights and Forecast - by Consumption Analysis
- 7.3. Market Analysis, Insights and Forecast - by Import Market Analysis (Value & Volume)
- 7.4. Market Analysis, Insights and Forecast - by Export Market Analysis (Value & Volume)
- 7.5. Market Analysis, Insights and Forecast - by Price Trend Analysis
- 8. South America Ladder Industry Analysis, Insights and Forecast, 2020-2032
- 8.1. Market Analysis, Insights and Forecast - by Production Analysis
- 8.2. Market Analysis, Insights and Forecast - by Consumption Analysis
- 8.3. Market Analysis, Insights and Forecast - by Import Market Analysis (Value & Volume)
- 8.4. Market Analysis, Insights and Forecast - by Export Market Analysis (Value & Volume)
- 8.5. Market Analysis, Insights and Forecast - by Price Trend Analysis
- 9. Europe Ladder Industry Analysis, Insights and Forecast, 2020-2032
- 9.1. Market Analysis, Insights and Forecast - by Production Analysis
- 9.2. Market Analysis, Insights and Forecast - by Consumption Analysis
- 9.3. Market Analysis, Insights and Forecast - by Import Market Analysis (Value & Volume)
- 9.4. Market Analysis, Insights and Forecast - by Export Market Analysis (Value & Volume)
- 9.5. Market Analysis, Insights and Forecast - by Price Trend Analysis
- 10. Middle East & Africa Ladder Industry Analysis, Insights and Forecast, 2020-2032
- 10.1. Market Analysis, Insights and Forecast - by Production Analysis
- 10.2. Market Analysis, Insights and Forecast - by Consumption Analysis
- 10.3. Market Analysis, Insights and Forecast - by Import Market Analysis (Value & Volume)
- 10.4. Market Analysis, Insights and Forecast - by Export Market Analysis (Value & Volume)
- 10.5. Market Analysis, Insights and Forecast - by Price Trend Analysis
- 11. Asia Pacific Ladder Industry Analysis, Insights and Forecast, 2020-2032
- 11.1. Market Analysis, Insights and Forecast - by Production Analysis
- 11.2. Market Analysis, Insights and Forecast - by Consumption Analysis
- 11.3. Market Analysis, Insights and Forecast - by Import Market Analysis (Value & Volume)
- 11.4. Market Analysis, Insights and Forecast - by Export Market Analysis (Value & Volume)
- 11.5. Market Analysis, Insights and Forecast - by Price Trend Analysis
- 12. Competitive Analysis
- 12.1. Company Profiles
- 12.1.1 Little Giant Ladder
- 12.1.1.1. Company Overview
- 12.1.1.2. Products
- 12.1.1.3. Company Financials
- 12.1.1.4. SWOT Analysis
- 12.1.2 Tri-arc Manufacturing
- 12.1.2.1. Company Overview
- 12.1.2.2. Products
- 12.1.2.3. Company Financials
- 12.1.2.4. SWOT Analysis
- 12.1.3 Alaco Ladders
- 12.1.3.1. Company Overview
- 12.1.3.2. Products
- 12.1.3.3. Company Financials
- 12.1.3.4. SWOT Analysis
- 12.1.4 Jumbor Industrial Co Ltd
- 12.1.4.1. Company Overview
- 12.1.4.2. Products
- 12.1.4.3. Company Financials
- 12.1.4.4. SWOT Analysis
- 12.1.5 Sagar Asia
- 12.1.5.1. Company Overview
- 12.1.5.2. Products
- 12.1.5.3. Company Financials
- 12.1.5.4. SWOT Analysis
- 12.1.6 TB Davies (Cardiff)
- 12.1.6.1. Company Overview
- 12.1.6.2. Products
- 12.1.6.3. Company Financials
- 12.1.6.4. SWOT Analysis
- 12.1.7 Bauer Ladder Inc
- 12.1.7.1. Company Overview
- 12.1.7.2. Products
- 12.1.7.3. Company Financials
- 12.1.7.4. SWOT Analysis
- 12.1.8 Louisville Ladder
- 12.1.8.1. Company Overview
- 12.1.8.2. Products
- 12.1.8.3. Company Financials
- 12.1.8.4. SWOT Analysis
- 12.1.9 Tubesca-comabi
- 12.1.9.1. Company Overview
- 12.1.9.2. Products
- 12.1.9.3. Company Financials
- 12.1.9.4. SWOT Analysis
- 12.1.10 Werner Co ( Werner ladder)
- 12.1.10.1. Company Overview
- 12.1.10.2. Products
- 12.1.10.3. Company Financials
- 12.1.10.4. SWOT Analysis
- 12.1.11 Gorilla Ladder
- 12.1.11.1. Company Overview
- 12.1.11.2. Products
- 12.1.11.3. Company Financials
- 12.1.11.4. SWOT Analysis
- 12.1.1 Little Giant Ladder
- 12.2. Market Entropy
- 12.2.1 Company's Key Areas Served
- 12.2.2 Recent Developments
- 12.3. Company Market Share Analysis 2025
- 12.3.1 Top 5 Companies Market Share Analysis
- 12.3.2 Top 3 Companies Market Share Analysis
- 12.4. List of Potential Customers
- 13. Research Methodology
List of Figures
- Figure 1: Global Ladder Industry Revenue Breakdown (Million, %) by Region 2025 & 2033
- Figure 2: North America Ladder Industry Revenue (Million), by Production Analysis 2025 & 2033
- Figure 3: North America Ladder Industry Revenue Share (%), by Production Analysis 2025 & 2033
- Figure 4: North America Ladder Industry Revenue (Million), by Consumption Analysis 2025 & 2033
- Figure 5: North America Ladder Industry Revenue Share (%), by Consumption Analysis 2025 & 2033
- Figure 6: North America Ladder Industry Revenue (Million), by Import Market Analysis (Value & Volume) 2025 & 2033
- Figure 7: North America Ladder Industry Revenue Share (%), by Import Market Analysis (Value & Volume) 2025 & 2033
- Figure 8: North America Ladder Industry Revenue (Million), by Export Market Analysis (Value & Volume) 2025 & 2033
- Figure 9: North America Ladder Industry Revenue Share (%), by Export Market Analysis (Value & Volume) 2025 & 2033
- Figure 10: North America Ladder Industry Revenue (Million), by Price Trend Analysis 2025 & 2033
- Figure 11: North America Ladder Industry Revenue Share (%), by Price Trend Analysis 2025 & 2033
- Figure 12: North America Ladder Industry Revenue (Million), by Country 2025 & 2033
- Figure 13: North America Ladder Industry Revenue Share (%), by Country 2025 & 2033
- Figure 14: South America Ladder Industry Revenue (Million), by Production Analysis 2025 & 2033
- Figure 15: South America Ladder Industry Revenue Share (%), by Production Analysis 2025 & 2033
- Figure 16: South America Ladder Industry Revenue (Million), by Consumption Analysis 2025 & 2033
- Figure 17: South America Ladder Industry Revenue Share (%), by Consumption Analysis 2025 & 2033
- Figure 18: South America Ladder Industry Revenue (Million), by Import Market Analysis (Value & Volume) 2025 & 2033
- Figure 19: South America Ladder Industry Revenue Share (%), by Import Market Analysis (Value & Volume) 2025 & 2033
- Figure 20: South America Ladder Industry Revenue (Million), by Export Market Analysis (Value & Volume) 2025 & 2033
- Figure 21: South America Ladder Industry Revenue Share (%), by Export Market Analysis (Value & Volume) 2025 & 2033
- Figure 22: South America Ladder Industry Revenue (Million), by Price Trend Analysis 2025 & 2033
- Figure 23: South America Ladder Industry Revenue Share (%), by Price Trend Analysis 2025 & 2033
- Figure 24: South America Ladder Industry Revenue (Million), by Country 2025 & 2033
- Figure 25: South America Ladder Industry Revenue Share (%), by Country 2025 & 2033
- Figure 26: Europe Ladder Industry Revenue (Million), by Production Analysis 2025 & 2033
- Figure 27: Europe Ladder Industry Revenue Share (%), by Production Analysis 2025 & 2033
- Figure 28: Europe Ladder Industry Revenue (Million), by Consumption Analysis 2025 & 2033
- Figure 29: Europe Ladder Industry Revenue Share (%), by Consumption Analysis 2025 & 2033
- Figure 30: Europe Ladder Industry Revenue (Million), by Import Market Analysis (Value & Volume) 2025 & 2033
- Figure 31: Europe Ladder Industry Revenue Share (%), by Import Market Analysis (Value & Volume) 2025 & 2033
- Figure 32: Europe Ladder Industry Revenue (Million), by Export Market Analysis (Value & Volume) 2025 & 2033
- Figure 33: Europe Ladder Industry Revenue Share (%), by Export Market Analysis (Value & Volume) 2025 & 2033
- Figure 34: Europe Ladder Industry Revenue (Million), by Price Trend Analysis 2025 & 2033
- Figure 35: Europe Ladder Industry Revenue Share (%), by Price Trend Analysis 2025 & 2033
- Figure 36: Europe Ladder Industry Revenue (Million), by Country 2025 & 2033
- Figure 37: Europe Ladder Industry Revenue Share (%), by Country 2025 & 2033
- Figure 38: Middle East & Africa Ladder Industry Revenue (Million), by Production Analysis 2025 & 2033
- Figure 39: Middle East & Africa Ladder Industry Revenue Share (%), by Production Analysis 2025 & 2033
- Figure 40: Middle East & Africa Ladder Industry Revenue (Million), by Consumption Analysis 2025 & 2033
- Figure 41: Middle East & Africa Ladder Industry Revenue Share (%), by Consumption Analysis 2025 & 2033
- Figure 42: Middle East & Africa Ladder Industry Revenue (Million), by Import Market Analysis (Value & Volume) 2025 & 2033
- Figure 43: Middle East & Africa Ladder Industry Revenue Share (%), by Import Market Analysis (Value & Volume) 2025 & 2033
- Figure 44: Middle East & Africa Ladder Industry Revenue (Million), by Export Market Analysis (Value & Volume) 2025 & 2033
- Figure 45: Middle East & Africa Ladder Industry Revenue Share (%), by Export Market Analysis (Value & Volume) 2025 & 2033
- Figure 46: Middle East & Africa Ladder Industry Revenue (Million), by Price Trend Analysis 2025 & 2033
- Figure 47: Middle East & Africa Ladder Industry Revenue Share (%), by Price Trend Analysis 2025 & 2033
- Figure 48: Middle East & Africa Ladder Industry Revenue (Million), by Country 2025 & 2033
- Figure 49: Middle East & Africa Ladder Industry Revenue Share (%), by Country 2025 & 2033
- Figure 50: Asia Pacific Ladder Industry Revenue (Million), by Production Analysis 2025 & 2033
- Figure 51: Asia Pacific Ladder Industry Revenue Share (%), by Production Analysis 2025 & 2033
- Figure 52: Asia Pacific Ladder Industry Revenue (Million), by Consumption Analysis 2025 & 2033
- Figure 53: Asia Pacific Ladder Industry Revenue Share (%), by Consumption Analysis 2025 & 2033
- Figure 54: Asia Pacific Ladder Industry Revenue (Million), by Import Market Analysis (Value & Volume) 2025 & 2033
- Figure 55: Asia Pacific Ladder Industry Revenue Share (%), by Import Market Analysis (Value & Volume) 2025 & 2033
- Figure 56: Asia Pacific Ladder Industry Revenue (Million), by Export Market Analysis (Value & Volume) 2025 & 2033
- Figure 57: Asia Pacific Ladder Industry Revenue Share (%), by Export Market Analysis (Value & Volume) 2025 & 2033
- Figure 58: Asia Pacific Ladder Industry Revenue (Million), by Price Trend Analysis 2025 & 2033
- Figure 59: Asia Pacific Ladder Industry Revenue Share (%), by Price Trend Analysis 2025 & 2033
- Figure 60: Asia Pacific Ladder Industry Revenue (Million), by Country 2025 & 2033
- Figure 61: Asia Pacific Ladder Industry Revenue Share (%), by Country 2025 & 2033
List of Tables
- Table 1: Global Ladder Industry Revenue Million Forecast, by Production Analysis 2020 & 2033
- Table 2: Global Ladder Industry Revenue Million Forecast, by Consumption Analysis 2020 & 2033
- Table 3: Global Ladder Industry Revenue Million Forecast, by Import Market Analysis (Value & Volume) 2020 & 2033
- Table 4: Global Ladder Industry Revenue Million Forecast, by Export Market Analysis (Value & Volume) 2020 & 2033
- Table 5: Global Ladder Industry Revenue Million Forecast, by Price Trend Analysis 2020 & 2033
- Table 6: Global Ladder Industry Revenue Million Forecast, by Region 2020 & 2033
- Table 7: Global Ladder Industry Revenue Million Forecast, by Production Analysis 2020 & 2033
- Table 8: Global Ladder Industry Revenue Million Forecast, by Consumption Analysis 2020 & 2033
- Table 9: Global Ladder Industry Revenue Million Forecast, by Import Market Analysis (Value & Volume) 2020 & 2033
- Table 10: Global Ladder Industry Revenue Million Forecast, by Export Market Analysis (Value & Volume) 2020 & 2033
- Table 11: Global Ladder Industry Revenue Million Forecast, by Price Trend Analysis 2020 & 2033
- Table 12: Global Ladder Industry Revenue Million Forecast, by Country 2020 & 2033
- Table 13: United States Ladder Industry Revenue (Million) Forecast, by Application 2020 & 2033
- Table 14: Canada Ladder Industry Revenue (Million) Forecast, by Application 2020 & 2033
- Table 15: Mexico Ladder Industry Revenue (Million) Forecast, by Application 2020 & 2033
- Table 16: Global Ladder Industry Revenue Million Forecast, by Production Analysis 2020 & 2033
- Table 17: Global Ladder Industry Revenue Million Forecast, by Consumption Analysis 2020 & 2033
- Table 18: Global Ladder Industry Revenue Million Forecast, by Import Market Analysis (Value & Volume) 2020 & 2033
- Table 19: Global Ladder Industry Revenue Million Forecast, by Export Market Analysis (Value & Volume) 2020 & 2033
- Table 20: Global Ladder Industry Revenue Million Forecast, by Price Trend Analysis 2020 & 2033
- Table 21: Global Ladder Industry Revenue Million Forecast, by Country 2020 & 2033
- Table 22: Brazil Ladder Industry Revenue (Million) Forecast, by Application 2020 & 2033
- Table 23: Argentina Ladder Industry Revenue (Million) Forecast, by Application 2020 & 2033
- Table 24: Rest of South America Ladder Industry Revenue (Million) Forecast, by Application 2020 & 2033
- Table 25: Global Ladder Industry Revenue Million Forecast, by Production Analysis 2020 & 2033
- Table 26: Global Ladder Industry Revenue Million Forecast, by Consumption Analysis 2020 & 2033
- Table 27: Global Ladder Industry Revenue Million Forecast, by Import Market Analysis (Value & Volume) 2020 & 2033
- Table 28: Global Ladder Industry Revenue Million Forecast, by Export Market Analysis (Value & Volume) 2020 & 2033
- Table 29: Global Ladder Industry Revenue Million Forecast, by Price Trend Analysis 2020 & 2033
- Table 30: Global Ladder Industry Revenue Million Forecast, by Country 2020 & 2033
- Table 31: United Kingdom Ladder Industry Revenue (Million) Forecast, by Application 2020 & 2033
- Table 32: Germany Ladder Industry Revenue (Million) Forecast, by Application 2020 & 2033
- Table 33: France Ladder Industry Revenue (Million) Forecast, by Application 2020 & 2033
- Table 34: Italy Ladder Industry Revenue (Million) Forecast, by Application 2020 & 2033
- Table 35: Spain Ladder Industry Revenue (Million) Forecast, by Application 2020 & 2033
- Table 36: Russia Ladder Industry Revenue (Million) Forecast, by Application 2020 & 2033
- Table 37: Benelux Ladder Industry Revenue (Million) Forecast, by Application 2020 & 2033
- Table 38: Nordics Ladder Industry Revenue (Million) Forecast, by Application 2020 & 2033
- Table 39: Rest of Europe Ladder Industry Revenue (Million) Forecast, by Application 2020 & 2033
- Table 40: Global Ladder Industry Revenue Million Forecast, by Production Analysis 2020 & 2033
- Table 41: Global Ladder Industry Revenue Million Forecast, by Consumption Analysis 2020 & 2033
- Table 42: Global Ladder Industry Revenue Million Forecast, by Import Market Analysis (Value & Volume) 2020 & 2033
- Table 43: Global Ladder Industry Revenue Million Forecast, by Export Market Analysis (Value & Volume) 2020 & 2033
- Table 44: Global Ladder Industry Revenue Million Forecast, by Price Trend Analysis 2020 & 2033
- Table 45: Global Ladder Industry Revenue Million Forecast, by Country 2020 & 2033
- Table 46: Turkey Ladder Industry Revenue (Million) Forecast, by Application 2020 & 2033
- Table 47: Israel Ladder Industry Revenue (Million) Forecast, by Application 2020 & 2033
- Table 48: GCC Ladder Industry Revenue (Million) Forecast, by Application 2020 & 2033
- Table 49: North Africa Ladder Industry Revenue (Million) Forecast, by Application 2020 & 2033
- Table 50: South Africa Ladder Industry Revenue (Million) Forecast, by Application 2020 & 2033
- Table 51: Rest of Middle East & Africa Ladder Industry Revenue (Million) Forecast, by Application 2020 & 2033
- Table 52: Global Ladder Industry Revenue Million Forecast, by Production Analysis 2020 & 2033
- Table 53: Global Ladder Industry Revenue Million Forecast, by Consumption Analysis 2020 & 2033
- Table 54: Global Ladder Industry Revenue Million Forecast, by Import Market Analysis (Value & Volume) 2020 & 2033
- Table 55: Global Ladder Industry Revenue Million Forecast, by Export Market Analysis (Value & Volume) 2020 & 2033
- Table 56: Global Ladder Industry Revenue Million Forecast, by Price Trend Analysis 2020 & 2033
- Table 57: Global Ladder Industry Revenue Million Forecast, by Country 2020 & 2033
- Table 58: China Ladder Industry Revenue (Million) Forecast, by Application 2020 & 2033
- Table 59: India Ladder Industry Revenue (Million) Forecast, by Application 2020 & 2033
- Table 60: Japan Ladder Industry Revenue (Million) Forecast, by Application 2020 & 2033
- Table 61: South Korea Ladder Industry Revenue (Million) Forecast, by Application 2020 & 2033
- Table 62: ASEAN Ladder Industry Revenue (Million) Forecast, by Application 2020 & 2033
- Table 63: Oceania Ladder Industry Revenue (Million) Forecast, by Application 2020 & 2033
- Table 64: Rest of Asia Pacific Ladder Industry Revenue (Million) Forecast, by Application 2020 & 2033
Frequently Asked Questions
1. What is the projected Compound Annual Growth Rate (CAGR) of the Ladder Industry?
The projected CAGR is approximately > 4.50%.
2. Which companies are prominent players in the Ladder Industry?
Key companies in the market include Little Giant Ladder, Tri-arc Manufacturing, Alaco Ladders, Jumbor Industrial Co Ltd, Sagar Asia, TB Davies (Cardiff), Bauer Ladder Inc, Louisville Ladder, Tubesca-comabi, Werner Co ( Werner ladder), Gorilla Ladder.
3. What are the main segments of the Ladder Industry?
The market segments include Production Analysis, Consumption Analysis, Import Market Analysis (Value & Volume), Export Market Analysis (Value & Volume), Price Trend Analysis.
4. Can you provide details about the market size?
The market size is estimated to be USD XX Million as of 2022.
5. What are some drivers contributing to market growth?
Increasing Online Sales is Driving the Market; Growing Urbanization is Driving Need for Cookware.
6. What are the notable trends driving market growth?
Aluminum Metal Ladders are Dominantly Used in the Market While Fiber Glass Ladder are Expected to Grow Fastest..
7. Are there any restraints impacting market growth?
Changing Needs of Customers; Limited Usage of the Product.
8. Can you provide examples of recent developments in the market?
N/A
9. What pricing options are available for accessing the report?
Pricing options include single-user, multi-user, and enterprise licenses priced at USD 4750, USD 5250, and USD 8750 respectively.
10. Is the market size provided in terms of value or volume?
The market size is provided in terms of value, measured in Million.
11. Are there any specific market keywords associated with the report?
Yes, the market keyword associated with the report is "Ladder Industry," which aids in identifying and referencing the specific market segment covered.
12. How do I determine which pricing option suits my needs best?
The pricing options vary based on user requirements and access needs. Individual users may opt for single-user licenses, while businesses requiring broader access may choose multi-user or enterprise licenses for cost-effective access to the report.
13. Are there any additional resources or data provided in the Ladder Industry report?
While the report offers comprehensive insights, it's advisable to review the specific contents or supplementary materials provided to ascertain if additional resources or data are available.
14. How can I stay updated on further developments or reports in the Ladder Industry?
To stay informed about further developments, trends, and reports in the Ladder Industry, consider subscribing to industry newsletters, following relevant companies and organizations, or regularly checking reputable industry news sources and publications.
Methodology
Step 1 - Identification of Relevant Samples Size from Population Database


Step 2 - Approaches for Defining Global Market Size (Value, Volume* & Price*)

Note*: In applicable scenarios
Step 3 - Data Sources
Primary Research
- Web Analytics
- Survey Reports
- Research Institute
- Latest Research Reports
- Opinion Leaders
Secondary Research
- Annual Reports
- White Paper
- Latest Press Release
- Industry Association
- Paid Database
- Investor Presentations

Step 4 - Data Triangulation
Involves using different sources of information in order to increase the validity of a study
These sources are likely to be stakeholders in a program - participants, other researchers, program staff, other community members, and so on.
Then we put all data in single framework & apply various statistical tools to find out the dynamic on the market.
During the analysis stage, feedback from the stakeholder groups would be compared to determine areas of agreement as well as areas of divergence