

Key Insights
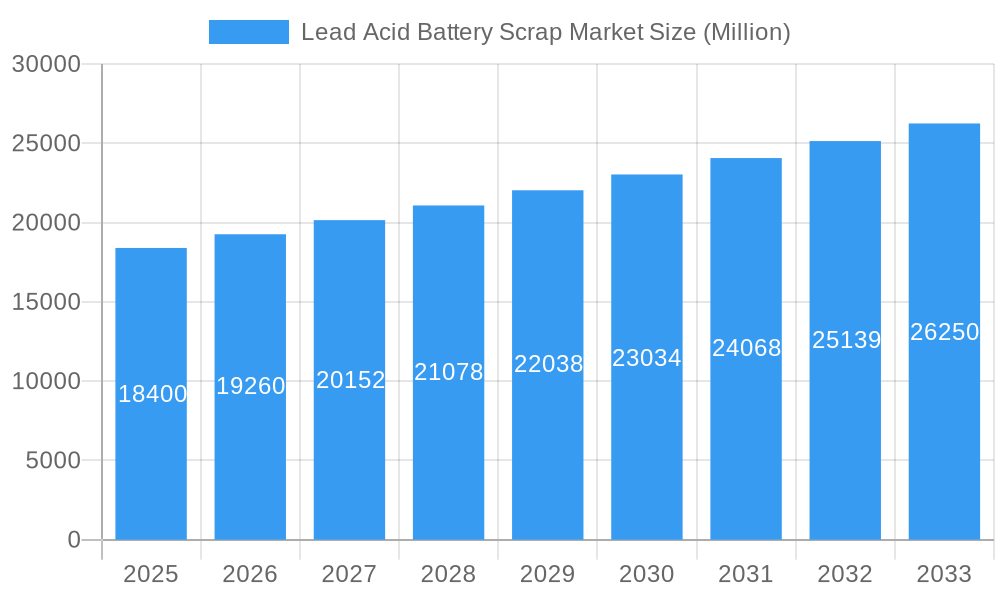
The global Lead Acid Battery Scrap market, valued at $18.40 billion in 2025, is projected to experience robust growth, driven by the increasing demand for recycled lead and the rising environmental concerns surrounding battery waste. A compound annual growth rate (CAGR) of 4.65% is anticipated from 2025 to 2033, indicating a significant market expansion. This growth is fueled by several key factors. Stringent environmental regulations globally are pushing for responsible e-waste management, incentivizing the recycling of lead-acid batteries. Furthermore, the escalating cost of primary lead extraction makes recycled lead a more economically viable option for battery manufacturers. The automotive industry, a major consumer of lead-acid batteries, is also witnessing growth, indirectly boosting the demand for scrap battery recycling. Major players like Gravita India Ltd, Exide Industries Ltd, and Enersys are actively shaping the market landscape through technological advancements in recycling processes and strategic partnerships. While challenges such as fluctuating lead prices and the need for efficient collection infrastructure exist, the long-term outlook for the lead-acid battery scrap market remains positive, driven by sustainable practices and economic incentives.
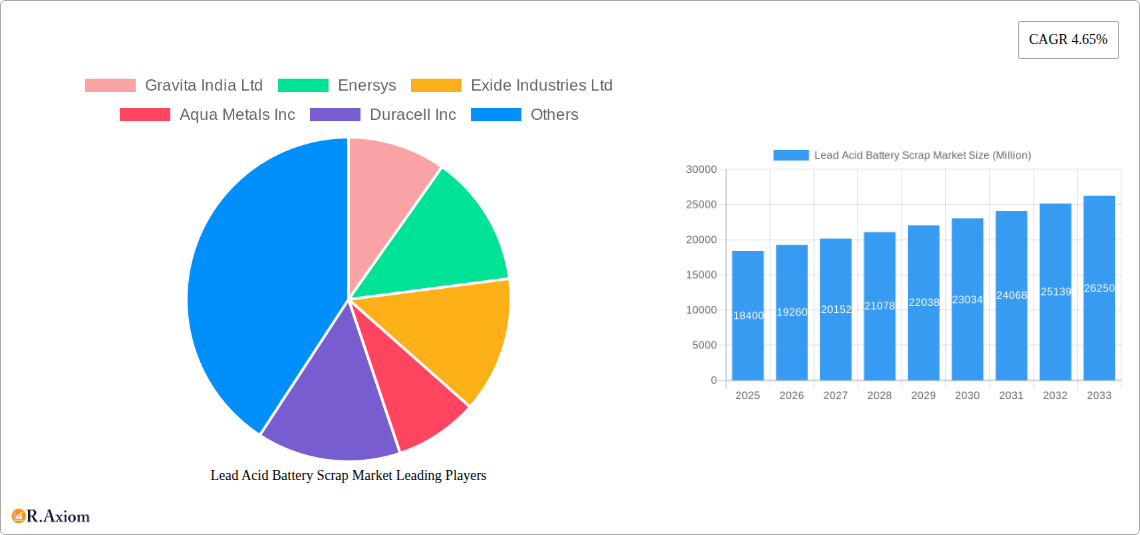
Lead Acid Battery Scrap Market Market Size (In Billion)
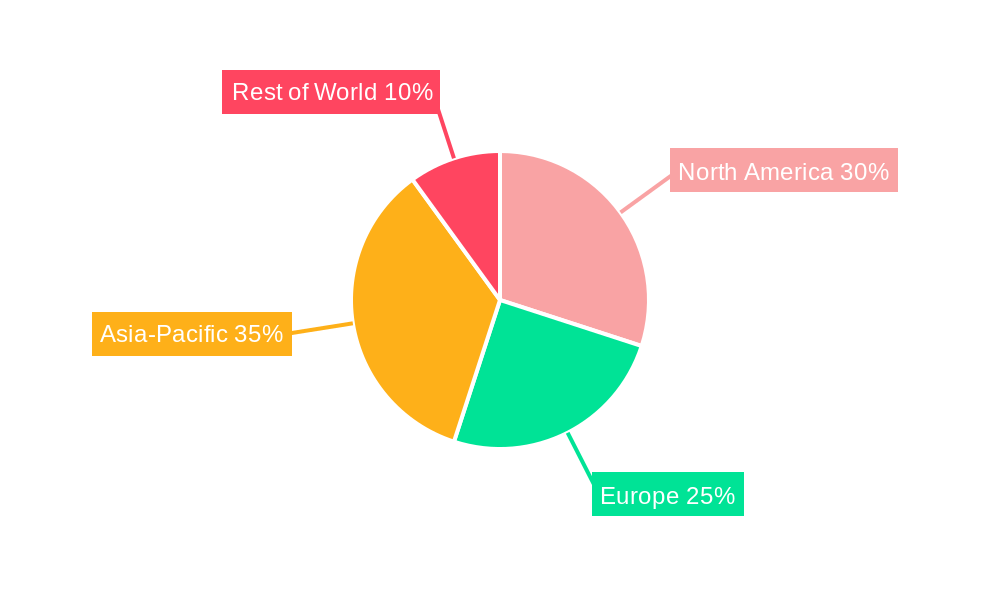
The market segmentation, while not explicitly detailed, is likely to be categorized by battery type (automotive, industrial, etc.), recycling method (primary smelting, secondary smelting), and geographic region. Competitive analysis suggests a diverse landscape with both established players and emerging companies vying for market share. The regional distribution will likely see variations due to differing levels of industrialization, environmental regulations, and battery usage patterns. North America and Europe are anticipated to hold substantial market shares, followed by Asia-Pacific, driven by high vehicle ownership and manufacturing activities. Continuous innovation in recycling technologies, focusing on improved efficiency and reduced environmental impact, is crucial for sustaining the growth trajectory of this market. The market’s future success hinges on effective collaboration among stakeholders, including governments, recycling companies, and battery manufacturers.
Lead Acid Battery Scrap Market Company Market Share
Lead Acid Battery Scrap Market: A Comprehensive Report (2019-2033)
This detailed report provides a comprehensive analysis of the global Lead Acid Battery Scrap Market, offering invaluable insights for industry stakeholders, investors, and strategic decision-makers. The study period spans from 2019 to 2033, with 2025 serving as the base and estimated year. The report meticulously examines market dynamics, including growth drivers, challenges, opportunities, and competitive landscapes, providing a robust forecast for 2025-2033. Key players like Gravita India Ltd, Enersys, Exide Industries Ltd, Aqua Metals Inc, Duracell Inc, AMIDT Group, Engitec Technologies SpA, and Ecobat Technologies Ltd are profiled, offering a granular understanding of the market's competitive structure. This report is crucial for navigating the complexities of this evolving market and making informed strategic decisions.
Lead Acid Battery Scrap Market Concentration & Innovation
The Lead Acid Battery Scrap market exhibits a moderately concentrated structure, with a few major players holding significant market share. However, the presence of numerous smaller regional players ensures a dynamic competitive landscape. Market share data for 2024 indicates that the top five players collectively hold approximately xx% of the market. Innovation is driven by advancements in recycling technologies, aiming for higher recovery rates of valuable metals like lead and improving the efficiency and sustainability of recycling processes. Stringent environmental regulations across various geographies are also significant drivers of innovation, pushing companies to adopt cleaner and more efficient methods. Mergers and acquisitions (M&A) activities have been relatively frequent in recent years, with deal values ranging from xx Million to xx Million, indicating consolidation efforts within the industry. These activities reflect companies’ strategies to expand their market reach, enhance technological capabilities, and secure access to critical raw materials. The market is also witnessing increased adoption of circular economy principles, driving the demand for recycled lead and boosting investments in innovative recycling technologies. Product substitution is limited, as lead-acid batteries still dominate in certain applications despite growing competition from alternative battery technologies. End-user trends are influenced by factors such as stringent environmental regulations, growing demand for recycled materials, and the need for cost-effective solutions.
Lead Acid Battery Scrap Market Industry Trends & Insights
The global Lead Acid Battery Scrap market is experiencing steady growth, with a projected Compound Annual Growth Rate (CAGR) of xx% during the forecast period (2025-2033). This growth is primarily fueled by the increasing demand for lead-acid batteries in various applications, including automotive, industrial, and stationary power systems. Technological disruptions in the recycling industry, such as advancements in hydrometallurgical and pyrometallurgical processes, are improving the efficiency and cost-effectiveness of lead recovery. The rising adoption of electric vehicles (EVs) is indirectly impacting the market, as it is expected to lead to a larger volume of end-of-life batteries in the future, thus increasing the raw material supply for recycling. Consumer preferences are shifting towards environmentally friendly and sustainable solutions, bolstering the demand for recycled lead and promoting sustainable recycling practices. Competitive dynamics are characterized by intense competition among established players and the emergence of new entrants, driving innovation and improving efficiency within the sector. Market penetration of advanced recycling technologies is expected to increase from xx% in 2024 to xx% by 2033.
Dominant Markets & Segments in Lead Acid Battery Scrap Market
The Asia-Pacific region is currently the dominant market for lead-acid battery scrap, accounting for approximately xx% of the global market share in 2024. This dominance is primarily attributed to:
- High Production & Consumption of Lead-Acid Batteries: The region is home to several major lead-acid battery manufacturers and a large consumer base, creating a high volume of scrap generation.
- Rapid Industrialization & Urbanization: Growing industrialization and urbanization fuel the demand for lead-acid batteries in various sectors, contributing to the large scrap volume.
- Favorable Government Policies & Regulations: Some governments in the region are implementing supportive policies aimed at promoting recycling and responsible waste management.
Within the Asia-Pacific region, countries like China, India, and Japan are key markets driving this segment. A detailed analysis reveals the contribution of various factors like economic policies, infrastructure development, and consumer preferences to each nation's dominance. The North American and European markets also show significant growth potential, driven by stricter environmental regulations and the increasing adoption of sustainable practices.
Lead Acid Battery Scrap Market Product Developments
Recent product innovations focus on enhancing the efficiency and sustainability of lead-acid battery recycling processes. Advancements in hydrometallurgical and pyrometallurgical technologies are leading to higher lead recovery rates and reduced environmental impact. New applications for recycled lead are emerging in various industries, further driving market demand. Competitive advantages are gained through superior recycling technologies, efficient logistics, and environmentally responsible practices, attracting customers seeking sustainable solutions.
Report Scope & Segmentation Analysis
This report segments the lead-acid battery scrap market based on several factors:
By Battery Type: This segment categorizes scrap based on the type of lead-acid battery (automotive, industrial, stationary). Growth projections vary significantly based on battery type, with automotive batteries experiencing higher growth due to higher production volumes. Market size estimates for each segment reflect the current market conditions and expected future growth. Competitive dynamics within each segment are analyzed, highlighting key players and their market share.
By Recycling Process: This segment examines the different recycling techniques used, such as hydrometallurgy and pyrometallurgy. The adoption rate of each technology is analyzed, with projections for future market shares based on factors such as cost-effectiveness and environmental impact.
By Region: This segment includes analysis of major regions such as North America, Europe, Asia-Pacific, and Rest of the World. Each region’s unique characteristics and growth potential are examined considering the local regulations, economic conditions, and lead-acid battery usage patterns.
Key Drivers of Lead Acid Battery Scrap Market Growth
Several factors fuel the growth of the lead-acid battery scrap market: increasing demand for lead-acid batteries in diverse applications like automotive, industrial, and energy storage; stringent environmental regulations promoting responsible recycling; rising awareness of sustainable practices; advancements in battery recycling technologies improving efficiency and cost-effectiveness; the development of new applications for recycled lead which has enhanced market demand and is expected to continue driving growth.
Challenges in the Lead Acid Battery Scrap Market Sector
The industry faces several challenges, including: fluctuating lead prices impacting the profitability of recycling operations; stringent environmental regulations imposing compliance costs; the complexity and cost of managing hazardous waste materials; competition from alternative battery technologies; and inconsistent supply of battery scrap due to variations in collection and transportation infrastructure which can lead to inconsistent supply, potentially impacting the overall recycling industry profitability and overall capacity. These factors can significantly restrict market expansion.
Emerging Opportunities in Lead Acid Battery Scrap Market
Emerging opportunities lie in: the expanding EV market indirectly boosting scrap supply in the future; advancements in recycling technology leading to improved efficiency; the development of closed-loop recycling systems enhancing sustainability; and growing demand for recycled lead from industries aiming to meet sustainability targets. These trends offer significant growth potentials for companies that innovate and adapt to the changing market dynamics.
Leading Players in the Lead Acid Battery Scrap Market
- Gravita India Ltd
- Enersys
- Exide Industries Ltd
- Aqua Metals Inc
- Duracell Inc
- AMIDT Group
- Engitec Technologies SpA
- Ecobat Technologies Ltd
- List Not Exhaustive
Key Developments in Lead Acid Battery Scrap Market Industry
December 2023: Toyota and Criba Solution partnered to expand the recycling network for EV batteries, aiming to reduce transportation costs by 70% and recover up to 95% of essential minerals. This collaboration signifies a significant push towards sustainable battery recycling within the EV industry.
January 2023: ACE Green Recycling (ACE) and Glencore PLC (GLEN) signed a long-term supply agreement for recycled lead and other battery metals, establishing a circular supply chain for these crucial materials. This partnership demonstrates the growing importance of secure and sustainable supply chains within the battery recycling industry.
Strategic Outlook for Lead Acid Battery Scrap Market
The future of the lead-acid battery scrap market appears promising, driven by the increasing demand for recycled lead, stringent environmental regulations, and technological advancements in recycling processes. The market's growth is expected to be fuelled by the rising demand for sustainable solutions across various industries. Companies focusing on innovation, sustainable practices, and efficient logistics will be well-positioned to capitalize on the emerging opportunities within this dynamic market. The expanding EV sector, while posing initial challenges, is likely to become a significant long-term driver of growth in the lead-acid battery scrap market.
Lead Acid Battery Scrap Market Segmentation
-
1. Battery Type
- 1.1. Flooded
- 1.2. Sealed
-
2. Source
- 2.1. Motor Vehicles
- 2.2. Uninterrupted Power Supply
- 2.3. Telecom Stations
- 2.4. Electric Power
Lead Acid Battery Scrap Market Segmentation By Geography
-
1. North America
- 1.1. United States
- 1.2. Canada
- 1.3. Rest of North America
-
2. Europe
- 2.1. Germany
- 2.2. France
- 2.3. United Kingdom
- 2.4. Spain
- 2.5. NORDIC
- 2.6. Turkey
- 2.7. Russia
- 2.8. Rest of Europe
-
3. Asia Pacific
- 3.1. China
- 3.2. India
- 3.3. Japan
- 3.4. South Korea
- 3.5. Malaysia
- 3.6. Thailand
- 3.7. Indonesia
- 3.8. Vietnam
- 3.9. Rest of Asia Pacific
-
4. South America
- 4.1. Brazil
- 4.2. Argentina
- 4.3. Colombia
- 4.4. Rest of South America
-
5. Middle East and Africa
- 5.1. Saudi Arabia
- 5.2. United Arab Emirates
- 5.3. South Africa
- 5.4. Egypt
- 5.5. Nigeria
- 5.6. Qatar
- 5.7. Rest of Middle East and Africa
Lead Acid Battery Scrap Market Regional Market Share
Geographic Coverage of Lead Acid Battery Scrap Market
Lead Acid Battery Scrap Market REPORT HIGHLIGHTS
| Aspects | Details |
|---|---|
| Study Period | 2020-2034 |
| Base Year | 2025 |
| Estimated Year | 2026 |
| Forecast Period | 2026-2034 |
| Historical Period | 2020-2025 |
| Growth Rate | CAGR of 4.65% from 2020-2034 |
| Segmentation |
|
Table of Contents
- 1. Introduction
- 1.1. Research Scope
- 1.2. Market Segmentation
- 1.3. Research Objective
- 1.4. Definitions and Assumptions
- 2. Executive Summary
- 2.1. Market Snapshot
- 3. Market Dynamics
- 3.1. Market Drivers
- 3.2. Market Restrains
- 3.3. Market Trends
- 3.4. Market Opportunities
- 4. Market Factor Analysis
- 4.1. Porters Five Forces
- 4.1.1. Bargaining Power of Suppliers
- 4.1.2. Bargaining Power of Buyers
- 4.1.3. Threat of New Entrants
- 4.1.4. Threat of Substitutes
- 4.1.5. Competitive Rivalry
- 4.2. PESTEL analysis
- 4.3. BCG Analysis
- 4.3.1. Stars (High Growth, High Market Share)
- 4.3.2. Cash Cows (Low Growth, High Market Share)
- 4.3.3. Question Mark (High Growth, Low Market Share)
- 4.3.4. Dogs (Low Growth, Low Market Share)
- 4.4. Ansoff Matrix Analysis
- 4.5. Supply Chain Analysis
- 4.6. Regulatory Landscape
- 4.7. Current Market Potential and Opportunity Assessment (TAM–SAM–SOM Framework)
- 4.8. RAX Analyst Note
- 4.1. Porters Five Forces
- 5. Market Analysis, Insights and Forecast 2021-2033
- 5.1. Market Analysis, Insights and Forecast - by Battery Type
- 5.1.1. Flooded
- 5.1.2. Sealed
- 5.2. Market Analysis, Insights and Forecast - by Source
- 5.2.1. Motor Vehicles
- 5.2.2. Uninterrupted Power Supply
- 5.2.3. Telecom Stations
- 5.2.4. Electric Power
- 5.3. Market Analysis, Insights and Forecast - by Region
- 5.3.1. North America
- 5.3.2. Europe
- 5.3.3. Asia Pacific
- 5.3.4. South America
- 5.3.5. Middle East and Africa
- 5.1. Market Analysis, Insights and Forecast - by Battery Type
- 6. Global Lead Acid Battery Scrap Market Analysis, Insights and Forecast, 2021-2033
- 6.1. Market Analysis, Insights and Forecast - by Battery Type
- 6.1.1. Flooded
- 6.1.2. Sealed
- 6.2. Market Analysis, Insights and Forecast - by Source
- 6.2.1. Motor Vehicles
- 6.2.2. Uninterrupted Power Supply
- 6.2.3. Telecom Stations
- 6.2.4. Electric Power
- 6.1. Market Analysis, Insights and Forecast - by Battery Type
- 7. North America Lead Acid Battery Scrap Market Analysis, Insights and Forecast, 2020-2032
- 7.1. Market Analysis, Insights and Forecast - by Battery Type
- 7.1.1. Flooded
- 7.1.2. Sealed
- 7.2. Market Analysis, Insights and Forecast - by Source
- 7.2.1. Motor Vehicles
- 7.2.2. Uninterrupted Power Supply
- 7.2.3. Telecom Stations
- 7.2.4. Electric Power
- 7.1. Market Analysis, Insights and Forecast - by Battery Type
- 8. Europe Lead Acid Battery Scrap Market Analysis, Insights and Forecast, 2020-2032
- 8.1. Market Analysis, Insights and Forecast - by Battery Type
- 8.1.1. Flooded
- 8.1.2. Sealed
- 8.2. Market Analysis, Insights and Forecast - by Source
- 8.2.1. Motor Vehicles
- 8.2.2. Uninterrupted Power Supply
- 8.2.3. Telecom Stations
- 8.2.4. Electric Power
- 8.1. Market Analysis, Insights and Forecast - by Battery Type
- 9. Asia Pacific Lead Acid Battery Scrap Market Analysis, Insights and Forecast, 2020-2032
- 9.1. Market Analysis, Insights and Forecast - by Battery Type
- 9.1.1. Flooded
- 9.1.2. Sealed
- 9.2. Market Analysis, Insights and Forecast - by Source
- 9.2.1. Motor Vehicles
- 9.2.2. Uninterrupted Power Supply
- 9.2.3. Telecom Stations
- 9.2.4. Electric Power
- 9.1. Market Analysis, Insights and Forecast - by Battery Type
- 10. South America Lead Acid Battery Scrap Market Analysis, Insights and Forecast, 2020-2032
- 10.1. Market Analysis, Insights and Forecast - by Battery Type
- 10.1.1. Flooded
- 10.1.2. Sealed
- 10.2. Market Analysis, Insights and Forecast - by Source
- 10.2.1. Motor Vehicles
- 10.2.2. Uninterrupted Power Supply
- 10.2.3. Telecom Stations
- 10.2.4. Electric Power
- 10.1. Market Analysis, Insights and Forecast - by Battery Type
- 11. Middle East and Africa Lead Acid Battery Scrap Market Analysis, Insights and Forecast, 2020-2032
- 11.1. Market Analysis, Insights and Forecast - by Battery Type
- 11.1.1. Flooded
- 11.1.2. Sealed
- 11.2. Market Analysis, Insights and Forecast - by Source
- 11.2.1. Motor Vehicles
- 11.2.2. Uninterrupted Power Supply
- 11.2.3. Telecom Stations
- 11.2.4. Electric Power
- 11.1. Market Analysis, Insights and Forecast - by Battery Type
- 12. Competitive Analysis
- 12.1. Company Profiles
- 12.1.1 Gravita India Ltd
- 12.1.1.1. Company Overview
- 12.1.1.2. Products
- 12.1.1.3. Company Financials
- 12.1.1.4. SWOT Analysis
- 12.1.2 Enersys
- 12.1.2.1. Company Overview
- 12.1.2.2. Products
- 12.1.2.3. Company Financials
- 12.1.2.4. SWOT Analysis
- 12.1.3 Exide Industries Ltd
- 12.1.3.1. Company Overview
- 12.1.3.2. Products
- 12.1.3.3. Company Financials
- 12.1.3.4. SWOT Analysis
- 12.1.4 Aqua Metals Inc
- 12.1.4.1. Company Overview
- 12.1.4.2. Products
- 12.1.4.3. Company Financials
- 12.1.4.4. SWOT Analysis
- 12.1.5 Duracell Inc
- 12.1.5.1. Company Overview
- 12.1.5.2. Products
- 12.1.5.3. Company Financials
- 12.1.5.4. SWOT Analysis
- 12.1.6 AMIDT Group
- 12.1.6.1. Company Overview
- 12.1.6.2. Products
- 12.1.6.3. Company Financials
- 12.1.6.4. SWOT Analysis
- 12.1.7 Engitec Technologies SpA
- 12.1.7.1. Company Overview
- 12.1.7.2. Products
- 12.1.7.3. Company Financials
- 12.1.7.4. SWOT Analysis
- 12.1.8 Ecobat Technologies Ltd*List Not Exhaustive 6 4 Market Ranking Analysis6 5 List of Other Prominent Companie
- 12.1.8.1. Company Overview
- 12.1.8.2. Products
- 12.1.8.3. Company Financials
- 12.1.8.4. SWOT Analysis
- 12.1.1 Gravita India Ltd
- 12.2. Market Entropy
- 12.2.1 Company's Key Areas Served
- 12.2.2 Recent Developments
- 12.3. Company Market Share Analysis 2025
- 12.3.1 Top 5 Companies Market Share Analysis
- 12.3.2 Top 3 Companies Market Share Analysis
- 12.4. List of Potential Customers
- 13. Research Methodology
List of Figures
- Figure 1: Global Lead Acid Battery Scrap Market Revenue Breakdown (billion, %) by Region 2025 & 2033
- Figure 2: Global Lead Acid Battery Scrap Market Volume Breakdown (Billion, %) by Region 2025 & 2033
- Figure 3: North America Lead Acid Battery Scrap Market Revenue (billion), by Battery Type 2025 & 2033
- Figure 4: North America Lead Acid Battery Scrap Market Volume (Billion), by Battery Type 2025 & 2033
- Figure 5: North America Lead Acid Battery Scrap Market Revenue Share (%), by Battery Type 2025 & 2033
- Figure 6: North America Lead Acid Battery Scrap Market Volume Share (%), by Battery Type 2025 & 2033
- Figure 7: North America Lead Acid Battery Scrap Market Revenue (billion), by Source 2025 & 2033
- Figure 8: North America Lead Acid Battery Scrap Market Volume (Billion), by Source 2025 & 2033
- Figure 9: North America Lead Acid Battery Scrap Market Revenue Share (%), by Source 2025 & 2033
- Figure 10: North America Lead Acid Battery Scrap Market Volume Share (%), by Source 2025 & 2033
- Figure 11: North America Lead Acid Battery Scrap Market Revenue (billion), by Country 2025 & 2033
- Figure 12: North America Lead Acid Battery Scrap Market Volume (Billion), by Country 2025 & 2033
- Figure 13: North America Lead Acid Battery Scrap Market Revenue Share (%), by Country 2025 & 2033
- Figure 14: North America Lead Acid Battery Scrap Market Volume Share (%), by Country 2025 & 2033
- Figure 15: Europe Lead Acid Battery Scrap Market Revenue (billion), by Battery Type 2025 & 2033
- Figure 16: Europe Lead Acid Battery Scrap Market Volume (Billion), by Battery Type 2025 & 2033
- Figure 17: Europe Lead Acid Battery Scrap Market Revenue Share (%), by Battery Type 2025 & 2033
- Figure 18: Europe Lead Acid Battery Scrap Market Volume Share (%), by Battery Type 2025 & 2033
- Figure 19: Europe Lead Acid Battery Scrap Market Revenue (billion), by Source 2025 & 2033
- Figure 20: Europe Lead Acid Battery Scrap Market Volume (Billion), by Source 2025 & 2033
- Figure 21: Europe Lead Acid Battery Scrap Market Revenue Share (%), by Source 2025 & 2033
- Figure 22: Europe Lead Acid Battery Scrap Market Volume Share (%), by Source 2025 & 2033
- Figure 23: Europe Lead Acid Battery Scrap Market Revenue (billion), by Country 2025 & 2033
- Figure 24: Europe Lead Acid Battery Scrap Market Volume (Billion), by Country 2025 & 2033
- Figure 25: Europe Lead Acid Battery Scrap Market Revenue Share (%), by Country 2025 & 2033
- Figure 26: Europe Lead Acid Battery Scrap Market Volume Share (%), by Country 2025 & 2033
- Figure 27: Asia Pacific Lead Acid Battery Scrap Market Revenue (billion), by Battery Type 2025 & 2033
- Figure 28: Asia Pacific Lead Acid Battery Scrap Market Volume (Billion), by Battery Type 2025 & 2033
- Figure 29: Asia Pacific Lead Acid Battery Scrap Market Revenue Share (%), by Battery Type 2025 & 2033
- Figure 30: Asia Pacific Lead Acid Battery Scrap Market Volume Share (%), by Battery Type 2025 & 2033
- Figure 31: Asia Pacific Lead Acid Battery Scrap Market Revenue (billion), by Source 2025 & 2033
- Figure 32: Asia Pacific Lead Acid Battery Scrap Market Volume (Billion), by Source 2025 & 2033
- Figure 33: Asia Pacific Lead Acid Battery Scrap Market Revenue Share (%), by Source 2025 & 2033
- Figure 34: Asia Pacific Lead Acid Battery Scrap Market Volume Share (%), by Source 2025 & 2033
- Figure 35: Asia Pacific Lead Acid Battery Scrap Market Revenue (billion), by Country 2025 & 2033
- Figure 36: Asia Pacific Lead Acid Battery Scrap Market Volume (Billion), by Country 2025 & 2033
- Figure 37: Asia Pacific Lead Acid Battery Scrap Market Revenue Share (%), by Country 2025 & 2033
- Figure 38: Asia Pacific Lead Acid Battery Scrap Market Volume Share (%), by Country 2025 & 2033
- Figure 39: South America Lead Acid Battery Scrap Market Revenue (billion), by Battery Type 2025 & 2033
- Figure 40: South America Lead Acid Battery Scrap Market Volume (Billion), by Battery Type 2025 & 2033
- Figure 41: South America Lead Acid Battery Scrap Market Revenue Share (%), by Battery Type 2025 & 2033
- Figure 42: South America Lead Acid Battery Scrap Market Volume Share (%), by Battery Type 2025 & 2033
- Figure 43: South America Lead Acid Battery Scrap Market Revenue (billion), by Source 2025 & 2033
- Figure 44: South America Lead Acid Battery Scrap Market Volume (Billion), by Source 2025 & 2033
- Figure 45: South America Lead Acid Battery Scrap Market Revenue Share (%), by Source 2025 & 2033
- Figure 46: South America Lead Acid Battery Scrap Market Volume Share (%), by Source 2025 & 2033
- Figure 47: South America Lead Acid Battery Scrap Market Revenue (billion), by Country 2025 & 2033
- Figure 48: South America Lead Acid Battery Scrap Market Volume (Billion), by Country 2025 & 2033
- Figure 49: South America Lead Acid Battery Scrap Market Revenue Share (%), by Country 2025 & 2033
- Figure 50: South America Lead Acid Battery Scrap Market Volume Share (%), by Country 2025 & 2033
- Figure 51: Middle East and Africa Lead Acid Battery Scrap Market Revenue (billion), by Battery Type 2025 & 2033
- Figure 52: Middle East and Africa Lead Acid Battery Scrap Market Volume (Billion), by Battery Type 2025 & 2033
- Figure 53: Middle East and Africa Lead Acid Battery Scrap Market Revenue Share (%), by Battery Type 2025 & 2033
- Figure 54: Middle East and Africa Lead Acid Battery Scrap Market Volume Share (%), by Battery Type 2025 & 2033
- Figure 55: Middle East and Africa Lead Acid Battery Scrap Market Revenue (billion), by Source 2025 & 2033
- Figure 56: Middle East and Africa Lead Acid Battery Scrap Market Volume (Billion), by Source 2025 & 2033
- Figure 57: Middle East and Africa Lead Acid Battery Scrap Market Revenue Share (%), by Source 2025 & 2033
- Figure 58: Middle East and Africa Lead Acid Battery Scrap Market Volume Share (%), by Source 2025 & 2033
- Figure 59: Middle East and Africa Lead Acid Battery Scrap Market Revenue (billion), by Country 2025 & 2033
- Figure 60: Middle East and Africa Lead Acid Battery Scrap Market Volume (Billion), by Country 2025 & 2033
- Figure 61: Middle East and Africa Lead Acid Battery Scrap Market Revenue Share (%), by Country 2025 & 2033
- Figure 62: Middle East and Africa Lead Acid Battery Scrap Market Volume Share (%), by Country 2025 & 2033
List of Tables
- Table 1: Global Lead Acid Battery Scrap Market Revenue billion Forecast, by Battery Type 2020 & 2033
- Table 2: Global Lead Acid Battery Scrap Market Volume Billion Forecast, by Battery Type 2020 & 2033
- Table 3: Global Lead Acid Battery Scrap Market Revenue billion Forecast, by Source 2020 & 2033
- Table 4: Global Lead Acid Battery Scrap Market Volume Billion Forecast, by Source 2020 & 2033
- Table 5: Global Lead Acid Battery Scrap Market Revenue billion Forecast, by Region 2020 & 2033
- Table 6: Global Lead Acid Battery Scrap Market Volume Billion Forecast, by Region 2020 & 2033
- Table 7: Global Lead Acid Battery Scrap Market Revenue billion Forecast, by Battery Type 2020 & 2033
- Table 8: Global Lead Acid Battery Scrap Market Volume Billion Forecast, by Battery Type 2020 & 2033
- Table 9: Global Lead Acid Battery Scrap Market Revenue billion Forecast, by Source 2020 & 2033
- Table 10: Global Lead Acid Battery Scrap Market Volume Billion Forecast, by Source 2020 & 2033
- Table 11: Global Lead Acid Battery Scrap Market Revenue billion Forecast, by Country 2020 & 2033
- Table 12: Global Lead Acid Battery Scrap Market Volume Billion Forecast, by Country 2020 & 2033
- Table 13: United States Lead Acid Battery Scrap Market Revenue (billion) Forecast, by Application 2020 & 2033
- Table 14: United States Lead Acid Battery Scrap Market Volume (Billion) Forecast, by Application 2020 & 2033
- Table 15: Canada Lead Acid Battery Scrap Market Revenue (billion) Forecast, by Application 2020 & 2033
- Table 16: Canada Lead Acid Battery Scrap Market Volume (Billion) Forecast, by Application 2020 & 2033
- Table 17: Rest of North America Lead Acid Battery Scrap Market Revenue (billion) Forecast, by Application 2020 & 2033
- Table 18: Rest of North America Lead Acid Battery Scrap Market Volume (Billion) Forecast, by Application 2020 & 2033
- Table 19: Global Lead Acid Battery Scrap Market Revenue billion Forecast, by Battery Type 2020 & 2033
- Table 20: Global Lead Acid Battery Scrap Market Volume Billion Forecast, by Battery Type 2020 & 2033
- Table 21: Global Lead Acid Battery Scrap Market Revenue billion Forecast, by Source 2020 & 2033
- Table 22: Global Lead Acid Battery Scrap Market Volume Billion Forecast, by Source 2020 & 2033
- Table 23: Global Lead Acid Battery Scrap Market Revenue billion Forecast, by Country 2020 & 2033
- Table 24: Global Lead Acid Battery Scrap Market Volume Billion Forecast, by Country 2020 & 2033
- Table 25: Germany Lead Acid Battery Scrap Market Revenue (billion) Forecast, by Application 2020 & 2033
- Table 26: Germany Lead Acid Battery Scrap Market Volume (Billion) Forecast, by Application 2020 & 2033
- Table 27: France Lead Acid Battery Scrap Market Revenue (billion) Forecast, by Application 2020 & 2033
- Table 28: France Lead Acid Battery Scrap Market Volume (Billion) Forecast, by Application 2020 & 2033
- Table 29: United Kingdom Lead Acid Battery Scrap Market Revenue (billion) Forecast, by Application 2020 & 2033
- Table 30: United Kingdom Lead Acid Battery Scrap Market Volume (Billion) Forecast, by Application 2020 & 2033
- Table 31: Spain Lead Acid Battery Scrap Market Revenue (billion) Forecast, by Application 2020 & 2033
- Table 32: Spain Lead Acid Battery Scrap Market Volume (Billion) Forecast, by Application 2020 & 2033
- Table 33: NORDIC Lead Acid Battery Scrap Market Revenue (billion) Forecast, by Application 2020 & 2033
- Table 34: NORDIC Lead Acid Battery Scrap Market Volume (Billion) Forecast, by Application 2020 & 2033
- Table 35: Turkey Lead Acid Battery Scrap Market Revenue (billion) Forecast, by Application 2020 & 2033
- Table 36: Turkey Lead Acid Battery Scrap Market Volume (Billion) Forecast, by Application 2020 & 2033
- Table 37: Russia Lead Acid Battery Scrap Market Revenue (billion) Forecast, by Application 2020 & 2033
- Table 38: Russia Lead Acid Battery Scrap Market Volume (Billion) Forecast, by Application 2020 & 2033
- Table 39: Rest of Europe Lead Acid Battery Scrap Market Revenue (billion) Forecast, by Application 2020 & 2033
- Table 40: Rest of Europe Lead Acid Battery Scrap Market Volume (Billion) Forecast, by Application 2020 & 2033
- Table 41: Global Lead Acid Battery Scrap Market Revenue billion Forecast, by Battery Type 2020 & 2033
- Table 42: Global Lead Acid Battery Scrap Market Volume Billion Forecast, by Battery Type 2020 & 2033
- Table 43: Global Lead Acid Battery Scrap Market Revenue billion Forecast, by Source 2020 & 2033
- Table 44: Global Lead Acid Battery Scrap Market Volume Billion Forecast, by Source 2020 & 2033
- Table 45: Global Lead Acid Battery Scrap Market Revenue billion Forecast, by Country 2020 & 2033
- Table 46: Global Lead Acid Battery Scrap Market Volume Billion Forecast, by Country 2020 & 2033
- Table 47: China Lead Acid Battery Scrap Market Revenue (billion) Forecast, by Application 2020 & 2033
- Table 48: China Lead Acid Battery Scrap Market Volume (Billion) Forecast, by Application 2020 & 2033
- Table 49: India Lead Acid Battery Scrap Market Revenue (billion) Forecast, by Application 2020 & 2033
- Table 50: India Lead Acid Battery Scrap Market Volume (Billion) Forecast, by Application 2020 & 2033
- Table 51: Japan Lead Acid Battery Scrap Market Revenue (billion) Forecast, by Application 2020 & 2033
- Table 52: Japan Lead Acid Battery Scrap Market Volume (Billion) Forecast, by Application 2020 & 2033
- Table 53: South Korea Lead Acid Battery Scrap Market Revenue (billion) Forecast, by Application 2020 & 2033
- Table 54: South Korea Lead Acid Battery Scrap Market Volume (Billion) Forecast, by Application 2020 & 2033
- Table 55: Malaysia Lead Acid Battery Scrap Market Revenue (billion) Forecast, by Application 2020 & 2033
- Table 56: Malaysia Lead Acid Battery Scrap Market Volume (Billion) Forecast, by Application 2020 & 2033
- Table 57: Thailand Lead Acid Battery Scrap Market Revenue (billion) Forecast, by Application 2020 & 2033
- Table 58: Thailand Lead Acid Battery Scrap Market Volume (Billion) Forecast, by Application 2020 & 2033
- Table 59: Indonesia Lead Acid Battery Scrap Market Revenue (billion) Forecast, by Application 2020 & 2033
- Table 60: Indonesia Lead Acid Battery Scrap Market Volume (Billion) Forecast, by Application 2020 & 2033
- Table 61: Vietnam Lead Acid Battery Scrap Market Revenue (billion) Forecast, by Application 2020 & 2033
- Table 62: Vietnam Lead Acid Battery Scrap Market Volume (Billion) Forecast, by Application 2020 & 2033
- Table 63: Rest of Asia Pacific Lead Acid Battery Scrap Market Revenue (billion) Forecast, by Application 2020 & 2033
- Table 64: Rest of Asia Pacific Lead Acid Battery Scrap Market Volume (Billion) Forecast, by Application 2020 & 2033
- Table 65: Global Lead Acid Battery Scrap Market Revenue billion Forecast, by Battery Type 2020 & 2033
- Table 66: Global Lead Acid Battery Scrap Market Volume Billion Forecast, by Battery Type 2020 & 2033
- Table 67: Global Lead Acid Battery Scrap Market Revenue billion Forecast, by Source 2020 & 2033
- Table 68: Global Lead Acid Battery Scrap Market Volume Billion Forecast, by Source 2020 & 2033
- Table 69: Global Lead Acid Battery Scrap Market Revenue billion Forecast, by Country 2020 & 2033
- Table 70: Global Lead Acid Battery Scrap Market Volume Billion Forecast, by Country 2020 & 2033
- Table 71: Brazil Lead Acid Battery Scrap Market Revenue (billion) Forecast, by Application 2020 & 2033
- Table 72: Brazil Lead Acid Battery Scrap Market Volume (Billion) Forecast, by Application 2020 & 2033
- Table 73: Argentina Lead Acid Battery Scrap Market Revenue (billion) Forecast, by Application 2020 & 2033
- Table 74: Argentina Lead Acid Battery Scrap Market Volume (Billion) Forecast, by Application 2020 & 2033
- Table 75: Colombia Lead Acid Battery Scrap Market Revenue (billion) Forecast, by Application 2020 & 2033
- Table 76: Colombia Lead Acid Battery Scrap Market Volume (Billion) Forecast, by Application 2020 & 2033
- Table 77: Rest of South America Lead Acid Battery Scrap Market Revenue (billion) Forecast, by Application 2020 & 2033
- Table 78: Rest of South America Lead Acid Battery Scrap Market Volume (Billion) Forecast, by Application 2020 & 2033
- Table 79: Global Lead Acid Battery Scrap Market Revenue billion Forecast, by Battery Type 2020 & 2033
- Table 80: Global Lead Acid Battery Scrap Market Volume Billion Forecast, by Battery Type 2020 & 2033
- Table 81: Global Lead Acid Battery Scrap Market Revenue billion Forecast, by Source 2020 & 2033
- Table 82: Global Lead Acid Battery Scrap Market Volume Billion Forecast, by Source 2020 & 2033
- Table 83: Global Lead Acid Battery Scrap Market Revenue billion Forecast, by Country 2020 & 2033
- Table 84: Global Lead Acid Battery Scrap Market Volume Billion Forecast, by Country 2020 & 2033
- Table 85: Saudi Arabia Lead Acid Battery Scrap Market Revenue (billion) Forecast, by Application 2020 & 2033
- Table 86: Saudi Arabia Lead Acid Battery Scrap Market Volume (Billion) Forecast, by Application 2020 & 2033
- Table 87: United Arab Emirates Lead Acid Battery Scrap Market Revenue (billion) Forecast, by Application 2020 & 2033
- Table 88: United Arab Emirates Lead Acid Battery Scrap Market Volume (Billion) Forecast, by Application 2020 & 2033
- Table 89: South Africa Lead Acid Battery Scrap Market Revenue (billion) Forecast, by Application 2020 & 2033
- Table 90: South Africa Lead Acid Battery Scrap Market Volume (Billion) Forecast, by Application 2020 & 2033
- Table 91: Egypt Lead Acid Battery Scrap Market Revenue (billion) Forecast, by Application 2020 & 2033
- Table 92: Egypt Lead Acid Battery Scrap Market Volume (Billion) Forecast, by Application 2020 & 2033
- Table 93: Nigeria Lead Acid Battery Scrap Market Revenue (billion) Forecast, by Application 2020 & 2033
- Table 94: Nigeria Lead Acid Battery Scrap Market Volume (Billion) Forecast, by Application 2020 & 2033
- Table 95: Qatar Lead Acid Battery Scrap Market Revenue (billion) Forecast, by Application 2020 & 2033
- Table 96: Qatar Lead Acid Battery Scrap Market Volume (Billion) Forecast, by Application 2020 & 2033
- Table 97: Rest of Middle East and Africa Lead Acid Battery Scrap Market Revenue (billion) Forecast, by Application 2020 & 2033
- Table 98: Rest of Middle East and Africa Lead Acid Battery Scrap Market Volume (Billion) Forecast, by Application 2020 & 2033
Frequently Asked Questions
1. What is the projected Compound Annual Growth Rate (CAGR) of the Lead Acid Battery Scrap Market?
The projected CAGR is approximately 4.65%.
2. Which companies are prominent players in the Lead Acid Battery Scrap Market?
Key companies in the market include Gravita India Ltd, Enersys, Exide Industries Ltd, Aqua Metals Inc, Duracell Inc, AMIDT Group, Engitec Technologies SpA, Ecobat Technologies Ltd*List Not Exhaustive 6 4 Market Ranking Analysis6 5 List of Other Prominent Companie.
3. What are the main segments of the Lead Acid Battery Scrap Market?
The market segments include Battery Type, Source.
4. Can you provide details about the market size?
The market size is estimated to be USD 19.26 billion as of 2022.
5. What are some drivers contributing to market growth?
4.; Growing Usage of Lead Acid batteries in the Automotive Industry4.; Increasing Environmental Concerns.
6. What are the notable trends driving market growth?
Flooded Batteries to Dominate the Market.
7. Are there any restraints impacting market growth?
4.; Growing Usage of Lead Acid batteries in the Automotive Industry4.; Increasing Environmental Concerns.
8. Can you provide examples of recent developments in the market?
December 2023: Toyota and Criba Solution partnered to expand the recycling network, involving the gathering, storing, examining, and handling of batteries to support the growing electric vehicle (EV) industry. The aim was to reduce Toyota's transportation and logistics costs for used batteries by 70% while also cutting down on emissions related to transportation. Additionally, this process is expected to recover up to 95% of essential minerals.January 2023: ACE Green Recycling (ACE) and Glencore PLC (GLEN) signed a long-term supply agreement for the recycled key and lead battery metal-based end products from recycled lithium-ion batteries. This strategic partnership helps establish a circular supply chain for these high-demand materials on a global scale while minimizing their environmental footprint.
9. What pricing options are available for accessing the report?
Pricing options include single-user, multi-user, and enterprise licenses priced at USD 4750, USD 5250, and USD 8750 respectively.
10. Is the market size provided in terms of value or volume?
The market size is provided in terms of value, measured in billion and volume, measured in Billion.
11. Are there any specific market keywords associated with the report?
Yes, the market keyword associated with the report is "Lead Acid Battery Scrap Market," which aids in identifying and referencing the specific market segment covered.
12. How do I determine which pricing option suits my needs best?
The pricing options vary based on user requirements and access needs. Individual users may opt for single-user licenses, while businesses requiring broader access may choose multi-user or enterprise licenses for cost-effective access to the report.
13. Are there any additional resources or data provided in the Lead Acid Battery Scrap Market report?
While the report offers comprehensive insights, it's advisable to review the specific contents or supplementary materials provided to ascertain if additional resources or data are available.
14. How can I stay updated on further developments or reports in the Lead Acid Battery Scrap Market?
To stay informed about further developments, trends, and reports in the Lead Acid Battery Scrap Market, consider subscribing to industry newsletters, following relevant companies and organizations, or regularly checking reputable industry news sources and publications.
Methodology
Step 1 - Identification of Relevant Samples Size from Population Database


Step 2 - Approaches for Defining Global Market Size (Value, Volume* & Price*)

Note*: In applicable scenarios
Step 3 - Data Sources
Primary Research
- Web Analytics
- Survey Reports
- Research Institute
- Latest Research Reports
- Opinion Leaders
Secondary Research
- Annual Reports
- White Paper
- Latest Press Release
- Industry Association
- Paid Database
- Investor Presentations

Step 4 - Data Triangulation
Involves using different sources of information in order to increase the validity of a study
These sources are likely to be stakeholders in a program - participants, other researchers, program staff, other community members, and so on.
Then we put all data in single framework & apply various statistical tools to find out the dynamic on the market.
During the analysis stage, feedback from the stakeholder groups would be compared to determine areas of agreement as well as areas of divergence