

Key Insights
The global Levulinic Acid market is poised for significant expansion, projected to reach approximately $34.09 billion by 2025, with a robust Compound Annual Growth Rate (CAGR) of 6.08% during the forecast period of 2025-2033. This impressive growth is underpinned by the versatile applications of levulinic acid as a key platform chemical. Its ability to serve as a precursor for a wide array of derivatives, including polymers, plasticizers, pharmaceuticals, and fuel additives, positions it as a critical component in the transition towards a more sustainable and bio-based economy. The increasing demand for eco-friendly alternatives to petroleum-based chemicals is a primary catalyst, driving innovation and adoption across various end-user industries. Notably, the Cosmetics and Personal Care segment is experiencing substantial traction due to the use of levulinic acid in skincare formulations and as a preservative. Furthermore, the Pharmaceuticals sector is leveraging its therapeutic potential and its role in drug synthesis.
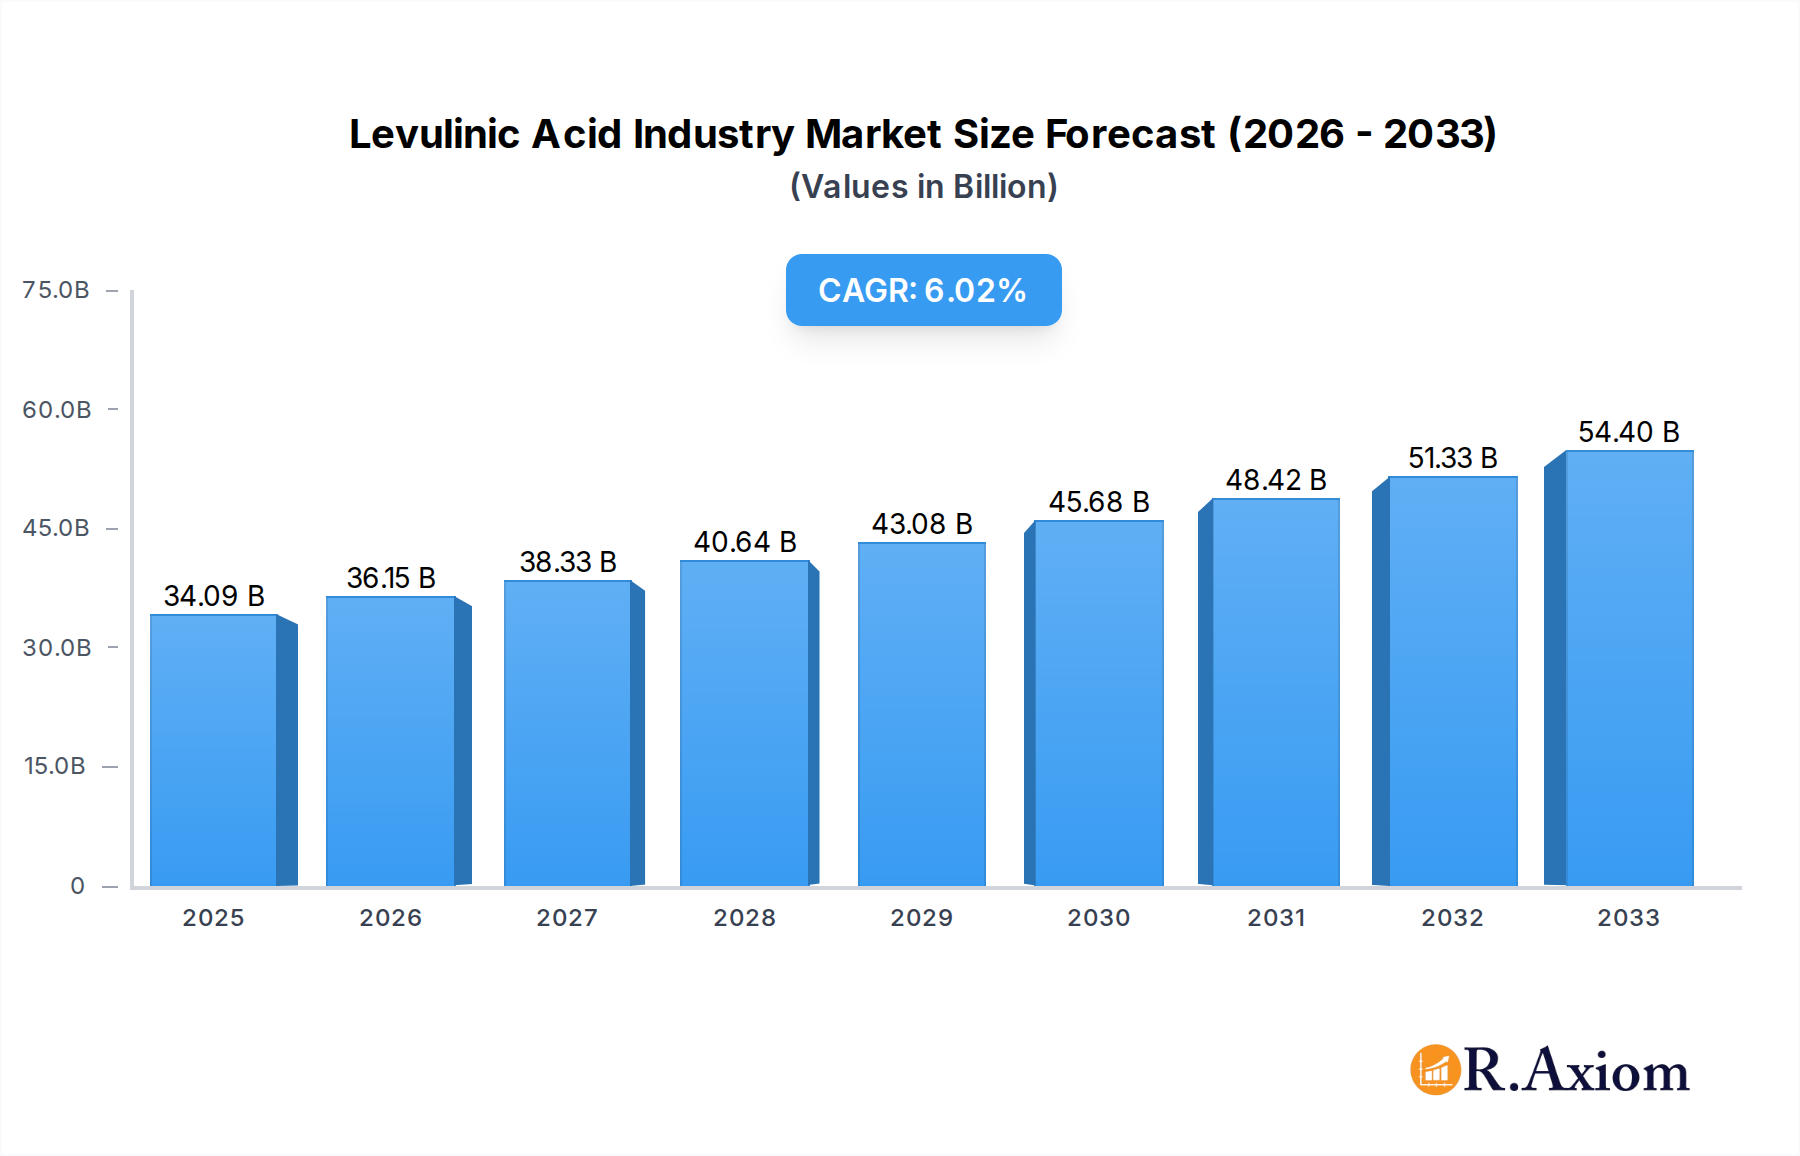
Levulinic Acid Industry Market Size (In Billion)
The market's upward trajectory is further fueled by ongoing advancements in production technologies, focusing on sustainable sourcing of biomass. Innovations in catalytic processes are enhancing the efficiency and cost-effectiveness of levulinic acid production, making it a more attractive option for manufacturers. Emerging applications in the development of advanced biofuels and bioplastics are also contributing to market momentum. Despite strong growth prospects, certain factors may influence the market dynamics. The availability and cost of biomass feedstock, coupled with the need for significant capital investment in production facilities, could present challenges. Moreover, regulatory landscapes surrounding bio-based chemicals and the competitive pricing from established petrochemical alternatives will require strategic navigation by market players. However, the overarching trend towards green chemistry and a circular economy strongly favors the expansion of the levulinic acid market.

Levulinic Acid Industry Company Market Share
This comprehensive report provides an in-depth analysis of the global Levulinic Acid industry, offering critical insights into market dynamics, growth trajectories, and future potential. Covering the historical period from 2019 to 2024, the base year of 2025, and projecting through to 2033, this study is indispensable for stakeholders seeking to understand the evolving landscape of biobased chemicals. With an estimated market size projected to reach billions by 2025 and a robust CAGR anticipated throughout the forecast period, the levulinic acid market is poised for significant expansion. The report delves into key market segments, regional dominance, and strategic initiatives by leading companies, providing actionable intelligence for strategic decision-making in this rapidly advancing sector.
Levulinic Acid Industry Market Concentration & Innovation
The Levulinic Acid industry exhibits a dynamic market concentration influenced by ongoing innovation and evolving regulatory frameworks. While currently moderately concentrated, the advent of new production technologies and a growing demand for sustainable chemicals are fostering an environment ripe for disruption. Key innovation drivers include advancements in biomass conversion efficiency, development of novel levulinic acid derivatives, and the exploration of new end-use applications. Regulatory frameworks promoting biobased products and sustainability are increasingly favorable, encouraging investment and research. Product substitutes, primarily petroleum-derived chemicals, are facing growing scrutiny, creating a significant opportunity for levulinic acid's wider adoption. End-user trends clearly favor sustainable and bio-derived materials across diverse sectors. Merger and acquisition (M&A) activities are expected to increase as companies seek to consolidate market share, acquire innovative technologies, and expand their production capacities. Estimated M&A deal values are projected to reach billions, reflecting the strategic importance of levulinic acid in the green chemistry revolution. Key players are actively investing in R&D to enhance production economics and explore novel applications.
Levulinic Acid Industry Industry Trends & Insights
The Levulinic Acid industry is experiencing a robust growth trajectory, driven by an escalating global demand for sustainable and bio-based chemical intermediates. The market is projected to witness a significant CAGR of xx% over the forecast period (2025–2033), reaching an estimated market size of billions by 2025. This expansion is underpinned by several critical trends. Firstly, the increasing environmental consciousness among consumers and stringent government regulations aimed at reducing carbon footprints are propelling the adoption of bio-based alternatives to traditional petrochemicals. Levulinic acid, derived from renewable biomass sources, perfectly aligns with these sustainability mandates, positioning it as a crucial building block for a greener chemical industry. Secondly, continuous technological advancements in biomass processing and levulinic acid synthesis are enhancing production efficiency and reducing costs, thereby improving its economic viability compared to fossil fuel-based counterparts. The development of more efficient catalysts and integrated biorefinery concepts are key technological disruptions contributing to this trend. Consumer preferences are shifting towards products with a lower environmental impact, creating a strong pull for levulinic acid-derived materials in sectors like cosmetics, pharmaceuticals, and polymers. This growing consumer demand, coupled with supportive industry initiatives, is fostering higher market penetration rates. The competitive dynamics within the industry are intensifying, with established chemical giants and agile bio-based startups vying for market leadership. Strategic partnerships, capacity expansions, and ongoing research into novel applications are shaping the competitive landscape. The exploration of levulinic acid as a platform chemical for a wide array of high-value products, including fuels, plastics, and specialty chemicals, further fuels its market significance and growth potential. The market penetration of bio-based levulinic acid is anticipated to rise significantly as its cost-competitiveness improves and a broader range of sustainable applications gain traction.
Dominant Markets & Segments in Levulinic Acid Industry
The Levulinic Acid industry is experiencing significant growth across multiple end-user industries, with a notable dominance in specific sectors. The Cosmetics and Personal Care segment stands out as a key growth engine. This dominance is fueled by increasing consumer demand for natural, sustainable, and eco-friendly ingredients. Levulinic acid and its derivatives serve as excellent humectants, preservatives, and pH adjusters in a wide range of skincare, haircare, and cosmetic formulations. The rising awareness of the environmental impact of synthetic ingredients is directly driving the adoption of bio-based alternatives like levulinic acid.
- Key Drivers for Cosmetics and Personal Care Dominance:
- Growing consumer preference for natural and organic products.
- Stringent regulations favoring bio-based and biodegradable ingredients.
- Versatility of levulinic acid in various cosmetic applications.
- Marketing advantages associated with "green" product labeling.
The Pharmaceuticals sector also represents a substantial and growing market for levulinic acid. Its utility as a building block for various pharmaceutical intermediates and active pharmaceutical ingredients (APIs) is a primary driver. Furthermore, its potential in drug delivery systems and as a component in biodegradable medical devices is being actively explored. The increasing focus on sustainable manufacturing practices within the pharmaceutical industry further bolsters the demand for bio-derived intermediates.
- Key Drivers for Pharmaceutical Segment Growth:
- Demand for bio-based precursors in API synthesis.
- Exploration of levulinic acid in novel drug delivery systems.
- Development of biodegradable medical materials.
- Emphasis on sustainable pharmaceutical manufacturing.
The Polymers and Plasticizers segment is another area of significant traction. Levulinic acid can be used to produce bio-based polymers and as a precursor for more sustainable plasticizers, offering an alternative to phthalate-based plasticizers that face regulatory restrictions and environmental concerns. The growing global impetus towards a circular economy and the reduction of plastic waste are creating a strong demand for these sustainable polymer solutions.
- Key Drivers for Polymers and Plasticizers:
- Development of bio-based polymers with improved properties.
- Replacement of traditional, environmentally concerning plasticizers.
- Growing demand for sustainable and recyclable plastics.
- Innovation in polymer chemistry utilizing bio-derived monomers.
The Fuel and Fuel Additives segment, while still developing, holds immense future potential. Levulinic acid can be converted into various fuel components and additives, including ethyl levulinate, which can be blended with gasoline. The global push towards renewable energy sources and the reduction of reliance on fossil fuels are key drivers for this segment.
- Key Drivers for Fuel and Fuel Additives:
- Government mandates for biofuels and renewable energy.
- Development of high-energy-density bio-fuels.
- Reduction of greenhouse gas emissions in the transportation sector.
The Flavors and Fragrances industry utilizes levulinic acid derivatives for their characteristic aromas. While a niche segment, the demand for natural and bio-derived flavor and fragrance compounds is steadily increasing, presenting a stable market for levulinic acid applications.
- Key Drivers for Flavors and Fragrances:
- Consumer preference for natural and authentic scents and tastes.
- Demand for sustainable sourcing of flavor and fragrance ingredients.
The Other End-user Industries encompass a diverse range of applications, including agrochemicals, coatings, adhesives, and specialty chemicals. The versatility of levulinic acid as a platform chemical allows for its integration into numerous industrial processes, contributing to its broad market appeal and sustained growth.
Levulinic Acid Industry Product Developments
Product developments in the Levulinic Acid industry are primarily focused on enhancing sustainability, improving performance, and expanding application versatility. Innovations are geared towards creating bio-based polymers with superior mechanical properties, novel bio-solvents with reduced environmental impact, and advanced formulations for cosmetics and pharmaceuticals. Competitive advantages are being carved out through higher purity grades of levulinic acid, cost-effective production methods, and the development of unique derivative compounds tailored for specific end-user needs. Technological trends emphasize the efficient conversion of biomass into high-value levulinic acid derivatives, ensuring market fit for an increasingly environmentally conscious global market.
Report Scope & Segmentation Analysis
This report meticulously segments the Levulinic Acid market by End-user Industry. The Cosmetics and Personal Care segment is projected to experience substantial growth, driven by the increasing demand for sustainable and natural ingredients, with an estimated market size of billions by 2025 and a projected CAGR of xx% through 2033. The Pharmaceuticals segment is also a significant contributor, with market size expected to reach billions, fueled by its use in API synthesis and novel drug delivery systems, forecasting a CAGR of xx%. The Polymers and Plasticizers segment is poised for robust expansion, driven by the demand for bio-based alternatives, with an estimated market size of billions and a CAGR of xx%. The Fuel and Fuel Additives segment, while currently smaller, holds immense future potential, with projected growth driven by renewable energy initiatives. The Flavors and Fragrances segment, a niche but stable market, will see steady growth driven by consumer preference for natural ingredients. The Other End-user Industries represent a diversified application landscape, contributing to overall market growth with projected figures and CAGR to be detailed within the full report.
Key Drivers of Levulinic Acid Industry Growth
The growth of the Levulinic Acid industry is propelled by a confluence of powerful technological, economic, and regulatory factors. Technologically, breakthroughs in biomass conversion efficiency and the development of cost-effective biorefinery processes are making levulinic acid a more economically viable alternative to petrochemicals. Economically, the increasing volatility of fossil fuel prices and the growing demand for sustainable products are shifting market preferences and investments towards bio-based solutions. Regulatory frameworks worldwide are increasingly favoring renewable chemicals through incentives, mandates for bio-based content, and stricter environmental regulations on traditional chemicals, creating a fertile ground for levulinic acid's expansion.
Challenges in the Levulinic Acid Industry Sector
Despite its promising outlook, the Levulinic Acid industry faces several significant challenges. Regulatory hurdles, though often supportive, can still involve complex approval processes for new applications and derivatives across different regions. Supply chain issues, particularly concerning the consistent and cost-effective sourcing of biomass feedstock, can impact production stability and pricing. Competitive pressures from established petrochemical alternatives, which benefit from decades of infrastructure and economies of scale, remain a constant challenge. Furthermore, the initial capital investment required for bio-based production facilities can be substantial, potentially limiting the pace of market penetration.
Emerging Opportunities in Levulinic Acid Industry
Emerging opportunities in the Levulinic Acid industry are multifaceted and ripe for exploitation. The continuous development of new, high-value applications for levulinic acid derivatives in advanced materials, specialty chemicals, and sustainable consumer goods presents significant potential. The expansion of biorefinery technologies that integrate levulinic acid production with other bio-based products can enhance economic feasibility and broaden market reach. Growing consumer demand for transparent and sustainable sourcing will create opportunities for companies with robust bio-based supply chains. Furthermore, policy shifts towards a circular economy and carbon neutrality will continue to drive demand for bio-based intermediates like levulinic acid.
Leading Players in the Levulinic Acid Industry Market
- GC Innovation America
- Aromalake Chemical Co Ltd
- Tokyo Chemical Industry Co Ltd
- Merck KGaA
- Bio-On SpA
- Boerchem Pharmtech Co Ltd
- Alfa Aesar Thermo Fisher Scientific
- AK Scientific Inc
- GFBiochemicals Ltd
- Ascender Chemical Co Ltd
- Summit Cosmetics Corporation
Key Developments in Levulinic Acid Industry Industry
- June 2022: GFBiochemicals agreed with German chemical giant BASF's European distribution organization, BTC Europe GmbH, on distributing biobased and biodegradable solvents derived from levulinic acid for the European market.
Strategic Outlook for Levulinic Acid Industry Market
The strategic outlook for the Levulinic Acid industry is exceptionally positive, characterized by strong growth catalysts and expanding market potential. The global shift towards a bio-economy, driven by environmental concerns and regulatory support, is the primary growth catalyst. Continued innovation in production technologies, leading to improved cost-effectiveness and purity, will further solidify levulinic acid's position. Expanding into new geographical markets and developing novel applications in emerging sectors like biodegradable packaging and advanced biofuels will unlock significant future opportunities. Investments in research and development, coupled with strategic partnerships, will be crucial for companies to capitalize on this burgeoning market.
Levulinic Acid Industry Segmentation
-
1. End-user Industry
- 1.1. Cosmetics and Personal Care
- 1.2. Pharmaceuticals
- 1.3. Polymers and Plasticizers
- 1.4. Fuel and Fuel Additives
- 1.5. Flavors and Fragrances
- 1.6. Other End-user Industries
Levulinic Acid Industry Segmentation By Geography
-
1. Asia Pacific
- 1.1. China
- 1.2. India
- 1.3. Japan
- 1.4. South Korea
- 1.5. Rest of Asia Pacific
-
2. North America
- 2.1. United States
- 2.2. Canada
- 2.3. Mexico
-
3. Europe
- 3.1. Germany
- 3.2. United Kingdom
- 3.3. France
- 3.4. Italy
- 3.5. Rest of Europe
-
4. South America
- 4.1. Brazil
- 4.2. Argentina
- 4.3. Rest of South America
-
5. Middle East and Africa
- 5.1. Saudi Arabia
- 5.2. South Africa
- 5.3. Rest of Middle East and Africa

Levulinic Acid Industry Regional Market Share
Geographic Coverage of Levulinic Acid Industry
Levulinic Acid Industry REPORT HIGHLIGHTS
| Aspects | Details |
|---|---|
| Study Period | 2020-2034 |
| Base Year | 2025 |
| Estimated Year | 2026 |
| Forecast Period | 2026-2034 |
| Historical Period | 2020-2025 |
| Growth Rate | CAGR of 9.4% from 2020-2034 |
| Segmentation |
|
Table of Contents
- 1. Introduction
- 1.1. Research Scope
- 1.2. Market Segmentation
- 1.3. Research Objective
- 1.4. Definitions and Assumptions
- 2. Executive Summary
- 2.1. Market Snapshot
- 3. Market Dynamics
- 3.1. Market Drivers
- 3.2. Market Restrains
- 3.3. Market Trends
- 3.4. Market Opportunities
- 4. Market Factor Analysis
- 4.1. Porters Five Forces
- 4.1.1. Bargaining Power of Suppliers
- 4.1.2. Bargaining Power of Buyers
- 4.1.3. Threat of New Entrants
- 4.1.4. Threat of Substitutes
- 4.1.5. Competitive Rivalry
- 4.2. PESTEL analysis
- 4.3. BCG Analysis
- 4.3.1. Stars (High Growth, High Market Share)
- 4.3.2. Cash Cows (Low Growth, High Market Share)
- 4.3.3. Question Mark (High Growth, Low Market Share)
- 4.3.4. Dogs (Low Growth, Low Market Share)
- 4.4. Ansoff Matrix Analysis
- 4.5. Supply Chain Analysis
- 4.6. Regulatory Landscape
- 4.7. Current Market Potential and Opportunity Assessment (TAM–SAM–SOM Framework)
- 4.8. RAX Analyst Note
- 4.1. Porters Five Forces
- 5. Market Analysis, Insights and Forecast 2021-2033
- 5.1. Market Analysis, Insights and Forecast - by End-user Industry
- 5.1.1. Cosmetics and Personal Care
- 5.1.2. Pharmaceuticals
- 5.1.3. Polymers and Plasticizers
- 5.1.4. Fuel and Fuel Additives
- 5.1.5. Flavors and Fragrances
- 5.1.6. Other End-user Industries
- 5.2. Market Analysis, Insights and Forecast - by Region
- 5.2.1. Asia Pacific
- 5.2.2. North America
- 5.2.3. Europe
- 5.2.4. South America
- 5.2.5. Middle East and Africa
- 5.1. Market Analysis, Insights and Forecast - by End-user Industry
- 6. Global Levulinic Acid Industry Analysis, Insights and Forecast, 2021-2033
- 6.1. Market Analysis, Insights and Forecast - by End-user Industry
- 6.1.1. Cosmetics and Personal Care
- 6.1.2. Pharmaceuticals
- 6.1.3. Polymers and Plasticizers
- 6.1.4. Fuel and Fuel Additives
- 6.1.5. Flavors and Fragrances
- 6.1.6. Other End-user Industries
- 6.1. Market Analysis, Insights and Forecast - by End-user Industry
- 7. Asia Pacific Levulinic Acid Industry Analysis, Insights and Forecast, 2020-2032
- 7.1. Market Analysis, Insights and Forecast - by End-user Industry
- 7.1.1. Cosmetics and Personal Care
- 7.1.2. Pharmaceuticals
- 7.1.3. Polymers and Plasticizers
- 7.1.4. Fuel and Fuel Additives
- 7.1.5. Flavors and Fragrances
- 7.1.6. Other End-user Industries
- 7.1. Market Analysis, Insights and Forecast - by End-user Industry
- 8. North America Levulinic Acid Industry Analysis, Insights and Forecast, 2020-2032
- 8.1. Market Analysis, Insights and Forecast - by End-user Industry
- 8.1.1. Cosmetics and Personal Care
- 8.1.2. Pharmaceuticals
- 8.1.3. Polymers and Plasticizers
- 8.1.4. Fuel and Fuel Additives
- 8.1.5. Flavors and Fragrances
- 8.1.6. Other End-user Industries
- 8.1. Market Analysis, Insights and Forecast - by End-user Industry
- 9. Europe Levulinic Acid Industry Analysis, Insights and Forecast, 2020-2032
- 9.1. Market Analysis, Insights and Forecast - by End-user Industry
- 9.1.1. Cosmetics and Personal Care
- 9.1.2. Pharmaceuticals
- 9.1.3. Polymers and Plasticizers
- 9.1.4. Fuel and Fuel Additives
- 9.1.5. Flavors and Fragrances
- 9.1.6. Other End-user Industries
- 9.1. Market Analysis, Insights and Forecast - by End-user Industry
- 10. South America Levulinic Acid Industry Analysis, Insights and Forecast, 2020-2032
- 10.1. Market Analysis, Insights and Forecast - by End-user Industry
- 10.1.1. Cosmetics and Personal Care
- 10.1.2. Pharmaceuticals
- 10.1.3. Polymers and Plasticizers
- 10.1.4. Fuel and Fuel Additives
- 10.1.5. Flavors and Fragrances
- 10.1.6. Other End-user Industries
- 10.1. Market Analysis, Insights and Forecast - by End-user Industry
- 11. Middle East and Africa Levulinic Acid Industry Analysis, Insights and Forecast, 2020-2032
- 11.1. Market Analysis, Insights and Forecast - by End-user Industry
- 11.1.1. Cosmetics and Personal Care
- 11.1.2. Pharmaceuticals
- 11.1.3. Polymers and Plasticizers
- 11.1.4. Fuel and Fuel Additives
- 11.1.5. Flavors and Fragrances
- 11.1.6. Other End-user Industries
- 11.1. Market Analysis, Insights and Forecast - by End-user Industry
- 12. Competitive Analysis
- 12.1. Company Profiles
- 12.1.1 GC Innovation America
- 12.1.1.1. Company Overview
- 12.1.1.2. Products
- 12.1.1.3. Company Financials
- 12.1.1.4. SWOT Analysis
- 12.1.2 Aromalake Chemical Co Ltd
- 12.1.2.1. Company Overview
- 12.1.2.2. Products
- 12.1.2.3. Company Financials
- 12.1.2.4. SWOT Analysis
- 12.1.3 Tokyo Chemical Industry Co Ltd*List Not Exhaustive
- 12.1.3.1. Company Overview
- 12.1.3.2. Products
- 12.1.3.3. Company Financials
- 12.1.3.4. SWOT Analysis
- 12.1.4 Merck KGaA
- 12.1.4.1. Company Overview
- 12.1.4.2. Products
- 12.1.4.3. Company Financials
- 12.1.4.4. SWOT Analysis
- 12.1.5 Bio-On SpA
- 12.1.5.1. Company Overview
- 12.1.5.2. Products
- 12.1.5.3. Company Financials
- 12.1.5.4. SWOT Analysis
- 12.1.6 Boerchem Pharmtech Co Ltd
- 12.1.6.1. Company Overview
- 12.1.6.2. Products
- 12.1.6.3. Company Financials
- 12.1.6.4. SWOT Analysis
- 12.1.7 Alfa Aesar Thermo Fisher Scientific
- 12.1.7.1. Company Overview
- 12.1.7.2. Products
- 12.1.7.3. Company Financials
- 12.1.7.4. SWOT Analysis
- 12.1.8 AK Scientific Inc
- 12.1.8.1. Company Overview
- 12.1.8.2. Products
- 12.1.8.3. Company Financials
- 12.1.8.4. SWOT Analysis
- 12.1.9 GFBiochemicals Ltd
- 12.1.9.1. Company Overview
- 12.1.9.2. Products
- 12.1.9.3. Company Financials
- 12.1.9.4. SWOT Analysis
- 12.1.10 Ascender Chemical Co Ltd
- 12.1.10.1. Company Overview
- 12.1.10.2. Products
- 12.1.10.3. Company Financials
- 12.1.10.4. SWOT Analysis
- 12.1.11 Summit Cosmetics Corporation
- 12.1.11.1. Company Overview
- 12.1.11.2. Products
- 12.1.11.3. Company Financials
- 12.1.11.4. SWOT Analysis
- 12.1.1 GC Innovation America
- 12.2. Market Entropy
- 12.2.1 Company's Key Areas Served
- 12.2.2 Recent Developments
- 12.3. Company Market Share Analysis 2025
- 12.3.1 Top 5 Companies Market Share Analysis
- 12.3.2 Top 3 Companies Market Share Analysis
- 12.4. List of Potential Customers
- 13. Research Methodology
List of Figures
- Figure 1: Global Levulinic Acid Industry Revenue Breakdown (million, %) by Region 2025 & 2033
- Figure 2: Global Levulinic Acid Industry Volume Breakdown (kilotons, %) by Region 2025 & 2033
- Figure 3: Asia Pacific Levulinic Acid Industry Revenue (million), by End-user Industry 2025 & 2033
- Figure 4: Asia Pacific Levulinic Acid Industry Volume (kilotons), by End-user Industry 2025 & 2033
- Figure 5: Asia Pacific Levulinic Acid Industry Revenue Share (%), by End-user Industry 2025 & 2033
- Figure 6: Asia Pacific Levulinic Acid Industry Volume Share (%), by End-user Industry 2025 & 2033
- Figure 7: Asia Pacific Levulinic Acid Industry Revenue (million), by Country 2025 & 2033
- Figure 8: Asia Pacific Levulinic Acid Industry Volume (kilotons), by Country 2025 & 2033
- Figure 9: Asia Pacific Levulinic Acid Industry Revenue Share (%), by Country 2025 & 2033
- Figure 10: Asia Pacific Levulinic Acid Industry Volume Share (%), by Country 2025 & 2033
- Figure 11: North America Levulinic Acid Industry Revenue (million), by End-user Industry 2025 & 2033
- Figure 12: North America Levulinic Acid Industry Volume (kilotons), by End-user Industry 2025 & 2033
- Figure 13: North America Levulinic Acid Industry Revenue Share (%), by End-user Industry 2025 & 2033
- Figure 14: North America Levulinic Acid Industry Volume Share (%), by End-user Industry 2025 & 2033
- Figure 15: North America Levulinic Acid Industry Revenue (million), by Country 2025 & 2033
- Figure 16: North America Levulinic Acid Industry Volume (kilotons), by Country 2025 & 2033
- Figure 17: North America Levulinic Acid Industry Revenue Share (%), by Country 2025 & 2033
- Figure 18: North America Levulinic Acid Industry Volume Share (%), by Country 2025 & 2033
- Figure 19: Europe Levulinic Acid Industry Revenue (million), by End-user Industry 2025 & 2033
- Figure 20: Europe Levulinic Acid Industry Volume (kilotons), by End-user Industry 2025 & 2033
- Figure 21: Europe Levulinic Acid Industry Revenue Share (%), by End-user Industry 2025 & 2033
- Figure 22: Europe Levulinic Acid Industry Volume Share (%), by End-user Industry 2025 & 2033
- Figure 23: Europe Levulinic Acid Industry Revenue (million), by Country 2025 & 2033
- Figure 24: Europe Levulinic Acid Industry Volume (kilotons), by Country 2025 & 2033
- Figure 25: Europe Levulinic Acid Industry Revenue Share (%), by Country 2025 & 2033
- Figure 26: Europe Levulinic Acid Industry Volume Share (%), by Country 2025 & 2033
- Figure 27: South America Levulinic Acid Industry Revenue (million), by End-user Industry 2025 & 2033
- Figure 28: South America Levulinic Acid Industry Volume (kilotons), by End-user Industry 2025 & 2033
- Figure 29: South America Levulinic Acid Industry Revenue Share (%), by End-user Industry 2025 & 2033
- Figure 30: South America Levulinic Acid Industry Volume Share (%), by End-user Industry 2025 & 2033
- Figure 31: South America Levulinic Acid Industry Revenue (million), by Country 2025 & 2033
- Figure 32: South America Levulinic Acid Industry Volume (kilotons), by Country 2025 & 2033
- Figure 33: South America Levulinic Acid Industry Revenue Share (%), by Country 2025 & 2033
- Figure 34: South America Levulinic Acid Industry Volume Share (%), by Country 2025 & 2033
- Figure 35: Middle East and Africa Levulinic Acid Industry Revenue (million), by End-user Industry 2025 & 2033
- Figure 36: Middle East and Africa Levulinic Acid Industry Volume (kilotons), by End-user Industry 2025 & 2033
- Figure 37: Middle East and Africa Levulinic Acid Industry Revenue Share (%), by End-user Industry 2025 & 2033
- Figure 38: Middle East and Africa Levulinic Acid Industry Volume Share (%), by End-user Industry 2025 & 2033
- Figure 39: Middle East and Africa Levulinic Acid Industry Revenue (million), by Country 2025 & 2033
- Figure 40: Middle East and Africa Levulinic Acid Industry Volume (kilotons), by Country 2025 & 2033
- Figure 41: Middle East and Africa Levulinic Acid Industry Revenue Share (%), by Country 2025 & 2033
- Figure 42: Middle East and Africa Levulinic Acid Industry Volume Share (%), by Country 2025 & 2033
List of Tables
- Table 1: Global Levulinic Acid Industry Revenue million Forecast, by End-user Industry 2020 & 2033
- Table 2: Global Levulinic Acid Industry Volume kilotons Forecast, by End-user Industry 2020 & 2033
- Table 3: Global Levulinic Acid Industry Revenue million Forecast, by Region 2020 & 2033
- Table 4: Global Levulinic Acid Industry Volume kilotons Forecast, by Region 2020 & 2033
- Table 5: Global Levulinic Acid Industry Revenue million Forecast, by End-user Industry 2020 & 2033
- Table 6: Global Levulinic Acid Industry Volume kilotons Forecast, by End-user Industry 2020 & 2033
- Table 7: Global Levulinic Acid Industry Revenue million Forecast, by Country 2020 & 2033
- Table 8: Global Levulinic Acid Industry Volume kilotons Forecast, by Country 2020 & 2033
- Table 9: China Levulinic Acid Industry Revenue (million) Forecast, by Application 2020 & 2033
- Table 10: China Levulinic Acid Industry Volume (kilotons) Forecast, by Application 2020 & 2033
- Table 11: India Levulinic Acid Industry Revenue (million) Forecast, by Application 2020 & 2033
- Table 12: India Levulinic Acid Industry Volume (kilotons) Forecast, by Application 2020 & 2033
- Table 13: Japan Levulinic Acid Industry Revenue (million) Forecast, by Application 2020 & 2033
- Table 14: Japan Levulinic Acid Industry Volume (kilotons) Forecast, by Application 2020 & 2033
- Table 15: South Korea Levulinic Acid Industry Revenue (million) Forecast, by Application 2020 & 2033
- Table 16: South Korea Levulinic Acid Industry Volume (kilotons) Forecast, by Application 2020 & 2033
- Table 17: Rest of Asia Pacific Levulinic Acid Industry Revenue (million) Forecast, by Application 2020 & 2033
- Table 18: Rest of Asia Pacific Levulinic Acid Industry Volume (kilotons) Forecast, by Application 2020 & 2033
- Table 19: Global Levulinic Acid Industry Revenue million Forecast, by End-user Industry 2020 & 2033
- Table 20: Global Levulinic Acid Industry Volume kilotons Forecast, by End-user Industry 2020 & 2033
- Table 21: Global Levulinic Acid Industry Revenue million Forecast, by Country 2020 & 2033
- Table 22: Global Levulinic Acid Industry Volume kilotons Forecast, by Country 2020 & 2033
- Table 23: United States Levulinic Acid Industry Revenue (million) Forecast, by Application 2020 & 2033
- Table 24: United States Levulinic Acid Industry Volume (kilotons) Forecast, by Application 2020 & 2033
- Table 25: Canada Levulinic Acid Industry Revenue (million) Forecast, by Application 2020 & 2033
- Table 26: Canada Levulinic Acid Industry Volume (kilotons) Forecast, by Application 2020 & 2033
- Table 27: Mexico Levulinic Acid Industry Revenue (million) Forecast, by Application 2020 & 2033
- Table 28: Mexico Levulinic Acid Industry Volume (kilotons) Forecast, by Application 2020 & 2033
- Table 29: Global Levulinic Acid Industry Revenue million Forecast, by End-user Industry 2020 & 2033
- Table 30: Global Levulinic Acid Industry Volume kilotons Forecast, by End-user Industry 2020 & 2033
- Table 31: Global Levulinic Acid Industry Revenue million Forecast, by Country 2020 & 2033
- Table 32: Global Levulinic Acid Industry Volume kilotons Forecast, by Country 2020 & 2033
- Table 33: Germany Levulinic Acid Industry Revenue (million) Forecast, by Application 2020 & 2033
- Table 34: Germany Levulinic Acid Industry Volume (kilotons) Forecast, by Application 2020 & 2033
- Table 35: United Kingdom Levulinic Acid Industry Revenue (million) Forecast, by Application 2020 & 2033
- Table 36: United Kingdom Levulinic Acid Industry Volume (kilotons) Forecast, by Application 2020 & 2033
- Table 37: France Levulinic Acid Industry Revenue (million) Forecast, by Application 2020 & 2033
- Table 38: France Levulinic Acid Industry Volume (kilotons) Forecast, by Application 2020 & 2033
- Table 39: Italy Levulinic Acid Industry Revenue (million) Forecast, by Application 2020 & 2033
- Table 40: Italy Levulinic Acid Industry Volume (kilotons) Forecast, by Application 2020 & 2033
- Table 41: Rest of Europe Levulinic Acid Industry Revenue (million) Forecast, by Application 2020 & 2033
- Table 42: Rest of Europe Levulinic Acid Industry Volume (kilotons) Forecast, by Application 2020 & 2033
- Table 43: Global Levulinic Acid Industry Revenue million Forecast, by End-user Industry 2020 & 2033
- Table 44: Global Levulinic Acid Industry Volume kilotons Forecast, by End-user Industry 2020 & 2033
- Table 45: Global Levulinic Acid Industry Revenue million Forecast, by Country 2020 & 2033
- Table 46: Global Levulinic Acid Industry Volume kilotons Forecast, by Country 2020 & 2033
- Table 47: Brazil Levulinic Acid Industry Revenue (million) Forecast, by Application 2020 & 2033
- Table 48: Brazil Levulinic Acid Industry Volume (kilotons) Forecast, by Application 2020 & 2033
- Table 49: Argentina Levulinic Acid Industry Revenue (million) Forecast, by Application 2020 & 2033
- Table 50: Argentina Levulinic Acid Industry Volume (kilotons) Forecast, by Application 2020 & 2033
- Table 51: Rest of South America Levulinic Acid Industry Revenue (million) Forecast, by Application 2020 & 2033
- Table 52: Rest of South America Levulinic Acid Industry Volume (kilotons) Forecast, by Application 2020 & 2033
- Table 53: Global Levulinic Acid Industry Revenue million Forecast, by End-user Industry 2020 & 2033
- Table 54: Global Levulinic Acid Industry Volume kilotons Forecast, by End-user Industry 2020 & 2033
- Table 55: Global Levulinic Acid Industry Revenue million Forecast, by Country 2020 & 2033
- Table 56: Global Levulinic Acid Industry Volume kilotons Forecast, by Country 2020 & 2033
- Table 57: Saudi Arabia Levulinic Acid Industry Revenue (million) Forecast, by Application 2020 & 2033
- Table 58: Saudi Arabia Levulinic Acid Industry Volume (kilotons) Forecast, by Application 2020 & 2033
- Table 59: South Africa Levulinic Acid Industry Revenue (million) Forecast, by Application 2020 & 2033
- Table 60: South Africa Levulinic Acid Industry Volume (kilotons) Forecast, by Application 2020 & 2033
- Table 61: Rest of Middle East and Africa Levulinic Acid Industry Revenue (million) Forecast, by Application 2020 & 2033
- Table 62: Rest of Middle East and Africa Levulinic Acid Industry Volume (kilotons) Forecast, by Application 2020 & 2033
Frequently Asked Questions
1. What is the projected Compound Annual Growth Rate (CAGR) of the Levulinic Acid Industry?
The projected CAGR is approximately 9.4%.
2. Which companies are prominent players in the Levulinic Acid Industry?
Key companies in the market include GC Innovation America, Aromalake Chemical Co Ltd, Tokyo Chemical Industry Co Ltd*List Not Exhaustive, Merck KGaA, Bio-On SpA, Boerchem Pharmtech Co Ltd, Alfa Aesar Thermo Fisher Scientific, AK Scientific Inc, GFBiochemicals Ltd, Ascender Chemical Co Ltd, Summit Cosmetics Corporation.
3. What are the main segments of the Levulinic Acid Industry?
The market segments include End-user Industry.
4. Can you provide details about the market size?
The market size is estimated to be USD 80 million as of 2022.
5. What are some drivers contributing to market growth?
Increasing Usage as a Substitute for Traditional Fertilizer; Other Drivers.
6. What are the notable trends driving market growth?
Cosmetics and Personal Care to Dominate the Market.
7. Are there any restraints impacting market growth?
Unfavorable Conditions Arising Due to the COVID-19 Impact.
8. Can you provide examples of recent developments in the market?
June 2022: GFBiochemicals agreed with German chemical giant BASF's European distribution organization, BTC Europe GmbH, on distributing biobased and biodegradable solvents derived from levulinic acid for the European market.
9. What pricing options are available for accessing the report?
Pricing options include single-user, multi-user, and enterprise licenses priced at USD 4750, USD 5250, and USD 8750 respectively.
10. Is the market size provided in terms of value or volume?
The market size is provided in terms of value, measured in million and volume, measured in kilotons.
11. Are there any specific market keywords associated with the report?
Yes, the market keyword associated with the report is "Levulinic Acid Industry," which aids in identifying and referencing the specific market segment covered.
12. How do I determine which pricing option suits my needs best?
The pricing options vary based on user requirements and access needs. Individual users may opt for single-user licenses, while businesses requiring broader access may choose multi-user or enterprise licenses for cost-effective access to the report.
13. Are there any additional resources or data provided in the Levulinic Acid Industry report?
While the report offers comprehensive insights, it's advisable to review the specific contents or supplementary materials provided to ascertain if additional resources or data are available.
14. How can I stay updated on further developments or reports in the Levulinic Acid Industry?
To stay informed about further developments, trends, and reports in the Levulinic Acid Industry, consider subscribing to industry newsletters, following relevant companies and organizations, or regularly checking reputable industry news sources and publications.
Methodology
Step 1 - Identification of Relevant Samples Size from Population Database


Step 2 - Approaches for Defining Global Market Size (Value, Volume* & Price*)

Note*: In applicable scenarios
Step 3 - Data Sources
Primary Research
- Web Analytics
- Survey Reports
- Research Institute
- Latest Research Reports
- Opinion Leaders
Secondary Research
- Annual Reports
- White Paper
- Latest Press Release
- Industry Association
- Paid Database
- Investor Presentations

Step 4 - Data Triangulation
Involves using different sources of information in order to increase the validity of a study
These sources are likely to be stakeholders in a program - participants, other researchers, program staff, other community members, and so on.
Then we put all data in single framework & apply various statistical tools to find out the dynamic on the market.
During the analysis stage, feedback from the stakeholder groups would be compared to determine areas of agreement as well as areas of divergence