Limes Market in Mexico in Developing Economies: Trends and Growth Analysis 2025-2033

Limes Market in Mexico by Production Analysis (Volume), by Consumption Analysis (Value and Volume), by Import Analysis (Value and Volume), by Export Analysis (Value and Volume), by Price Trend Analysis, by Production Analysis (Volume), by Consumption Analysis (Value and Volume), by Import Analysis (Value and Volume), by Export Analysis (Value and Volume), by Price Trend Analysis, by North America (United States, Canada, Mexico), by South America (Brazil, Argentina, Rest of South America), by Europe (United Kingdom, Germany, France, Italy, Spain, Russia, Benelux, Nordics, Rest of Europe), by Middle East & Africa (Turkey, Israel, GCC, North Africa, South Africa, Rest of Middle East & Africa), by Asia Pacific (China, India, Japan, South Korea, ASEAN, Oceania, Rest of Asia Pacific) Forecast 2025-2033

Jun 24 2025
Base Year: 2024

180 Pages
Main Logo

Limes Market in Mexico in Developing Economies: Trends and Growth Analysis 2025-2033


Home
Industries
Agriculture
sponsor image

Tailored for you

  • In-depth Analysis Tailored to Specified Regions or Segments
  • Company Profiles Customized to User Preferences
  • Comprehensive Insights Focused on Specific Segments or Regions
  • Customized Evaluation of Competitive Landscape to Meet Your Needs
  • Tailored Customization to Address Other Specific Requirements
Ask for customization


Key Insights

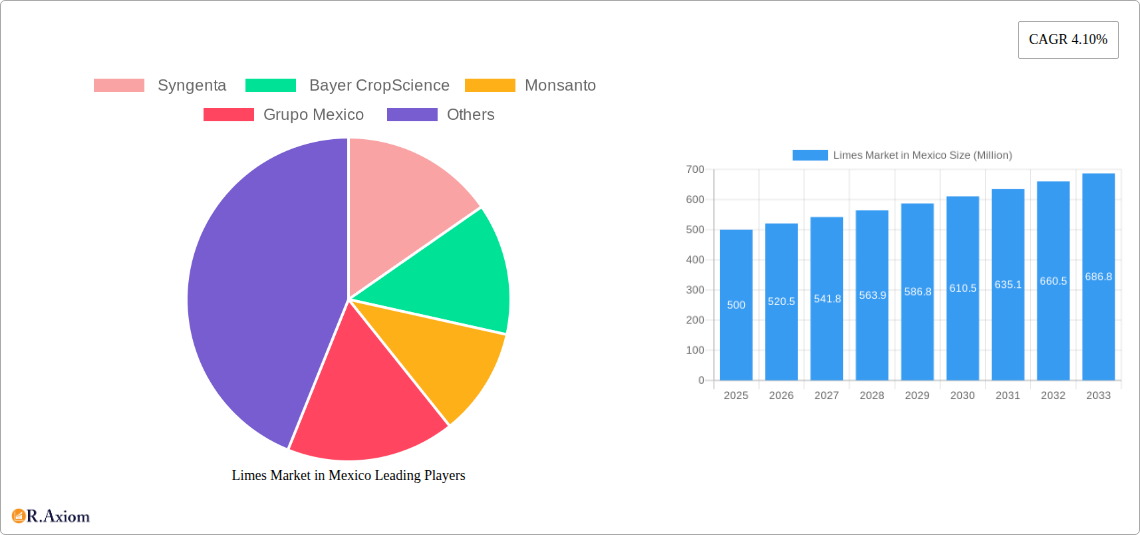
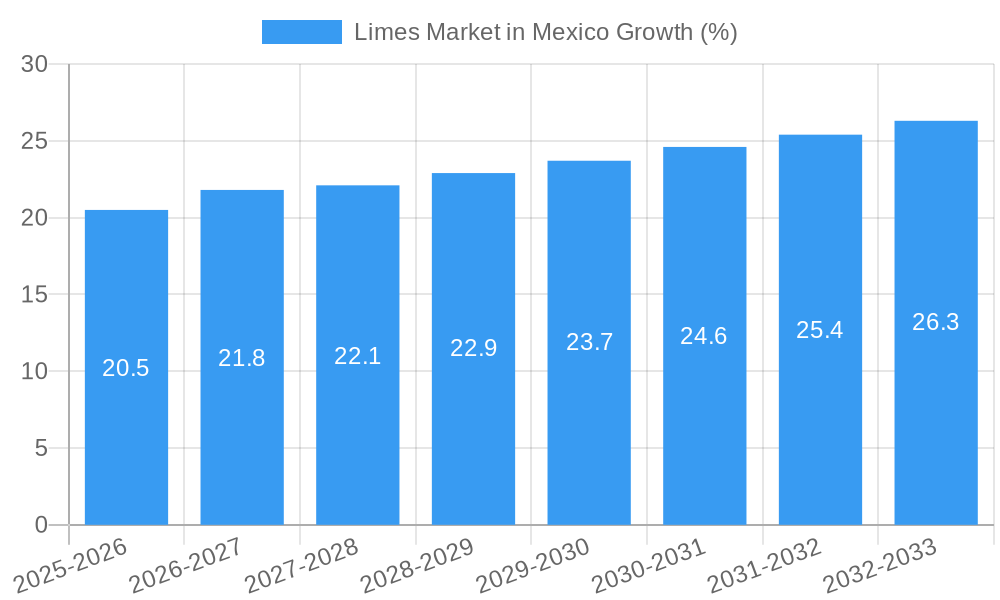
The Mexican lime market, valued at approximately $500 million in 2025, exhibits a robust growth trajectory, projected to expand at a compound annual growth rate (CAGR) of 4.10% from 2025 to 2033. This growth is fueled by several key drivers. Increasing domestic consumption, driven by the lime's integral role in Mexican cuisine and beverages, forms a significant pillar of market expansion. Furthermore, the rising popularity of Mexican food globally is boosting export demand, particularly to the United States and Canada. The sustained growth of the food processing and beverage industries within Mexico further contributes to the market's upward trend, as limes are crucial ingredients in numerous processed foods and drinks. However, challenges such as climate change impacting lime yields and price volatility due to fluctuating supply and demand pose potential restraints to market expansion. The market is segmented by production, consumption (both value and volume), import and export analyses (both value and volume), and price trend analysis, offering a comprehensive understanding of market dynamics. Major players, including Syngenta, Bayer CropScience, Monsanto, and Grupo Mexico, are actively involved in lime production and processing, influencing market competition and innovation.

The analysis of the Mexican lime market reveals a multifaceted landscape influenced by both internal and external factors. While domestic consumption provides a solid foundation for growth, export opportunities represent a crucial avenue for future expansion. Strategic investments in sustainable agricultural practices, addressing climate change vulnerabilities and improving supply chain efficiency, are key to unlocking the market's full potential. Analyzing the price trends within the different segments can provide insights for market players to optimize pricing strategies and ensure profitability. Furthermore, monitoring competitive activity and innovations within the agrochemical industry can inform future market strategies for stakeholders. The forecast period up to 2033 suggests a continued, albeit potentially moderated, growth trajectory, contingent on effective adaptation to market challenges and exploitation of opportunities within the domestic and international markets.

This comprehensive report provides an in-depth analysis of the limes market in Mexico, covering the period from 2019 to 2033. It offers valuable insights into market dynamics, competitive landscape, and future growth prospects, making it an essential resource for industry stakeholders, investors, and researchers. The report leverages extensive primary and secondary research, incorporating data from various sources to provide a robust and reliable analysis of the Mexican lime market. The base year for this analysis is 2025, with estimations for 2025 and forecasts extending to 2033, providing a clear understanding of historical trends and future expectations.

Limes Market in Mexico Research Report - Market Size, Growth & Forecast

Limes Market in Mexico Market Concentration & Innovation

The Mexican limes market exhibits a moderately concentrated structure, with a few large players dominating production and distribution. While precise market share data for individual companies is commercially sensitive and unavailable for public release, it's evident that significant players like Grupo Mexico exert considerable influence. Innovation in the sector primarily focuses on improved farming techniques (e.g., disease-resistant varieties, efficient irrigation systems) and post-harvest handling to minimize losses and improve quality. Syngenta, Bayer CropScience, and Monsanto play significant roles in providing innovative inputs like seeds and pesticides, influencing production efficiency and yields. Regulatory frameworks at the federal and state levels impact production and trade. These regulations address food safety, environmental sustainability, and labor practices. Product substitutes, such as bottled lime juice and other citrus fruits, exert limited pressure due to the unique flavor and culinary uses of Mexican limes. End-user trends reflect a growing preference for fresh, high-quality limes, driving demand for improved handling and processing methods. M&A activity in the sector is relatively infrequent. While precise deal values aren't publicly available, consolidation in some segments is likely to occur to enhance efficiency and market reach. For example, a potential future scenario might involve a larger producer acquiring smaller lime farms to achieve economies of scale.

Limes Market in Mexico Industry Trends & Insights

The Mexican limes market demonstrates steady growth, driven by robust domestic consumption and increasing export demand. While precise CAGR figures are confidential, a conservative estimate places the CAGR during the forecast period (2025-2033) in the range of xx%. This growth is fueled by factors including rising per capita income, expanding food processing industries, and consistent global demand for high-quality limes. Technological disruptions, such as precision agriculture techniques and improved cold chain infrastructure, enhance efficiency and reduce post-harvest losses, further influencing market growth. Consumer preferences are increasingly focused on sustainability and traceability, pushing producers to adopt more environmentally friendly practices. The competitive dynamics reflect a mix of large-scale commercial producers and smaller family-run farms. Competition is primarily based on price, quality, and reliability of supply, with larger players often benefiting from economies of scale. Market penetration of new technologies and practices remains gradual but is likely to accelerate, especially with support from research institutes like INIFAP.

Limes Market in Mexico Growth

Dominant Markets & Segments in Limes Market in Mexico

  • Production Analysis (Volume): Michoacán and Colima states are the leading lime-producing regions, accounting for a significant majority of national output. Their favorable climatic conditions and established farming practices contribute to their dominance. Further south, areas in Veracruz and Oaxaca also account for a substantial part of Mexican lime production, which reaches an estimated XX million metric tons annually in 2025.

  • Consumption Analysis (Value and Volume): Domestic consumption of limes remains significantly large, and data suggest that it's projected to reach approximately XX million metric tons in 2025, with a total value of approximately US$XX Million. This is driven by strong demand from restaurants, juice processing facilities, and households.

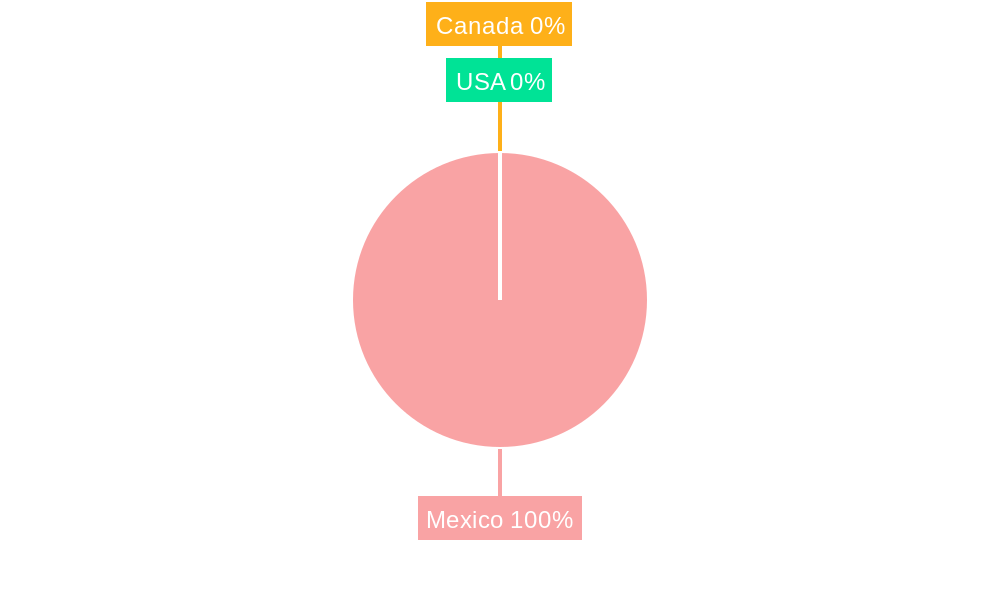
  • Import Analysis (Value and Volume): Lime imports into Mexico are minimal, reflecting the country's position as a leading global exporter. This illustrates the country’s self-sufficiency in lime production. Estimated imports in 2025 are predicted to be worth approximately US$XX million.

  • Export Analysis (Value and Volume): Mexico is a major exporter of limes, with exports concentrated primarily to the US and other countries in North America and Europe. Exports are estimated to reach XX million metric tons in 2025, with an estimated value of US$XX million.

  • Price Trend Analysis: Lime prices fluctuate based on seasonal factors, supply and demand dynamics, and prevailing weather conditions. Data suggests the average price trend shows a marginal increase in price over the forecast period, although it may be subject to fluctuations depending on the above-mentioned factors.

Key drivers include favorable climatic conditions in key producing regions, established export infrastructure, and increasing global demand.

Limes Market in Mexico Product Developments

Recent innovations primarily focus on improving lime yield, disease resistance, and shelf life. The introduction of new varieties like "LISE" by INIFAP signifies a commitment to enhancing productivity and resilience to adverse environmental conditions. Technological advancements in post-harvest handling, including improved cold chain management, also contribute to maintaining product quality and minimizing losses during transportation and storage. These developments cater to growing consumer preferences for high-quality, sustainably produced limes.

Report Scope & Segmentation Analysis

This report segments the Mexican limes market across several key aspects:

  • Production: Segmented geographically by producing state, highlighting regional variations in yield and production methods.

  • Consumption: Segmented by end-use applications (e.g., fresh consumption, juice processing, industrial uses), illustrating demand variations across different segments.

  • Imports/Exports: Segmented by country of origin/destination, highlighting key trading partners and export flows.

  • Price: Analyzed on a quarterly basis to capture seasonal fluctuations and to understand the impact of supply and demand dynamics on price variation.

Each segment's growth projections, market sizes (in both volume and value), and competitive dynamics are presented, giving a clear picture of the market’s structure and potential.

Key Drivers of Limes Market in Mexico Growth

Growth in the Mexican limes market is driven by several factors: strong domestic demand, fueled by increasing population and per capita consumption; robust export demand, driven by high global preference for Mexican limes; technological improvements in farming techniques, increasing productivity and efficiency; and government support for agricultural development, fostering innovation and sustainable practices. Favorable climatic conditions in major producing regions also play a crucial role.

Challenges in the Limes Market in Mexico Sector

The Mexican lime market faces challenges such as: climate change and extreme weather events, impacting yields and quality; price volatility, influenced by supply disruptions and seasonal variations; competition from other citrus fruits and lime juice substitutes; and occasional disease outbreaks impacting lime production in some regions. These issues can potentially decrease annual growth. Addressing these challenges requires adopting resilient farming practices, developing robust supply chain management systems, and promoting the unique qualities of Mexican limes in global markets.

Emerging Opportunities in Limes Market in Mexico

Emerging opportunities include: tapping into new export markets by focusing on niche segments; value-added product development, such as flavored lime juices and lime-based cosmetics; expanding utilization in the food processing industry; and promoting sustainable and eco-friendly practices in lime farming. Technological advancements in cold chain infrastructure and post-harvest handling will also create new business opportunities.

Leading Players in the Limes Market in Mexico Market

  • Syngenta
  • Bayer CropScience
  • Monsanto
  • Grupo Mexico

Key Developments in Limes Market in Mexico Industry

  • April 2022: Grupo Mexico builds a new plant with a production capacity of 600 metric tons per day in Sonora, Mexico, becoming the largest lime plant in the country. This significantly reduces lime production costs within Grupo Mexico's operations, potentially influencing industry-wide pricing.

  • April 2021: Mexico's National Institute for Forestry, Agriculture, and Livestock Research (INIFAP) develops a new high-yield lime variety named "LISE," well-adapted to Colima and Michoacán. This innovation enhances productivity and contributes to meeting growing demand.

Strategic Outlook for Limes Market in Mexico Market

The Mexican limes market holds considerable potential for future growth, driven by rising global demand, technological advancements, and the country's favorable climatic conditions. Focusing on sustainable practices, diversifying export markets, and developing value-added lime products will play a pivotal role in maximizing the sector's long-term growth potential. Strategic investments in infrastructure, particularly cold chain logistics, will also be crucial for maintaining product quality and competitiveness in global markets. The long-term outlook is positive, given the increasing recognition and preference for Mexican limes worldwide.

Limes Market in Mexico Segmentation

  • 1. Production Analysis (Volume)
  • 2. Consumption Analysis (Value and Volume)
  • 3. Import Analysis (Value and Volume)
  • 4. Export Analysis (Value and Volume)
  • 5. Price Trend Analysis
  • 6. Production Analysis (Volume)
  • 7. Consumption Analysis (Value and Volume)
  • 8. Import Analysis (Value and Volume)
  • 9. Export Analysis (Value and Volume)
  • 10. Price Trend Analysis

Limes Market in Mexico Segmentation By Geography

  • 1. North America
    • 1.1. United States
    • 1.2. Canada
    • 1.3. Mexico
  • 2. South America
    • 2.1. Brazil
    • 2.2. Argentina
    • 2.3. Rest of South America
  • 3. Europe
    • 3.1. United Kingdom
    • 3.2. Germany
    • 3.3. France
    • 3.4. Italy
    • 3.5. Spain
    • 3.6. Russia
    • 3.7. Benelux
    • 3.8. Nordics
    • 3.9. Rest of Europe
  • 4. Middle East & Africa
    • 4.1. Turkey
    • 4.2. Israel
    • 4.3. GCC
    • 4.4. North Africa
    • 4.5. South Africa
    • 4.6. Rest of Middle East & Africa
  • 5. Asia Pacific
    • 5.1. China
    • 5.2. India
    • 5.3. Japan
    • 5.4. South Korea
    • 5.5. ASEAN
    • 5.6. Oceania
    • 5.7. Rest of Asia Pacific
Limes Market in Mexico Regional Share


Limes Market in Mexico REPORT HIGHLIGHTS

AspectsDetails
Study Period 2019-2033
Base Year 2024
Estimated Year 2025
Forecast Period2025-2033
Historical Period2019-2024
Growth RateCAGR of 4.10% from 2019-2033
Segmentation
    • By Production Analysis (Volume)
    • By Consumption Analysis (Value and Volume)
    • By Import Analysis (Value and Volume)
    • By Export Analysis (Value and Volume)
    • By Price Trend Analysis
    • By Production Analysis (Volume)
    • By Consumption Analysis (Value and Volume)
    • By Import Analysis (Value and Volume)
    • By Export Analysis (Value and Volume)
    • By Price Trend Analysis
  • By Geography
    • North America
      • United States
      • Canada
      • Mexico
    • South America
      • Brazil
      • Argentina
      • Rest of South America
    • Europe
      • United Kingdom
      • Germany
      • France
      • Italy
      • Spain
      • Russia
      • Benelux
      • Nordics
      • Rest of Europe
    • Middle East & Africa
      • Turkey
      • Israel
      • GCC
      • North Africa
      • South Africa
      • Rest of Middle East & Africa
    • Asia Pacific
      • China
      • India
      • Japan
      • South Korea
      • ASEAN
      • Oceania
      • Rest of Asia Pacific


Table of Contents

  1. 1. Introduction
    • 1.1. Research Scope
    • 1.2. Market Segmentation
    • 1.3. Research Methodology
    • 1.4. Definitions and Assumptions
  2. 2. Executive Summary
    • 2.1. Introduction
  3. 3. Market Dynamics
    • 3.1. Introduction
      • 3.2. Market Drivers
        • 3.2.1. Rising Demand for Milled and Broken Rice; Growing Preference for Speciality Rice Variety; Government Initiatives Supports Rice Production
      • 3.3. Market Restrains
        • 3.3.1. Lack of Supply Chain for Rice; Growing Agricultural Labor Crisis
      • 3.4. Market Trends
        • 3.4.1. Increased Production in Mexico
  4. 4. Market Factor Analysis
    • 4.1. Porters Five Forces
    • 4.2. Supply/Value Chain
    • 4.3. PESTEL analysis
    • 4.4. Market Entropy
    • 4.5. Patent/Trademark Analysis
  5. 5. Global Limes Market in Mexico Analysis, Insights and Forecast, 2019-2031
    • 5.1. Market Analysis, Insights and Forecast - by Production Analysis (Volume)
      • 5.2. Market Analysis, Insights and Forecast - by Consumption Analysis (Value and Volume)
        • 5.3. Market Analysis, Insights and Forecast - by Import Analysis (Value and Volume)
          • 5.4. Market Analysis, Insights and Forecast - by Export Analysis (Value and Volume)
            • 5.5. Market Analysis, Insights and Forecast - by Price Trend Analysis
              • 5.6. Market Analysis, Insights and Forecast - by Production Analysis (Volume)
                • 5.7. Market Analysis, Insights and Forecast - by Consumption Analysis (Value and Volume)
                  • 5.8. Market Analysis, Insights and Forecast - by Import Analysis (Value and Volume)
                    • 5.9. Market Analysis, Insights and Forecast - by Export Analysis (Value and Volume)
                      • 5.10. Market Analysis, Insights and Forecast - by Price Trend Analysis
                        • 5.11. Market Analysis, Insights and Forecast - by Region
                          • 5.11.1. North America
                          • 5.11.2. South America
                          • 5.11.3. Europe
                          • 5.11.4. Middle East & Africa
                          • 5.11.5. Asia Pacific
                      • 6. North America Limes Market in Mexico Analysis, Insights and Forecast, 2019-2031
                        • 6.1. Market Analysis, Insights and Forecast - by Production Analysis (Volume)
                          • 6.2. Market Analysis, Insights and Forecast - by Consumption Analysis (Value and Volume)
                            • 6.3. Market Analysis, Insights and Forecast - by Import Analysis (Value and Volume)
                              • 6.4. Market Analysis, Insights and Forecast - by Export Analysis (Value and Volume)
                                • 6.5. Market Analysis, Insights and Forecast - by Price Trend Analysis
                                  • 6.6. Market Analysis, Insights and Forecast - by Production Analysis (Volume)
                                    • 6.7. Market Analysis, Insights and Forecast - by Consumption Analysis (Value and Volume)
                                      • 6.8. Market Analysis, Insights and Forecast - by Import Analysis (Value and Volume)
                                        • 6.9. Market Analysis, Insights and Forecast - by Export Analysis (Value and Volume)
                                          • 6.10. Market Analysis, Insights and Forecast - by Price Trend Analysis
                                          • 7. South America Limes Market in Mexico Analysis, Insights and Forecast, 2019-2031
                                            • 7.1. Market Analysis, Insights and Forecast - by Production Analysis (Volume)
                                              • 7.2. Market Analysis, Insights and Forecast - by Consumption Analysis (Value and Volume)
                                                • 7.3. Market Analysis, Insights and Forecast - by Import Analysis (Value and Volume)
                                                  • 7.4. Market Analysis, Insights and Forecast - by Export Analysis (Value and Volume)
                                                    • 7.5. Market Analysis, Insights and Forecast - by Price Trend Analysis
                                                      • 7.6. Market Analysis, Insights and Forecast - by Production Analysis (Volume)
                                                        • 7.7. Market Analysis, Insights and Forecast - by Consumption Analysis (Value and Volume)
                                                          • 7.8. Market Analysis, Insights and Forecast - by Import Analysis (Value and Volume)
                                                            • 7.9. Market Analysis, Insights and Forecast - by Export Analysis (Value and Volume)
                                                              • 7.10. Market Analysis, Insights and Forecast - by Price Trend Analysis
                                                              • 8. Europe Limes Market in Mexico Analysis, Insights and Forecast, 2019-2031
                                                                • 8.1. Market Analysis, Insights and Forecast - by Production Analysis (Volume)
                                                                  • 8.2. Market Analysis, Insights and Forecast - by Consumption Analysis (Value and Volume)
                                                                    • 8.3. Market Analysis, Insights and Forecast - by Import Analysis (Value and Volume)
                                                                      • 8.4. Market Analysis, Insights and Forecast - by Export Analysis (Value and Volume)
                                                                        • 8.5. Market Analysis, Insights and Forecast - by Price Trend Analysis
                                                                          • 8.6. Market Analysis, Insights and Forecast - by Production Analysis (Volume)
                                                                            • 8.7. Market Analysis, Insights and Forecast - by Consumption Analysis (Value and Volume)
                                                                              • 8.8. Market Analysis, Insights and Forecast - by Import Analysis (Value and Volume)
                                                                                • 8.9. Market Analysis, Insights and Forecast - by Export Analysis (Value and Volume)
                                                                                  • 8.10. Market Analysis, Insights and Forecast - by Price Trend Analysis
                                                                                  • 9. Middle East & Africa Limes Market in Mexico Analysis, Insights and Forecast, 2019-2031
                                                                                    • 9.1. Market Analysis, Insights and Forecast - by Production Analysis (Volume)
                                                                                      • 9.2. Market Analysis, Insights and Forecast - by Consumption Analysis (Value and Volume)
                                                                                        • 9.3. Market Analysis, Insights and Forecast - by Import Analysis (Value and Volume)
                                                                                          • 9.4. Market Analysis, Insights and Forecast - by Export Analysis (Value and Volume)
                                                                                            • 9.5. Market Analysis, Insights and Forecast - by Price Trend Analysis
                                                                                              • 9.6. Market Analysis, Insights and Forecast - by Production Analysis (Volume)
                                                                                                • 9.7. Market Analysis, Insights and Forecast - by Consumption Analysis (Value and Volume)
                                                                                                  • 9.8. Market Analysis, Insights and Forecast - by Import Analysis (Value and Volume)
                                                                                                    • 9.9. Market Analysis, Insights and Forecast - by Export Analysis (Value and Volume)
                                                                                                      • 9.10. Market Analysis, Insights and Forecast - by Price Trend Analysis
                                                                                                      • 10. Asia Pacific Limes Market in Mexico Analysis, Insights and Forecast, 2019-2031
                                                                                                        • 10.1. Market Analysis, Insights and Forecast - by Production Analysis (Volume)
                                                                                                          • 10.2. Market Analysis, Insights and Forecast - by Consumption Analysis (Value and Volume)
                                                                                                            • 10.3. Market Analysis, Insights and Forecast - by Import Analysis (Value and Volume)
                                                                                                              • 10.4. Market Analysis, Insights and Forecast - by Export Analysis (Value and Volume)
                                                                                                                • 10.5. Market Analysis, Insights and Forecast - by Price Trend Analysis
                                                                                                                  • 10.6. Market Analysis, Insights and Forecast - by Production Analysis (Volume)
                                                                                                                    • 10.7. Market Analysis, Insights and Forecast - by Consumption Analysis (Value and Volume)
                                                                                                                      • 10.8. Market Analysis, Insights and Forecast - by Import Analysis (Value and Volume)
                                                                                                                        • 10.9. Market Analysis, Insights and Forecast - by Export Analysis (Value and Volume)
                                                                                                                          • 10.10. Market Analysis, Insights and Forecast - by Price Trend Analysis
                                                                                                                          • 11. Competitive Analysis
                                                                                                                            • 11.1. Global Market Share Analysis 2024
                                                                                                                              • 11.2. Company Profiles
                                                                                                                                • 11.2.1 Syngenta
                                                                                                                                  • 11.2.1.1. Overview
                                                                                                                                  • 11.2.1.2. Products
                                                                                                                                  • 11.2.1.3. SWOT Analysis
                                                                                                                                  • 11.2.1.4. Recent Developments
                                                                                                                                  • 11.2.1.5. Financials (Based on Availability)
                                                                                                                                • 11.2.2 Bayer CropScience
                                                                                                                                  • 11.2.2.1. Overview
                                                                                                                                  • 11.2.2.2. Products
                                                                                                                                  • 11.2.2.3. SWOT Analysis
                                                                                                                                  • 11.2.2.4. Recent Developments
                                                                                                                                  • 11.2.2.5. Financials (Based on Availability)
                                                                                                                                • 11.2.3 Monsanto
                                                                                                                                  • 11.2.3.1. Overview
                                                                                                                                  • 11.2.3.2. Products
                                                                                                                                  • 11.2.3.3. SWOT Analysis
                                                                                                                                  • 11.2.3.4. Recent Developments
                                                                                                                                  • 11.2.3.5. Financials (Based on Availability)
                                                                                                                                • 11.2.4 Grupo Mexico
                                                                                                                                  • 11.2.4.1. Overview
                                                                                                                                  • 11.2.4.2. Products
                                                                                                                                  • 11.2.4.3. SWOT Analysis
                                                                                                                                  • 11.2.4.4. Recent Developments
                                                                                                                                  • 11.2.4.5. Financials (Based on Availability)

                                                                                                                          List of Figures

                                                                                                                          1. Figure 1: Global Limes Market in Mexico Revenue Breakdown (Million, %) by Region 2024 & 2032
                                                                                                                          2. Figure 2: Global Limes Market in Mexico Volume Breakdown (Kiloton, %) by Region 2024 & 2032
                                                                                                                          3. Figure 3: Mexico Limes Market in Mexico Revenue (Million), by Country 2024 & 2032
                                                                                                                          4. Figure 4: Mexico Limes Market in Mexico Volume (Kiloton), by Country 2024 & 2032
                                                                                                                          5. Figure 5: Mexico Limes Market in Mexico Revenue Share (%), by Country 2024 & 2032
                                                                                                                          6. Figure 6: Mexico Limes Market in Mexico Volume Share (%), by Country 2024 & 2032
                                                                                                                          7. Figure 7: North America Limes Market in Mexico Revenue (Million), by Production Analysis (Volume) 2024 & 2032
                                                                                                                          8. Figure 8: North America Limes Market in Mexico Volume (Kiloton), by Production Analysis (Volume) 2024 & 2032
                                                                                                                          9. Figure 9: North America Limes Market in Mexico Revenue Share (%), by Production Analysis (Volume) 2024 & 2032
                                                                                                                          10. Figure 10: North America Limes Market in Mexico Volume Share (%), by Production Analysis (Volume) 2024 & 2032
                                                                                                                          11. Figure 11: North America Limes Market in Mexico Revenue (Million), by Consumption Analysis (Value and Volume) 2024 & 2032
                                                                                                                          12. Figure 12: North America Limes Market in Mexico Volume (Kiloton), by Consumption Analysis (Value and Volume) 2024 & 2032
                                                                                                                          13. Figure 13: North America Limes Market in Mexico Revenue Share (%), by Consumption Analysis (Value and Volume) 2024 & 2032
                                                                                                                          14. Figure 14: North America Limes Market in Mexico Volume Share (%), by Consumption Analysis (Value and Volume) 2024 & 2032
                                                                                                                          15. Figure 15: North America Limes Market in Mexico Revenue (Million), by Import Analysis (Value and Volume) 2024 & 2032
                                                                                                                          16. Figure 16: North America Limes Market in Mexico Volume (Kiloton), by Import Analysis (Value and Volume) 2024 & 2032
                                                                                                                          17. Figure 17: North America Limes Market in Mexico Revenue Share (%), by Import Analysis (Value and Volume) 2024 & 2032
                                                                                                                          18. Figure 18: North America Limes Market in Mexico Volume Share (%), by Import Analysis (Value and Volume) 2024 & 2032
                                                                                                                          19. Figure 19: North America Limes Market in Mexico Revenue (Million), by Export Analysis (Value and Volume) 2024 & 2032
                                                                                                                          20. Figure 20: North America Limes Market in Mexico Volume (Kiloton), by Export Analysis (Value and Volume) 2024 & 2032
                                                                                                                          21. Figure 21: North America Limes Market in Mexico Revenue Share (%), by Export Analysis (Value and Volume) 2024 & 2032
                                                                                                                          22. Figure 22: North America Limes Market in Mexico Volume Share (%), by Export Analysis (Value and Volume) 2024 & 2032
                                                                                                                          23. Figure 23: North America Limes Market in Mexico Revenue (Million), by Price Trend Analysis 2024 & 2032
                                                                                                                          24. Figure 24: North America Limes Market in Mexico Volume (Kiloton), by Price Trend Analysis 2024 & 2032
                                                                                                                          25. Figure 25: North America Limes Market in Mexico Revenue Share (%), by Price Trend Analysis 2024 & 2032
                                                                                                                          26. Figure 26: North America Limes Market in Mexico Volume Share (%), by Price Trend Analysis 2024 & 2032
                                                                                                                          27. Figure 27: North America Limes Market in Mexico Revenue (Million), by Production Analysis (Volume) 2024 & 2032
                                                                                                                          28. Figure 28: North America Limes Market in Mexico Volume (Kiloton), by Production Analysis (Volume) 2024 & 2032
                                                                                                                          29. Figure 29: North America Limes Market in Mexico Revenue Share (%), by Production Analysis (Volume) 2024 & 2032
                                                                                                                          30. Figure 30: North America Limes Market in Mexico Volume Share (%), by Production Analysis (Volume) 2024 & 2032
                                                                                                                          31. Figure 31: North America Limes Market in Mexico Revenue (Million), by Consumption Analysis (Value and Volume) 2024 & 2032
                                                                                                                          32. Figure 32: North America Limes Market in Mexico Volume (Kiloton), by Consumption Analysis (Value and Volume) 2024 & 2032
                                                                                                                          33. Figure 33: North America Limes Market in Mexico Revenue Share (%), by Consumption Analysis (Value and Volume) 2024 & 2032
                                                                                                                          34. Figure 34: North America Limes Market in Mexico Volume Share (%), by Consumption Analysis (Value and Volume) 2024 & 2032
                                                                                                                          35. Figure 35: North America Limes Market in Mexico Revenue (Million), by Import Analysis (Value and Volume) 2024 & 2032
                                                                                                                          36. Figure 36: North America Limes Market in Mexico Volume (Kiloton), by Import Analysis (Value and Volume) 2024 & 2032
                                                                                                                          37. Figure 37: North America Limes Market in Mexico Revenue Share (%), by Import Analysis (Value and Volume) 2024 & 2032
                                                                                                                          38. Figure 38: North America Limes Market in Mexico Volume Share (%), by Import Analysis (Value and Volume) 2024 & 2032
                                                                                                                          39. Figure 39: North America Limes Market in Mexico Revenue (Million), by Export Analysis (Value and Volume) 2024 & 2032
                                                                                                                          40. Figure 40: North America Limes Market in Mexico Volume (Kiloton), by Export Analysis (Value and Volume) 2024 & 2032
                                                                                                                          41. Figure 41: North America Limes Market in Mexico Revenue Share (%), by Export Analysis (Value and Volume) 2024 & 2032
                                                                                                                          42. Figure 42: North America Limes Market in Mexico Volume Share (%), by Export Analysis (Value and Volume) 2024 & 2032
                                                                                                                          43. Figure 43: North America Limes Market in Mexico Revenue (Million), by Price Trend Analysis 2024 & 2032
                                                                                                                          44. Figure 44: North America Limes Market in Mexico Volume (Kiloton), by Price Trend Analysis 2024 & 2032
                                                                                                                          45. Figure 45: North America Limes Market in Mexico Revenue Share (%), by Price Trend Analysis 2024 & 2032
                                                                                                                          46. Figure 46: North America Limes Market in Mexico Volume Share (%), by Price Trend Analysis 2024 & 2032
                                                                                                                          47. Figure 47: North America Limes Market in Mexico Revenue (Million), by Country 2024 & 2032
                                                                                                                          48. Figure 48: North America Limes Market in Mexico Volume (Kiloton), by Country 2024 & 2032
                                                                                                                          49. Figure 49: North America Limes Market in Mexico Revenue Share (%), by Country 2024 & 2032
                                                                                                                          50. Figure 50: North America Limes Market in Mexico Volume Share (%), by Country 2024 & 2032
                                                                                                                          51. Figure 51: South America Limes Market in Mexico Revenue (Million), by Production Analysis (Volume) 2024 & 2032
                                                                                                                          52. Figure 52: South America Limes Market in Mexico Volume (Kiloton), by Production Analysis (Volume) 2024 & 2032
                                                                                                                          53. Figure 53: South America Limes Market in Mexico Revenue Share (%), by Production Analysis (Volume) 2024 & 2032
                                                                                                                          54. Figure 54: South America Limes Market in Mexico Volume Share (%), by Production Analysis (Volume) 2024 & 2032
                                                                                                                          55. Figure 55: South America Limes Market in Mexico Revenue (Million), by Consumption Analysis (Value and Volume) 2024 & 2032
                                                                                                                          56. Figure 56: South America Limes Market in Mexico Volume (Kiloton), by Consumption Analysis (Value and Volume) 2024 & 2032
                                                                                                                          57. Figure 57: South America Limes Market in Mexico Revenue Share (%), by Consumption Analysis (Value and Volume) 2024 & 2032
                                                                                                                          58. Figure 58: South America Limes Market in Mexico Volume Share (%), by Consumption Analysis (Value and Volume) 2024 & 2032
                                                                                                                          59. Figure 59: South America Limes Market in Mexico Revenue (Million), by Import Analysis (Value and Volume) 2024 & 2032
                                                                                                                          60. Figure 60: South America Limes Market in Mexico Volume (Kiloton), by Import Analysis (Value and Volume) 2024 & 2032
                                                                                                                          61. Figure 61: South America Limes Market in Mexico Revenue Share (%), by Import Analysis (Value and Volume) 2024 & 2032
                                                                                                                          62. Figure 62: South America Limes Market in Mexico Volume Share (%), by Import Analysis (Value and Volume) 2024 & 2032
                                                                                                                          63. Figure 63: South America Limes Market in Mexico Revenue (Million), by Export Analysis (Value and Volume) 2024 & 2032
                                                                                                                          64. Figure 64: South America Limes Market in Mexico Volume (Kiloton), by Export Analysis (Value and Volume) 2024 & 2032
                                                                                                                          65. Figure 65: South America Limes Market in Mexico Revenue Share (%), by Export Analysis (Value and Volume) 2024 & 2032
                                                                                                                          66. Figure 66: South America Limes Market in Mexico Volume Share (%), by Export Analysis (Value and Volume) 2024 & 2032
                                                                                                                          67. Figure 67: South America Limes Market in Mexico Revenue (Million), by Price Trend Analysis 2024 & 2032
                                                                                                                          68. Figure 68: South America Limes Market in Mexico Volume (Kiloton), by Price Trend Analysis 2024 & 2032
                                                                                                                          69. Figure 69: South America Limes Market in Mexico Revenue Share (%), by Price Trend Analysis 2024 & 2032
                                                                                                                          70. Figure 70: South America Limes Market in Mexico Volume Share (%), by Price Trend Analysis 2024 & 2032
                                                                                                                          71. Figure 71: South America Limes Market in Mexico Revenue (Million), by Production Analysis (Volume) 2024 & 2032
                                                                                                                          72. Figure 72: South America Limes Market in Mexico Volume (Kiloton), by Production Analysis (Volume) 2024 & 2032
                                                                                                                          73. Figure 73: South America Limes Market in Mexico Revenue Share (%), by Production Analysis (Volume) 2024 & 2032
                                                                                                                          74. Figure 74: South America Limes Market in Mexico Volume Share (%), by Production Analysis (Volume) 2024 & 2032
                                                                                                                          75. Figure 75: South America Limes Market in Mexico Revenue (Million), by Consumption Analysis (Value and Volume) 2024 & 2032
                                                                                                                          76. Figure 76: South America Limes Market in Mexico Volume (Kiloton), by Consumption Analysis (Value and Volume) 2024 & 2032
                                                                                                                          77. Figure 77: South America Limes Market in Mexico Revenue Share (%), by Consumption Analysis (Value and Volume) 2024 & 2032
                                                                                                                          78. Figure 78: South America Limes Market in Mexico Volume Share (%), by Consumption Analysis (Value and Volume) 2024 & 2032
                                                                                                                          79. Figure 79: South America Limes Market in Mexico Revenue (Million), by Import Analysis (Value and Volume) 2024 & 2032
                                                                                                                          80. Figure 80: South America Limes Market in Mexico Volume (Kiloton), by Import Analysis (Value and Volume) 2024 & 2032
                                                                                                                          81. Figure 81: South America Limes Market in Mexico Revenue Share (%), by Import Analysis (Value and Volume) 2024 & 2032
                                                                                                                          82. Figure 82: South America Limes Market in Mexico Volume Share (%), by Import Analysis (Value and Volume) 2024 & 2032
                                                                                                                          83. Figure 83: South America Limes Market in Mexico Revenue (Million), by Export Analysis (Value and Volume) 2024 & 2032
                                                                                                                          84. Figure 84: South America Limes Market in Mexico Volume (Kiloton), by Export Analysis (Value and Volume) 2024 & 2032
                                                                                                                          85. Figure 85: South America Limes Market in Mexico Revenue Share (%), by Export Analysis (Value and Volume) 2024 & 2032
                                                                                                                          86. Figure 86: South America Limes Market in Mexico Volume Share (%), by Export Analysis (Value and Volume) 2024 & 2032
                                                                                                                          87. Figure 87: South America Limes Market in Mexico Revenue (Million), by Price Trend Analysis 2024 & 2032
                                                                                                                          88. Figure 88: South America Limes Market in Mexico Volume (Kiloton), by Price Trend Analysis 2024 & 2032
                                                                                                                          89. Figure 89: South America Limes Market in Mexico Revenue Share (%), by Price Trend Analysis 2024 & 2032
                                                                                                                          90. Figure 90: South America Limes Market in Mexico Volume Share (%), by Price Trend Analysis 2024 & 2032
                                                                                                                          91. Figure 91: South America Limes Market in Mexico Revenue (Million), by Country 2024 & 2032
                                                                                                                          92. Figure 92: South America Limes Market in Mexico Volume (Kiloton), by Country 2024 & 2032
                                                                                                                          93. Figure 93: South America Limes Market in Mexico Revenue Share (%), by Country 2024 & 2032
                                                                                                                          94. Figure 94: South America Limes Market in Mexico Volume Share (%), by Country 2024 & 2032
                                                                                                                          95. Figure 95: Europe Limes Market in Mexico Revenue (Million), by Production Analysis (Volume) 2024 & 2032
                                                                                                                          96. Figure 96: Europe Limes Market in Mexico Volume (Kiloton), by Production Analysis (Volume) 2024 & 2032
                                                                                                                          97. Figure 97: Europe Limes Market in Mexico Revenue Share (%), by Production Analysis (Volume) 2024 & 2032
                                                                                                                          98. Figure 98: Europe Limes Market in Mexico Volume Share (%), by Production Analysis (Volume) 2024 & 2032
                                                                                                                          99. Figure 99: Europe Limes Market in Mexico Revenue (Million), by Consumption Analysis (Value and Volume) 2024 & 2032
                                                                                                                          100. Figure 100: Europe Limes Market in Mexico Volume (Kiloton), by Consumption Analysis (Value and Volume) 2024 & 2032
                                                                                                                          101. Figure 101: Europe Limes Market in Mexico Revenue Share (%), by Consumption Analysis (Value and Volume) 2024 & 2032
                                                                                                                          102. Figure 102: Europe Limes Market in Mexico Volume Share (%), by Consumption Analysis (Value and Volume) 2024 & 2032
                                                                                                                          103. Figure 103: Europe Limes Market in Mexico Revenue (Million), by Import Analysis (Value and Volume) 2024 & 2032
                                                                                                                          104. Figure 104: Europe Limes Market in Mexico Volume (Kiloton), by Import Analysis (Value and Volume) 2024 & 2032
                                                                                                                          105. Figure 105: Europe Limes Market in Mexico Revenue Share (%), by Import Analysis (Value and Volume) 2024 & 2032
                                                                                                                          106. Figure 106: Europe Limes Market in Mexico Volume Share (%), by Import Analysis (Value and Volume) 2024 & 2032
                                                                                                                          107. Figure 107: Europe Limes Market in Mexico Revenue (Million), by Export Analysis (Value and Volume) 2024 & 2032
                                                                                                                          108. Figure 108: Europe Limes Market in Mexico Volume (Kiloton), by Export Analysis (Value and Volume) 2024 & 2032
                                                                                                                          109. Figure 109: Europe Limes Market in Mexico Revenue Share (%), by Export Analysis (Value and Volume) 2024 & 2032
                                                                                                                          110. Figure 110: Europe Limes Market in Mexico Volume Share (%), by Export Analysis (Value and Volume) 2024 & 2032
                                                                                                                          111. Figure 111: Europe Limes Market in Mexico Revenue (Million), by Price Trend Analysis 2024 & 2032
                                                                                                                          112. Figure 112: Europe Limes Market in Mexico Volume (Kiloton), by Price Trend Analysis 2024 & 2032
                                                                                                                          113. Figure 113: Europe Limes Market in Mexico Revenue Share (%), by Price Trend Analysis 2024 & 2032
                                                                                                                          114. Figure 114: Europe Limes Market in Mexico Volume Share (%), by Price Trend Analysis 2024 & 2032
                                                                                                                          115. Figure 115: Europe Limes Market in Mexico Revenue (Million), by Production Analysis (Volume) 2024 & 2032
                                                                                                                          116. Figure 116: Europe Limes Market in Mexico Volume (Kiloton), by Production Analysis (Volume) 2024 & 2032
                                                                                                                          117. Figure 117: Europe Limes Market in Mexico Revenue Share (%), by Production Analysis (Volume) 2024 & 2032
                                                                                                                          118. Figure 118: Europe Limes Market in Mexico Volume Share (%), by Production Analysis (Volume) 2024 & 2032
                                                                                                                          119. Figure 119: Europe Limes Market in Mexico Revenue (Million), by Consumption Analysis (Value and Volume) 2024 & 2032
                                                                                                                          120. Figure 120: Europe Limes Market in Mexico Volume (Kiloton), by Consumption Analysis (Value and Volume) 2024 & 2032
                                                                                                                          121. Figure 121: Europe Limes Market in Mexico Revenue Share (%), by Consumption Analysis (Value and Volume) 2024 & 2032
                                                                                                                          122. Figure 122: Europe Limes Market in Mexico Volume Share (%), by Consumption Analysis (Value and Volume) 2024 & 2032
                                                                                                                          123. Figure 123: Europe Limes Market in Mexico Revenue (Million), by Import Analysis (Value and Volume) 2024 & 2032
                                                                                                                          124. Figure 124: Europe Limes Market in Mexico Volume (Kiloton), by Import Analysis (Value and Volume) 2024 & 2032
                                                                                                                          125. Figure 125: Europe Limes Market in Mexico Revenue Share (%), by Import Analysis (Value and Volume) 2024 & 2032
                                                                                                                          126. Figure 126: Europe Limes Market in Mexico Volume Share (%), by Import Analysis (Value and Volume) 2024 & 2032
                                                                                                                          127. Figure 127: Europe Limes Market in Mexico Revenue (Million), by Export Analysis (Value and Volume) 2024 & 2032
                                                                                                                          128. Figure 128: Europe Limes Market in Mexico Volume (Kiloton), by Export Analysis (Value and Volume) 2024 & 2032
                                                                                                                          129. Figure 129: Europe Limes Market in Mexico Revenue Share (%), by Export Analysis (Value and Volume) 2024 & 2032
                                                                                                                          130. Figure 130: Europe Limes Market in Mexico Volume Share (%), by Export Analysis (Value and Volume) 2024 & 2032
                                                                                                                          131. Figure 131: Europe Limes Market in Mexico Revenue (Million), by Price Trend Analysis 2024 & 2032
                                                                                                                          132. Figure 132: Europe Limes Market in Mexico Volume (Kiloton), by Price Trend Analysis 2024 & 2032
                                                                                                                          133. Figure 133: Europe Limes Market in Mexico Revenue Share (%), by Price Trend Analysis 2024 & 2032
                                                                                                                          134. Figure 134: Europe Limes Market in Mexico Volume Share (%), by Price Trend Analysis 2024 & 2032
                                                                                                                          135. Figure 135: Europe Limes Market in Mexico Revenue (Million), by Country 2024 & 2032
                                                                                                                          136. Figure 136: Europe Limes Market in Mexico Volume (Kiloton), by Country 2024 & 2032
                                                                                                                          137. Figure 137: Europe Limes Market in Mexico Revenue Share (%), by Country 2024 & 2032
                                                                                                                          138. Figure 138: Europe Limes Market in Mexico Volume Share (%), by Country 2024 & 2032
                                                                                                                          139. Figure 139: Middle East & Africa Limes Market in Mexico Revenue (Million), by Production Analysis (Volume) 2024 & 2032
                                                                                                                          140. Figure 140: Middle East & Africa Limes Market in Mexico Volume (Kiloton), by Production Analysis (Volume) 2024 & 2032
                                                                                                                          141. Figure 141: Middle East & Africa Limes Market in Mexico Revenue Share (%), by Production Analysis (Volume) 2024 & 2032
                                                                                                                          142. Figure 142: Middle East & Africa Limes Market in Mexico Volume Share (%), by Production Analysis (Volume) 2024 & 2032
                                                                                                                          143. Figure 143: Middle East & Africa Limes Market in Mexico Revenue (Million), by Consumption Analysis (Value and Volume) 2024 & 2032
                                                                                                                          144. Figure 144: Middle East & Africa Limes Market in Mexico Volume (Kiloton), by Consumption Analysis (Value and Volume) 2024 & 2032
                                                                                                                          145. Figure 145: Middle East & Africa Limes Market in Mexico Revenue Share (%), by Consumption Analysis (Value and Volume) 2024 & 2032
                                                                                                                          146. Figure 146: Middle East & Africa Limes Market in Mexico Volume Share (%), by Consumption Analysis (Value and Volume) 2024 & 2032
                                                                                                                          147. Figure 147: Middle East & Africa Limes Market in Mexico Revenue (Million), by Import Analysis (Value and Volume) 2024 & 2032
                                                                                                                          148. Figure 148: Middle East & Africa Limes Market in Mexico Volume (Kiloton), by Import Analysis (Value and Volume) 2024 & 2032
                                                                                                                          149. Figure 149: Middle East & Africa Limes Market in Mexico Revenue Share (%), by Import Analysis (Value and Volume) 2024 & 2032
                                                                                                                          150. Figure 150: Middle East & Africa Limes Market in Mexico Volume Share (%), by Import Analysis (Value and Volume) 2024 & 2032
                                                                                                                          151. Figure 151: Middle East & Africa Limes Market in Mexico Revenue (Million), by Export Analysis (Value and Volume) 2024 & 2032
                                                                                                                          152. Figure 152: Middle East & Africa Limes Market in Mexico Volume (Kiloton), by Export Analysis (Value and Volume) 2024 & 2032
                                                                                                                          153. Figure 153: Middle East & Africa Limes Market in Mexico Revenue Share (%), by Export Analysis (Value and Volume) 2024 & 2032
                                                                                                                          154. Figure 154: Middle East & Africa Limes Market in Mexico Volume Share (%), by Export Analysis (Value and Volume) 2024 & 2032
                                                                                                                          155. Figure 155: Middle East & Africa Limes Market in Mexico Revenue (Million), by Price Trend Analysis 2024 & 2032
                                                                                                                          156. Figure 156: Middle East & Africa Limes Market in Mexico Volume (Kiloton), by Price Trend Analysis 2024 & 2032
                                                                                                                          157. Figure 157: Middle East & Africa Limes Market in Mexico Revenue Share (%), by Price Trend Analysis 2024 & 2032
                                                                                                                          158. Figure 158: Middle East & Africa Limes Market in Mexico Volume Share (%), by Price Trend Analysis 2024 & 2032
                                                                                                                          159. Figure 159: Middle East & Africa Limes Market in Mexico Revenue (Million), by Production Analysis (Volume) 2024 & 2032
                                                                                                                          160. Figure 160: Middle East & Africa Limes Market in Mexico Volume (Kiloton), by Production Analysis (Volume) 2024 & 2032
                                                                                                                          161. Figure 161: Middle East & Africa Limes Market in Mexico Revenue Share (%), by Production Analysis (Volume) 2024 & 2032
                                                                                                                          162. Figure 162: Middle East & Africa Limes Market in Mexico Volume Share (%), by Production Analysis (Volume) 2024 & 2032
                                                                                                                          163. Figure 163: Middle East & Africa Limes Market in Mexico Revenue (Million), by Consumption Analysis (Value and Volume) 2024 & 2032
                                                                                                                          164. Figure 164: Middle East & Africa Limes Market in Mexico Volume (Kiloton), by Consumption Analysis (Value and Volume) 2024 & 2032
                                                                                                                          165. Figure 165: Middle East & Africa Limes Market in Mexico Revenue Share (%), by Consumption Analysis (Value and Volume) 2024 & 2032
                                                                                                                          166. Figure 166: Middle East & Africa Limes Market in Mexico Volume Share (%), by Consumption Analysis (Value and Volume) 2024 & 2032
                                                                                                                          167. Figure 167: Middle East & Africa Limes Market in Mexico Revenue (Million), by Import Analysis (Value and Volume) 2024 & 2032
                                                                                                                          168. Figure 168: Middle East & Africa Limes Market in Mexico Volume (Kiloton), by Import Analysis (Value and Volume) 2024 & 2032
                                                                                                                          169. Figure 169: Middle East & Africa Limes Market in Mexico Revenue Share (%), by Import Analysis (Value and Volume) 2024 & 2032
                                                                                                                          170. Figure 170: Middle East & Africa Limes Market in Mexico Volume Share (%), by Import Analysis (Value and Volume) 2024 & 2032
                                                                                                                          171. Figure 171: Middle East & Africa Limes Market in Mexico Revenue (Million), by Export Analysis (Value and Volume) 2024 & 2032
                                                                                                                          172. Figure 172: Middle East & Africa Limes Market in Mexico Volume (Kiloton), by Export Analysis (Value and Volume) 2024 & 2032
                                                                                                                          173. Figure 173: Middle East & Africa Limes Market in Mexico Revenue Share (%), by Export Analysis (Value and Volume) 2024 & 2032
                                                                                                                          174. Figure 174: Middle East & Africa Limes Market in Mexico Volume Share (%), by Export Analysis (Value and Volume) 2024 & 2032
                                                                                                                          175. Figure 175: Middle East & Africa Limes Market in Mexico Revenue (Million), by Price Trend Analysis 2024 & 2032
                                                                                                                          176. Figure 176: Middle East & Africa Limes Market in Mexico Volume (Kiloton), by Price Trend Analysis 2024 & 2032
                                                                                                                          177. Figure 177: Middle East & Africa Limes Market in Mexico Revenue Share (%), by Price Trend Analysis 2024 & 2032
                                                                                                                          178. Figure 178: Middle East & Africa Limes Market in Mexico Volume Share (%), by Price Trend Analysis 2024 & 2032
                                                                                                                          179. Figure 179: Middle East & Africa Limes Market in Mexico Revenue (Million), by Country 2024 & 2032
                                                                                                                          180. Figure 180: Middle East & Africa Limes Market in Mexico Volume (Kiloton), by Country 2024 & 2032
                                                                                                                          181. Figure 181: Middle East & Africa Limes Market in Mexico Revenue Share (%), by Country 2024 & 2032
                                                                                                                          182. Figure 182: Middle East & Africa Limes Market in Mexico Volume Share (%), by Country 2024 & 2032
                                                                                                                          183. Figure 183: Asia Pacific Limes Market in Mexico Revenue (Million), by Production Analysis (Volume) 2024 & 2032
                                                                                                                          184. Figure 184: Asia Pacific Limes Market in Mexico Volume (Kiloton), by Production Analysis (Volume) 2024 & 2032
                                                                                                                          185. Figure 185: Asia Pacific Limes Market in Mexico Revenue Share (%), by Production Analysis (Volume) 2024 & 2032
                                                                                                                          186. Figure 186: Asia Pacific Limes Market in Mexico Volume Share (%), by Production Analysis (Volume) 2024 & 2032
                                                                                                                          187. Figure 187: Asia Pacific Limes Market in Mexico Revenue (Million), by Consumption Analysis (Value and Volume) 2024 & 2032
                                                                                                                          188. Figure 188: Asia Pacific Limes Market in Mexico Volume (Kiloton), by Consumption Analysis (Value and Volume) 2024 & 2032
                                                                                                                          189. Figure 189: Asia Pacific Limes Market in Mexico Revenue Share (%), by Consumption Analysis (Value and Volume) 2024 & 2032
                                                                                                                          190. Figure 190: Asia Pacific Limes Market in Mexico Volume Share (%), by Consumption Analysis (Value and Volume) 2024 & 2032
                                                                                                                          191. Figure 191: Asia Pacific Limes Market in Mexico Revenue (Million), by Import Analysis (Value and Volume) 2024 & 2032
                                                                                                                          192. Figure 192: Asia Pacific Limes Market in Mexico Volume (Kiloton), by Import Analysis (Value and Volume) 2024 & 2032
                                                                                                                          193. Figure 193: Asia Pacific Limes Market in Mexico Revenue Share (%), by Import Analysis (Value and Volume) 2024 & 2032
                                                                                                                          194. Figure 194: Asia Pacific Limes Market in Mexico Volume Share (%), by Import Analysis (Value and Volume) 2024 & 2032
                                                                                                                          195. Figure 195: Asia Pacific Limes Market in Mexico Revenue (Million), by Export Analysis (Value and Volume) 2024 & 2032
                                                                                                                          196. Figure 196: Asia Pacific Limes Market in Mexico Volume (Kiloton), by Export Analysis (Value and Volume) 2024 & 2032
                                                                                                                          197. Figure 197: Asia Pacific Limes Market in Mexico Revenue Share (%), by Export Analysis (Value and Volume) 2024 & 2032
                                                                                                                          198. Figure 198: Asia Pacific Limes Market in Mexico Volume Share (%), by Export Analysis (Value and Volume) 2024 & 2032
                                                                                                                          199. Figure 199: Asia Pacific Limes Market in Mexico Revenue (Million), by Price Trend Analysis 2024 & 2032
                                                                                                                          200. Figure 200: Asia Pacific Limes Market in Mexico Volume (Kiloton), by Price Trend Analysis 2024 & 2032
                                                                                                                          201. Figure 201: Asia Pacific Limes Market in Mexico Revenue Share (%), by Price Trend Analysis 2024 & 2032
                                                                                                                          202. Figure 202: Asia Pacific Limes Market in Mexico Volume Share (%), by Price Trend Analysis 2024 & 2032
                                                                                                                          203. Figure 203: Asia Pacific Limes Market in Mexico Revenue (Million), by Production Analysis (Volume) 2024 & 2032
                                                                                                                          204. Figure 204: Asia Pacific Limes Market in Mexico Volume (Kiloton), by Production Analysis (Volume) 2024 & 2032
                                                                                                                          205. Figure 205: Asia Pacific Limes Market in Mexico Revenue Share (%), by Production Analysis (Volume) 2024 & 2032
                                                                                                                          206. Figure 206: Asia Pacific Limes Market in Mexico Volume Share (%), by Production Analysis (Volume) 2024 & 2032
                                                                                                                          207. Figure 207: Asia Pacific Limes Market in Mexico Revenue (Million), by Consumption Analysis (Value and Volume) 2024 & 2032
                                                                                                                          208. Figure 208: Asia Pacific Limes Market in Mexico Volume (Kiloton), by Consumption Analysis (Value and Volume) 2024 & 2032
                                                                                                                          209. Figure 209: Asia Pacific Limes Market in Mexico Revenue Share (%), by Consumption Analysis (Value and Volume) 2024 & 2032
                                                                                                                          210. Figure 210: Asia Pacific Limes Market in Mexico Volume Share (%), by Consumption Analysis (Value and Volume) 2024 & 2032
                                                                                                                          211. Figure 211: Asia Pacific Limes Market in Mexico Revenue (Million), by Import Analysis (Value and Volume) 2024 & 2032
                                                                                                                          212. Figure 212: Asia Pacific Limes Market in Mexico Volume (Kiloton), by Import Analysis (Value and Volume) 2024 & 2032
                                                                                                                          213. Figure 213: Asia Pacific Limes Market in Mexico Revenue Share (%), by Import Analysis (Value and Volume) 2024 & 2032
                                                                                                                          214. Figure 214: Asia Pacific Limes Market in Mexico Volume Share (%), by Import Analysis (Value and Volume) 2024 & 2032
                                                                                                                          215. Figure 215: Asia Pacific Limes Market in Mexico Revenue (Million), by Export Analysis (Value and Volume) 2024 & 2032
                                                                                                                          216. Figure 216: Asia Pacific Limes Market in Mexico Volume (Kiloton), by Export Analysis (Value and Volume) 2024 & 2032
                                                                                                                          217. Figure 217: Asia Pacific Limes Market in Mexico Revenue Share (%), by Export Analysis (Value and Volume) 2024 & 2032
                                                                                                                          218. Figure 218: Asia Pacific Limes Market in Mexico Volume Share (%), by Export Analysis (Value and Volume) 2024 & 2032
                                                                                                                          219. Figure 219: Asia Pacific Limes Market in Mexico Revenue (Million), by Price Trend Analysis 2024 & 2032
                                                                                                                          220. Figure 220: Asia Pacific Limes Market in Mexico Volume (Kiloton), by Price Trend Analysis 2024 & 2032
                                                                                                                          221. Figure 221: Asia Pacific Limes Market in Mexico Revenue Share (%), by Price Trend Analysis 2024 & 2032
                                                                                                                          222. Figure 222: Asia Pacific Limes Market in Mexico Volume Share (%), by Price Trend Analysis 2024 & 2032
                                                                                                                          223. Figure 223: Asia Pacific Limes Market in Mexico Revenue (Million), by Country 2024 & 2032
                                                                                                                          224. Figure 224: Asia Pacific Limes Market in Mexico Volume (Kiloton), by Country 2024 & 2032
                                                                                                                          225. Figure 225: Asia Pacific Limes Market in Mexico Revenue Share (%), by Country 2024 & 2032
                                                                                                                          226. Figure 226: Asia Pacific Limes Market in Mexico Volume Share (%), by Country 2024 & 2032

                                                                                                                          List of Tables

                                                                                                                          1. Table 1: Global Limes Market in Mexico Revenue Million Forecast, by Region 2019 & 2032
                                                                                                                          2. Table 2: Global Limes Market in Mexico Volume Kiloton Forecast, by Region 2019 & 2032
                                                                                                                          3. Table 3: Global Limes Market in Mexico Revenue Million Forecast, by Production Analysis (Volume) 2019 & 2032
                                                                                                                          4. Table 4: Global Limes Market in Mexico Volume Kiloton Forecast, by Production Analysis (Volume) 2019 & 2032
                                                                                                                          5. Table 5: Global Limes Market in Mexico Revenue Million Forecast, by Consumption Analysis (Value and Volume) 2019 & 2032
                                                                                                                          6. Table 6: Global Limes Market in Mexico Volume Kiloton Forecast, by Consumption Analysis (Value and Volume) 2019 & 2032
                                                                                                                          7. Table 7: Global Limes Market in Mexico Revenue Million Forecast, by Import Analysis (Value and Volume) 2019 & 2032
                                                                                                                          8. Table 8: Global Limes Market in Mexico Volume Kiloton Forecast, by Import Analysis (Value and Volume) 2019 & 2032
                                                                                                                          9. Table 9: Global Limes Market in Mexico Revenue Million Forecast, by Export Analysis (Value and Volume) 2019 & 2032
                                                                                                                          10. Table 10: Global Limes Market in Mexico Volume Kiloton Forecast, by Export Analysis (Value and Volume) 2019 & 2032
                                                                                                                          11. Table 11: Global Limes Market in Mexico Revenue Million Forecast, by Price Trend Analysis 2019 & 2032
                                                                                                                          12. Table 12: Global Limes Market in Mexico Volume Kiloton Forecast, by Price Trend Analysis 2019 & 2032
                                                                                                                          13. Table 13: Global Limes Market in Mexico Revenue Million Forecast, by Production Analysis (Volume) 2019 & 2032
                                                                                                                          14. Table 14: Global Limes Market in Mexico Volume Kiloton Forecast, by Production Analysis (Volume) 2019 & 2032
                                                                                                                          15. Table 15: Global Limes Market in Mexico Revenue Million Forecast, by Consumption Analysis (Value and Volume) 2019 & 2032
                                                                                                                          16. Table 16: Global Limes Market in Mexico Volume Kiloton Forecast, by Consumption Analysis (Value and Volume) 2019 & 2032
                                                                                                                          17. Table 17: Global Limes Market in Mexico Revenue Million Forecast, by Import Analysis (Value and Volume) 2019 & 2032
                                                                                                                          18. Table 18: Global Limes Market in Mexico Volume Kiloton Forecast, by Import Analysis (Value and Volume) 2019 & 2032
                                                                                                                          19. Table 19: Global Limes Market in Mexico Revenue Million Forecast, by Export Analysis (Value and Volume) 2019 & 2032
                                                                                                                          20. Table 20: Global Limes Market in Mexico Volume Kiloton Forecast, by Export Analysis (Value and Volume) 2019 & 2032
                                                                                                                          21. Table 21: Global Limes Market in Mexico Revenue Million Forecast, by Price Trend Analysis 2019 & 2032
                                                                                                                          22. Table 22: Global Limes Market in Mexico Volume Kiloton Forecast, by Price Trend Analysis 2019 & 2032
                                                                                                                          23. Table 23: Global Limes Market in Mexico Revenue Million Forecast, by Region 2019 & 2032
                                                                                                                          24. Table 24: Global Limes Market in Mexico Volume Kiloton Forecast, by Region 2019 & 2032
                                                                                                                          25. Table 25: Global Limes Market in Mexico Revenue Million Forecast, by Country 2019 & 2032
                                                                                                                          26. Table 26: Global Limes Market in Mexico Volume Kiloton Forecast, by Country 2019 & 2032
                                                                                                                          27. Table 27: Global Limes Market in Mexico Revenue Million Forecast, by Production Analysis (Volume) 2019 & 2032
                                                                                                                          28. Table 28: Global Limes Market in Mexico Volume Kiloton Forecast, by Production Analysis (Volume) 2019 & 2032
                                                                                                                          29. Table 29: Global Limes Market in Mexico Revenue Million Forecast, by Consumption Analysis (Value and Volume) 2019 & 2032
                                                                                                                          30. Table 30: Global Limes Market in Mexico Volume Kiloton Forecast, by Consumption Analysis (Value and Volume) 2019 & 2032
                                                                                                                          31. Table 31: Global Limes Market in Mexico Revenue Million Forecast, by Import Analysis (Value and Volume) 2019 & 2032
                                                                                                                          32. Table 32: Global Limes Market in Mexico Volume Kiloton Forecast, by Import Analysis (Value and Volume) 2019 & 2032
                                                                                                                          33. Table 33: Global Limes Market in Mexico Revenue Million Forecast, by Export Analysis (Value and Volume) 2019 & 2032
                                                                                                                          34. Table 34: Global Limes Market in Mexico Volume Kiloton Forecast, by Export Analysis (Value and Volume) 2019 & 2032
                                                                                                                          35. Table 35: Global Limes Market in Mexico Revenue Million Forecast, by Price Trend Analysis 2019 & 2032
                                                                                                                          36. Table 36: Global Limes Market in Mexico Volume Kiloton Forecast, by Price Trend Analysis 2019 & 2032
                                                                                                                          37. Table 37: Global Limes Market in Mexico Revenue Million Forecast, by Production Analysis (Volume) 2019 & 2032
                                                                                                                          38. Table 38: Global Limes Market in Mexico Volume Kiloton Forecast, by Production Analysis (Volume) 2019 & 2032
                                                                                                                          39. Table 39: Global Limes Market in Mexico Revenue Million Forecast, by Consumption Analysis (Value and Volume) 2019 & 2032
                                                                                                                          40. Table 40: Global Limes Market in Mexico Volume Kiloton Forecast, by Consumption Analysis (Value and Volume) 2019 & 2032
                                                                                                                          41. Table 41: Global Limes Market in Mexico Revenue Million Forecast, by Import Analysis (Value and Volume) 2019 & 2032
                                                                                                                          42. Table 42: Global Limes Market in Mexico Volume Kiloton Forecast, by Import Analysis (Value and Volume) 2019 & 2032
                                                                                                                          43. Table 43: Global Limes Market in Mexico Revenue Million Forecast, by Export Analysis (Value and Volume) 2019 & 2032
                                                                                                                          44. Table 44: Global Limes Market in Mexico Volume Kiloton Forecast, by Export Analysis (Value and Volume) 2019 & 2032
                                                                                                                          45. Table 45: Global Limes Market in Mexico Revenue Million Forecast, by Price Trend Analysis 2019 & 2032
                                                                                                                          46. Table 46: Global Limes Market in Mexico Volume Kiloton Forecast, by Price Trend Analysis 2019 & 2032
                                                                                                                          47. Table 47: Global Limes Market in Mexico Revenue Million Forecast, by Country 2019 & 2032
                                                                                                                          48. Table 48: Global Limes Market in Mexico Volume Kiloton Forecast, by Country 2019 & 2032
                                                                                                                          49. Table 49: United States Limes Market in Mexico Revenue (Million) Forecast, by Application 2019 & 2032
                                                                                                                          50. Table 50: United States Limes Market in Mexico Volume (Kiloton) Forecast, by Application 2019 & 2032
                                                                                                                          51. Table 51: Canada Limes Market in Mexico Revenue (Million) Forecast, by Application 2019 & 2032
                                                                                                                          52. Table 52: Canada Limes Market in Mexico Volume (Kiloton) Forecast, by Application 2019 & 2032
                                                                                                                          53. Table 53: Mexico Limes Market in Mexico Revenue (Million) Forecast, by Application 2019 & 2032
                                                                                                                          54. Table 54: Mexico Limes Market in Mexico Volume (Kiloton) Forecast, by Application 2019 & 2032
                                                                                                                          55. Table 55: Global Limes Market in Mexico Revenue Million Forecast, by Production Analysis (Volume) 2019 & 2032
                                                                                                                          56. Table 56: Global Limes Market in Mexico Volume Kiloton Forecast, by Production Analysis (Volume) 2019 & 2032
                                                                                                                          57. Table 57: Global Limes Market in Mexico Revenue Million Forecast, by Consumption Analysis (Value and Volume) 2019 & 2032
                                                                                                                          58. Table 58: Global Limes Market in Mexico Volume Kiloton Forecast, by Consumption Analysis (Value and Volume) 2019 & 2032
                                                                                                                          59. Table 59: Global Limes Market in Mexico Revenue Million Forecast, by Import Analysis (Value and Volume) 2019 & 2032
                                                                                                                          60. Table 60: Global Limes Market in Mexico Volume Kiloton Forecast, by Import Analysis (Value and Volume) 2019 & 2032
                                                                                                                          61. Table 61: Global Limes Market in Mexico Revenue Million Forecast, by Export Analysis (Value and Volume) 2019 & 2032
                                                                                                                          62. Table 62: Global Limes Market in Mexico Volume Kiloton Forecast, by Export Analysis (Value and Volume) 2019 & 2032
                                                                                                                          63. Table 63: Global Limes Market in Mexico Revenue Million Forecast, by Price Trend Analysis 2019 & 2032
                                                                                                                          64. Table 64: Global Limes Market in Mexico Volume Kiloton Forecast, by Price Trend Analysis 2019 & 2032
                                                                                                                          65. Table 65: Global Limes Market in Mexico Revenue Million Forecast, by Production Analysis (Volume) 2019 & 2032
                                                                                                                          66. Table 66: Global Limes Market in Mexico Volume Kiloton Forecast, by Production Analysis (Volume) 2019 & 2032
                                                                                                                          67. Table 67: Global Limes Market in Mexico Revenue Million Forecast, by Consumption Analysis (Value and Volume) 2019 & 2032
                                                                                                                          68. Table 68: Global Limes Market in Mexico Volume Kiloton Forecast, by Consumption Analysis (Value and Volume) 2019 & 2032
                                                                                                                          69. Table 69: Global Limes Market in Mexico Revenue Million Forecast, by Import Analysis (Value and Volume) 2019 & 2032
                                                                                                                          70. Table 70: Global Limes Market in Mexico Volume Kiloton Forecast, by Import Analysis (Value and Volume) 2019 & 2032
                                                                                                                          71. Table 71: Global Limes Market in Mexico Revenue Million Forecast, by Export Analysis (Value and Volume) 2019 & 2032
                                                                                                                          72. Table 72: Global Limes Market in Mexico Volume Kiloton Forecast, by Export Analysis (Value and Volume) 2019 & 2032
                                                                                                                          73. Table 73: Global Limes Market in Mexico Revenue Million Forecast, by Price Trend Analysis 2019 & 2032
                                                                                                                          74. Table 74: Global Limes Market in Mexico Volume Kiloton Forecast, by Price Trend Analysis 2019 & 2032
                                                                                                                          75. Table 75: Global Limes Market in Mexico Revenue Million Forecast, by Country 2019 & 2032
                                                                                                                          76. Table 76: Global Limes Market in Mexico Volume Kiloton Forecast, by Country 2019 & 2032
                                                                                                                          77. Table 77: Brazil Limes Market in Mexico Revenue (Million) Forecast, by Application 2019 & 2032
                                                                                                                          78. Table 78: Brazil Limes Market in Mexico Volume (Kiloton) Forecast, by Application 2019 & 2032
                                                                                                                          79. Table 79: Argentina Limes Market in Mexico Revenue (Million) Forecast, by Application 2019 & 2032
                                                                                                                          80. Table 80: Argentina Limes Market in Mexico Volume (Kiloton) Forecast, by Application 2019 & 2032
                                                                                                                          81. Table 81: Rest of South America Limes Market in Mexico Revenue (Million) Forecast, by Application 2019 & 2032
                                                                                                                          82. Table 82: Rest of South America Limes Market in Mexico Volume (Kiloton) Forecast, by Application 2019 & 2032
                                                                                                                          83. Table 83: Global Limes Market in Mexico Revenue Million Forecast, by Production Analysis (Volume) 2019 & 2032
                                                                                                                          84. Table 84: Global Limes Market in Mexico Volume Kiloton Forecast, by Production Analysis (Volume) 2019 & 2032
                                                                                                                          85. Table 85: Global Limes Market in Mexico Revenue Million Forecast, by Consumption Analysis (Value and Volume) 2019 & 2032
                                                                                                                          86. Table 86: Global Limes Market in Mexico Volume Kiloton Forecast, by Consumption Analysis (Value and Volume) 2019 & 2032
                                                                                                                          87. Table 87: Global Limes Market in Mexico Revenue Million Forecast, by Import Analysis (Value and Volume) 2019 & 2032
                                                                                                                          88. Table 88: Global Limes Market in Mexico Volume Kiloton Forecast, by Import Analysis (Value and Volume) 2019 & 2032
                                                                                                                          89. Table 89: Global Limes Market in Mexico Revenue Million Forecast, by Export Analysis (Value and Volume) 2019 & 2032
                                                                                                                          90. Table 90: Global Limes Market in Mexico Volume Kiloton Forecast, by Export Analysis (Value and Volume) 2019 & 2032
                                                                                                                          91. Table 91: Global Limes Market in Mexico Revenue Million Forecast, by Price Trend Analysis 2019 & 2032
                                                                                                                          92. Table 92: Global Limes Market in Mexico Volume Kiloton Forecast, by Price Trend Analysis 2019 & 2032
                                                                                                                          93. Table 93: Global Limes Market in Mexico Revenue Million Forecast, by Production Analysis (Volume) 2019 & 2032
                                                                                                                          94. Table 94: Global Limes Market in Mexico Volume Kiloton Forecast, by Production Analysis (Volume) 2019 & 2032
                                                                                                                          95. Table 95: Global Limes Market in Mexico Revenue Million Forecast, by Consumption Analysis (Value and Volume) 2019 & 2032
                                                                                                                          96. Table 96: Global Limes Market in Mexico Volume Kiloton Forecast, by Consumption Analysis (Value and Volume) 2019 & 2032
                                                                                                                          97. Table 97: Global Limes Market in Mexico Revenue Million Forecast, by Import Analysis (Value and Volume) 2019 & 2032
                                                                                                                          98. Table 98: Global Limes Market in Mexico Volume Kiloton Forecast, by Import Analysis (Value and Volume) 2019 & 2032
                                                                                                                          99. Table 99: Global Limes Market in Mexico Revenue Million Forecast, by Export Analysis (Value and Volume) 2019 & 2032
                                                                                                                          100. Table 100: Global Limes Market in Mexico Volume Kiloton Forecast, by Export Analysis (Value and Volume) 2019 & 2032
                                                                                                                          101. Table 101: Global Limes Market in Mexico Revenue Million Forecast, by Price Trend Analysis 2019 & 2032
                                                                                                                          102. Table 102: Global Limes Market in Mexico Volume Kiloton Forecast, by Price Trend Analysis 2019 & 2032
                                                                                                                          103. Table 103: Global Limes Market in Mexico Revenue Million Forecast, by Country 2019 & 2032
                                                                                                                          104. Table 104: Global Limes Market in Mexico Volume Kiloton Forecast, by Country 2019 & 2032
                                                                                                                          105. Table 105: United Kingdom Limes Market in Mexico Revenue (Million) Forecast, by Application 2019 & 2032
                                                                                                                          106. Table 106: United Kingdom Limes Market in Mexico Volume (Kiloton) Forecast, by Application 2019 & 2032
                                                                                                                          107. Table 107: Germany Limes Market in Mexico Revenue (Million) Forecast, by Application 2019 & 2032
                                                                                                                          108. Table 108: Germany Limes Market in Mexico Volume (Kiloton) Forecast, by Application 2019 & 2032
                                                                                                                          109. Table 109: France Limes Market in Mexico Revenue (Million) Forecast, by Application 2019 & 2032
                                                                                                                          110. Table 110: France Limes Market in Mexico Volume (Kiloton) Forecast, by Application 2019 & 2032
                                                                                                                          111. Table 111: Italy Limes Market in Mexico Revenue (Million) Forecast, by Application 2019 & 2032
                                                                                                                          112. Table 112: Italy Limes Market in Mexico Volume (Kiloton) Forecast, by Application 2019 & 2032
                                                                                                                          113. Table 113: Spain Limes Market in Mexico Revenue (Million) Forecast, by Application 2019 & 2032
                                                                                                                          114. Table 114: Spain Limes Market in Mexico Volume (Kiloton) Forecast, by Application 2019 & 2032
                                                                                                                          115. Table 115: Russia Limes Market in Mexico Revenue (Million) Forecast, by Application 2019 & 2032
                                                                                                                          116. Table 116: Russia Limes Market in Mexico Volume (Kiloton) Forecast, by Application 2019 & 2032
                                                                                                                          117. Table 117: Benelux Limes Market in Mexico Revenue (Million) Forecast, by Application 2019 & 2032
                                                                                                                          118. Table 118: Benelux Limes Market in Mexico Volume (Kiloton) Forecast, by Application 2019 & 2032
                                                                                                                          119. Table 119: Nordics Limes Market in Mexico Revenue (Million) Forecast, by Application 2019 & 2032
                                                                                                                          120. Table 120: Nordics Limes Market in Mexico Volume (Kiloton) Forecast, by Application 2019 & 2032
                                                                                                                          121. Table 121: Rest of Europe Limes Market in Mexico Revenue (Million) Forecast, by Application 2019 & 2032
                                                                                                                          122. Table 122: Rest of Europe Limes Market in Mexico Volume (Kiloton) Forecast, by Application 2019 & 2032
                                                                                                                          123. Table 123: Global Limes Market in Mexico Revenue Million Forecast, by Production Analysis (Volume) 2019 & 2032
                                                                                                                          124. Table 124: Global Limes Market in Mexico Volume Kiloton Forecast, by Production Analysis (Volume) 2019 & 2032
                                                                                                                          125. Table 125: Global Limes Market in Mexico Revenue Million Forecast, by Consumption Analysis (Value and Volume) 2019 & 2032
                                                                                                                          126. Table 126: Global Limes Market in Mexico Volume Kiloton Forecast, by Consumption Analysis (Value and Volume) 2019 & 2032
                                                                                                                          127. Table 127: Global Limes Market in Mexico Revenue Million Forecast, by Import Analysis (Value and Volume) 2019 & 2032
                                                                                                                          128. Table 128: Global Limes Market in Mexico Volume Kiloton Forecast, by Import Analysis (Value and Volume) 2019 & 2032
                                                                                                                          129. Table 129: Global Limes Market in Mexico Revenue Million Forecast, by Export Analysis (Value and Volume) 2019 & 2032
                                                                                                                          130. Table 130: Global Limes Market in Mexico Volume Kiloton Forecast, by Export Analysis (Value and Volume) 2019 & 2032
                                                                                                                          131. Table 131: Global Limes Market in Mexico Revenue Million Forecast, by Price Trend Analysis 2019 & 2032
                                                                                                                          132. Table 132: Global Limes Market in Mexico Volume Kiloton Forecast, by Price Trend Analysis 2019 & 2032
                                                                                                                          133. Table 133: Global Limes Market in Mexico Revenue Million Forecast, by Production Analysis (Volume) 2019 & 2032
                                                                                                                          134. Table 134: Global Limes Market in Mexico Volume Kiloton Forecast, by Production Analysis (Volume) 2019 & 2032
                                                                                                                          135. Table 135: Global Limes Market in Mexico Revenue Million Forecast, by Consumption Analysis (Value and Volume) 2019 & 2032
                                                                                                                          136. Table 136: Global Limes Market in Mexico Volume Kiloton Forecast, by Consumption Analysis (Value and Volume) 2019 & 2032
                                                                                                                          137. Table 137: Global Limes Market in Mexico Revenue Million Forecast, by Import Analysis (Value and Volume) 2019 & 2032
                                                                                                                          138. Table 138: Global Limes Market in Mexico Volume Kiloton Forecast, by Import Analysis (Value and Volume) 2019 & 2032
                                                                                                                          139. Table 139: Global Limes Market in Mexico Revenue Million Forecast, by Export Analysis (Value and Volume) 2019 & 2032
                                                                                                                          140. Table 140: Global Limes Market in Mexico Volume Kiloton Forecast, by Export Analysis (Value and Volume) 2019 & 2032
                                                                                                                          141. Table 141: Global Limes Market in Mexico Revenue Million Forecast, by Price Trend Analysis 2019 & 2032
                                                                                                                          142. Table 142: Global Limes Market in Mexico Volume Kiloton Forecast, by Price Trend Analysis 2019 & 2032
                                                                                                                          143. Table 143: Global Limes Market in Mexico Revenue Million Forecast, by Country 2019 & 2032
                                                                                                                          144. Table 144: Global Limes Market in Mexico Volume Kiloton Forecast, by Country 2019 & 2032
                                                                                                                          145. Table 145: Turkey Limes Market in Mexico Revenue (Million) Forecast, by Application 2019 & 2032
                                                                                                                          146. Table 146: Turkey Limes Market in Mexico Volume (Kiloton) Forecast, by Application 2019 & 2032
                                                                                                                          147. Table 147: Israel Limes Market in Mexico Revenue (Million) Forecast, by Application 2019 & 2032
                                                                                                                          148. Table 148: Israel Limes Market in Mexico Volume (Kiloton) Forecast, by Application 2019 & 2032
                                                                                                                          149. Table 149: GCC Limes Market in Mexico Revenue (Million) Forecast, by Application 2019 & 2032
                                                                                                                          150. Table 150: GCC Limes Market in Mexico Volume (Kiloton) Forecast, by Application 2019 & 2032
                                                                                                                          151. Table 151: North Africa Limes Market in Mexico Revenue (Million) Forecast, by Application 2019 & 2032
                                                                                                                          152. Table 152: North Africa Limes Market in Mexico Volume (Kiloton) Forecast, by Application 2019 & 2032
                                                                                                                          153. Table 153: South Africa Limes Market in Mexico Revenue (Million) Forecast, by Application 2019 & 2032
                                                                                                                          154. Table 154: South Africa Limes Market in Mexico Volume (Kiloton) Forecast, by Application 2019 & 2032
                                                                                                                          155. Table 155: Rest of Middle East & Africa Limes Market in Mexico Revenue (Million) Forecast, by Application 2019 & 2032
                                                                                                                          156. Table 156: Rest of Middle East & Africa Limes Market in Mexico Volume (Kiloton) Forecast, by Application 2019 & 2032
                                                                                                                          157. Table 157: Global Limes Market in Mexico Revenue Million Forecast, by Production Analysis (Volume) 2019 & 2032
                                                                                                                          158. Table 158: Global Limes Market in Mexico Volume Kiloton Forecast, by Production Analysis (Volume) 2019 & 2032
                                                                                                                          159. Table 159: Global Limes Market in Mexico Revenue Million Forecast, by Consumption Analysis (Value and Volume) 2019 & 2032
                                                                                                                          160. Table 160: Global Limes Market in Mexico Volume Kiloton Forecast, by Consumption Analysis (Value and Volume) 2019 & 2032
                                                                                                                          161. Table 161: Global Limes Market in Mexico Revenue Million Forecast, by Import Analysis (Value and Volume) 2019 & 2032
                                                                                                                          162. Table 162: Global Limes Market in Mexico Volume Kiloton Forecast, by Import Analysis (Value and Volume) 2019 & 2032
                                                                                                                          163. Table 163: Global Limes Market in Mexico Revenue Million Forecast, by Export Analysis (Value and Volume) 2019 & 2032
                                                                                                                          164. Table 164: Global Limes Market in Mexico Volume Kiloton Forecast, by Export Analysis (Value and Volume) 2019 & 2032
                                                                                                                          165. Table 165: Global Limes Market in Mexico Revenue Million Forecast, by Price Trend Analysis 2019 & 2032
                                                                                                                          166. Table 166: Global Limes Market in Mexico Volume Kiloton Forecast, by Price Trend Analysis 2019 & 2032
                                                                                                                          167. Table 167: Global Limes Market in Mexico Revenue Million Forecast, by Production Analysis (Volume) 2019 & 2032
                                                                                                                          168. Table 168: Global Limes Market in Mexico Volume Kiloton Forecast, by Production Analysis (Volume) 2019 & 2032
                                                                                                                          169. Table 169: Global Limes Market in Mexico Revenue Million Forecast, by Consumption Analysis (Value and Volume) 2019 & 2032
                                                                                                                          170. Table 170: Global Limes Market in Mexico Volume Kiloton Forecast, by Consumption Analysis (Value and Volume) 2019 & 2032
                                                                                                                          171. Table 171: Global Limes Market in Mexico Revenue Million Forecast, by Import Analysis (Value and Volume) 2019 & 2032
                                                                                                                          172. Table 172: Global Limes Market in Mexico Volume Kiloton Forecast, by Import Analysis (Value and Volume) 2019 & 2032
                                                                                                                          173. Table 173: Global Limes Market in Mexico Revenue Million Forecast, by Export Analysis (Value and Volume) 2019 & 2032
                                                                                                                          174. Table 174: Global Limes Market in Mexico Volume Kiloton Forecast, by Export Analysis (Value and Volume) 2019 & 2032
                                                                                                                          175. Table 175: Global Limes Market in Mexico Revenue Million Forecast, by Price Trend Analysis 2019 & 2032
                                                                                                                          176. Table 176: Global Limes Market in Mexico Volume Kiloton Forecast, by Price Trend Analysis 2019 & 2032
                                                                                                                          177. Table 177: Global Limes Market in Mexico Revenue Million Forecast, by Country 2019 & 2032
                                                                                                                          178. Table 178: Global Limes Market in Mexico Volume Kiloton Forecast, by Country 2019 & 2032
                                                                                                                          179. Table 179: China Limes Market in Mexico Revenue (Million) Forecast, by Application 2019 & 2032
                                                                                                                          180. Table 180: China Limes Market in Mexico Volume (Kiloton) Forecast, by Application 2019 & 2032
                                                                                                                          181. Table 181: India Limes Market in Mexico Revenue (Million) Forecast, by Application 2019 & 2032
                                                                                                                          182. Table 182: India Limes Market in Mexico Volume (Kiloton) Forecast, by Application 2019 & 2032
                                                                                                                          183. Table 183: Japan Limes Market in Mexico Revenue (Million) Forecast, by Application 2019 & 2032
                                                                                                                          184. Table 184: Japan Limes Market in Mexico Volume (Kiloton) Forecast, by Application 2019 & 2032
                                                                                                                          185. Table 185: South Korea Limes Market in Mexico Revenue (Million) Forecast, by Application 2019 & 2032
                                                                                                                          186. Table 186: South Korea Limes Market in Mexico Volume (Kiloton) Forecast, by Application 2019 & 2032
                                                                                                                          187. Table 187: ASEAN Limes Market in Mexico Revenue (Million) Forecast, by Application 2019 & 2032
                                                                                                                          188. Table 188: ASEAN Limes Market in Mexico Volume (Kiloton) Forecast, by Application 2019 & 2032
                                                                                                                          189. Table 189: Oceania Limes Market in Mexico Revenue (Million) Forecast, by Application 2019 & 2032
                                                                                                                          190. Table 190: Oceania Limes Market in Mexico Volume (Kiloton) Forecast, by Application 2019 & 2032
                                                                                                                          191. Table 191: Rest of Asia Pacific Limes Market in Mexico Revenue (Million) Forecast, by Application 2019 & 2032
                                                                                                                          192. Table 192: Rest of Asia Pacific Limes Market in Mexico Volume (Kiloton) Forecast, by Application 2019 & 2032


                                                                                                                          Frequently Asked Questions

                                                                                                                          1. What is the projected Compound Annual Growth Rate (CAGR) of the Limes Market in Mexico?

                                                                                                                          The projected CAGR is approximately 4.10%.

                                                                                                                          2. Which companies are prominent players in the Limes Market in Mexico?

                                                                                                                          Key companies in the market include Syngenta , Bayer CropScience, Monsanto , Grupo Mexico .

                                                                                                                          3. What are the main segments of the Limes Market in Mexico?

                                                                                                                          The market segments include Production Analysis (Volume), Consumption Analysis (Value and Volume), Import Analysis (Value and Volume), Export Analysis (Value and Volume), Price Trend Analysis, Production Analysis (Volume), Consumption Analysis (Value and Volume), Import Analysis (Value and Volume), Export Analysis (Value and Volume), Price Trend Analysis.

                                                                                                                          4. Can you provide details about the market size?

                                                                                                                          The market size is estimated to be USD XXX Million as of 2022.

                                                                                                                          5. What are some drivers contributing to market growth?

                                                                                                                          Rising Demand for Milled and Broken Rice; Growing Preference for Speciality Rice Variety; Government Initiatives Supports Rice Production.

                                                                                                                          6. What are the notable trends driving market growth?

                                                                                                                          Increased Production in Mexico.

                                                                                                                          7. Are there any restraints impacting market growth?

                                                                                                                          Lack of Supply Chain for Rice; Growing Agricultural Labor Crisis.

                                                                                                                          8. Can you provide examples of recent developments in the market?

                                                                                                                          April 2022: Grupo Mexico builds a new plant with a production capacity of 600 metric tons per day in Sonora, Mexico, and is the largest lime plant in the country. This plant will reduce approximately 50% of the current cost of lime in its Mexican operations.

                                                                                                                          9. What pricing options are available for accessing the report?

                                                                                                                          Pricing options include single-user, multi-user, and enterprise licenses priced at USD 3800, USD 4500, and USD 5800 respectively.

                                                                                                                          10. Is the market size provided in terms of value or volume?

                                                                                                                          The market size is provided in terms of value, measured in Million and volume, measured in Kiloton.

                                                                                                                          11. Are there any specific market keywords associated with the report?

                                                                                                                          Yes, the market keyword associated with the report is "Limes Market in Mexico," which aids in identifying and referencing the specific market segment covered.

                                                                                                                          12. How do I determine which pricing option suits my needs best?

                                                                                                                          The pricing options vary based on user requirements and access needs. Individual users may opt for single-user licenses, while businesses requiring broader access may choose multi-user or enterprise licenses for cost-effective access to the report.

                                                                                                                          13. Are there any additional resources or data provided in the Limes Market in Mexico report?

                                                                                                                          While the report offers comprehensive insights, it's advisable to review the specific contents or supplementary materials provided to ascertain if additional resources or data are available.

                                                                                                                          14. How can I stay updated on further developments or reports in the Limes Market in Mexico?

                                                                                                                          To stay informed about further developments, trends, and reports in the Limes Market in Mexico, consider subscribing to industry newsletters, following relevant companies and organizations, or regularly checking reputable industry news sources and publications.


                                                                                                                          Methodology

                                                                                                                          Step 1 - Identification of Relevant Samples Size from Population Database

                                                                                                                          Step Chart
                                                                                                                          Bar Chart
                                                                                                                          Method Chart

                                                                                                                          Step 2 - Approaches for Defining Global Market Size (Value, Volume* & Price*)

                                                                                                                          Approach Chart
                                                                                                                          Top-down and bottom-up approaches are used to validate the global market size and estimate the market size for manufactures, regional segments, product, and application.

                                                                                                                          Note*: In applicable scenarios

                                                                                                                          Step 3 - Data Sources

                                                                                                                          Primary Research

                                                                                                                          • Web Analytics
                                                                                                                          • Survey Reports
                                                                                                                          • Research Institute
                                                                                                                          • Latest Research Reports
                                                                                                                          • Opinion Leaders

                                                                                                                          Secondary Research

                                                                                                                          • Annual Reports
                                                                                                                          • White Paper
                                                                                                                          • Latest Press Release
                                                                                                                          • Industry Association
                                                                                                                          • Paid Database
                                                                                                                          • Investor Presentations
                                                                                                                          Analyst Chart

                                                                                                                          Step 4 - Data Triangulation

                                                                                                                          Involves using different sources of information in order to increase the validity of a study

                                                                                                                          These sources are likely to be stakeholders in a program - participants, other researchers, program staff, other community members, and so on.

                                                                                                                          Then we put all data in single framework & apply various statistical tools to find out the dynamic on the market.

                                                                                                                          During the analysis stage, feedback from the stakeholder groups would be compared to determine areas of agreement as well as areas of divergence

                                                                                                                          Additionally, after gathering mixed and scattered data from a wide range of sources, data is triangulated and correlated to come up with estimated figures which are further validated through primary mediums or industry experts, opinion leaders.

                                                                                                                          About Research Axiom

                                                                                                                          Research Axiom delivers in-depth market research, industry analysis, and consulting for pharmaceuticals, automotive, IT, and consumer goods. Our reports provide the clarity you need to make informed decisions and drive innovation.

                                                                                                                          Our team combines primary research, advanced analytics, and sector expertise to deliver actionable intelligence. We offer syndicated reports, custom research, and consulting services tailored to your business needs.

                                                                                                                          At Research Axiom, we are committed to quality, transparency, and client satisfaction. Every report is rigorously validated to ensure accuracy and relevance. Our global perspective and local expertise help you understand both the big picture and the finer details of your market.

                                                                                                                          Stay informed with Research Axiom. Subscribe to our newsletter for the latest updates and research highlights, and follow us on social media for real-time insights. Research Axiom – Turning Data into Business Advantage.

                                                                                                                          artwork spiralartwork spiralRelated Reports
                                                                                                                          artwork underline

                                                                                                                          Qatar Aquaculture and Fisheries Market Analysis Uncovered: Market Drivers and Forecasts 2025-2033

                                                                                                                          Discover the booming Qatar aquaculture and fisheries market, projected to reach \$252.74 million by 2033 with a 5% CAGR. This in-depth analysis covers market size, key players (Al-Khaleej Seafoods, Al Rayan Shrimp Trading), segments (pelagic fish, shrimp, caviar), and future growth drivers.

                                                                                                                          July 2025
                                                                                                                          Base Year: 2024
                                                                                                                          No Of Pages: 150
                                                                                                                          Price: $3800

                                                                                                                          U.S. Maize Industry Market Trends and Strategic Roadmap

                                                                                                                          Discover the dynamic U.S. maize industry outlook with our comprehensive market analysis. Explore key trends, regional breakdowns, and leading companies shaping this multi-billion dollar sector. Projecting steady growth through 2033, understand the factors driving expansion and the challenges ahead for maize producers and stakeholders.

                                                                                                                          July 2025
                                                                                                                          Base Year: 2024
                                                                                                                          No Of Pages: 180
                                                                                                                          Price: $3800

                                                                                                                          Alfalfa Hay Market in Italy Future-proof Strategies: Trends, Competitor Dynamics, and Opportunities 2025-2033

                                                                                                                          Discover the latest insights into Italy's thriving alfalfa hay market. Explore market size, CAGR, key drivers, trends, and competitive landscape analysis for 2025-2033. Learn about segment growth in bales, pellets, and cubes across animal feed applications.

                                                                                                                          July 2025
                                                                                                                          Base Year: 2024
                                                                                                                          No Of Pages: 150
                                                                                                                          Price: $3800

                                                                                                                          India Biopesticides Industry Market Disruption: Competitor Insights and Trends 2025-2033

                                                                                                                          The India biopesticides market is booming, projected to reach ₹237.3 Billion (USD 2847.6 million) by 2033, driven by growing demand for sustainable agriculture and stricter regulations. Learn about key market trends, leading companies, and regional growth forecasts in this comprehensive analysis.

                                                                                                                          July 2025
                                                                                                                          Base Year: 2024
                                                                                                                          No Of Pages: 197
                                                                                                                          Price: $3800

                                                                                                                          Decoding Almond Market Consumer Preferences 2025-2033

                                                                                                                          Discover the booming almond market! Explore its $10.12B valuation (2025), 5.55% CAGR, key drivers, trends, and regional insights. Learn about leading companies and diverse product types including almond butter, flour, and oil. Uncover future growth projections for the almond industry until 2033.

                                                                                                                          July 2025
                                                                                                                          Base Year: 2024
                                                                                                                          No Of Pages: 234
                                                                                                                          Price: $4750

                                                                                                                          Bio Organic Fertilizer Market Insightful Market Analysis: Trends and Opportunities 2025-2033

                                                                                                                          The global bio organic fertilizer market is booming, projected to reach [estimated 2033 value] by 2033 with a CAGR of 5.90%. Discover key market trends, drivers, restraints, and leading companies shaping this sustainable agriculture sector. Learn more about organic fertilizer types, applications, and regional market analysis.

                                                                                                                          July 2025
                                                                                                                          Base Year: 2024
                                                                                                                          No Of Pages: 150
                                                                                                                          Price: $4750

                                                                                                                          Exploring Saudi Arabia Agriculture Market’s Market Size Dynamics 2025-2033

                                                                                                                          Discover the booming Saudi Arabia agriculture market! Projected to reach \$28.3 billion by 2033 with a 5.2% CAGR, this report analyzes market size, key players (Carrefour, Lulu Group), regional trends, and growth drivers. Learn about opportunities and challenges in this dynamic sector.

                                                                                                                          July 2025
                                                                                                                          Base Year: 2024
                                                                                                                          No Of Pages: 197
                                                                                                                          Price: $3800

                                                                                                                          Lentil Industry Charting Growth Trajectories 2025-2033: Strategic Insights and Forecasts

                                                                                                                          Discover the booming lentil market! Explore key trends, regional insights, and leading companies driving growth in this $X billion industry (2025 estimate) projected to reach $X billion by 2033. Learn about the rising demand for whole, split, and dehulled lentils in dry, canned, and frozen forms. Get the complete market analysis now!

                                                                                                                          July 2025
                                                                                                                          Base Year: 2024
                                                                                                                          No Of Pages: 234
                                                                                                                          Price: $4750

                                                                                                                          USA Agricultural Irrigation Machinery Market Soars to XXX Million, witnessing a CAGR of XX during the forecast period 2025-2033

                                                                                                                          Discover the booming US agricultural irrigation machinery market! This in-depth analysis reveals key trends, growth drivers, and leading companies from 2025-2033. Learn about the impact of precision agriculture, water scarcity, and government initiatives on the market's future. Explore segments like drip, sprinkler, and pivot irrigation systems.

                                                                                                                          July 2025
                                                                                                                          Base Year: 2024
                                                                                                                          No Of Pages: 150
                                                                                                                          Price: $3800

                                                                                                                          South America Biological Organic Fertilizers Industry 2025 to Grow at XX CAGR with XXX Million Market Size: Analysis and Forecasts 2033

                                                                                                                          Discover the booming South American biological organic fertilizer market! Projected to reach [estimated 2033 value based on CAGR] by 2033, this market is driven by sustainable agriculture trends and growing demand for eco-friendly farming. Learn about key players, market segments (cereals, legumes, fruits & vegetables), and growth opportunities in Brazil, Argentina, and beyond.

                                                                                                                          July 2025
                                                                                                                          Base Year: 2024
                                                                                                                          No Of Pages: 150
                                                                                                                          Price: $4750

                                                                                                                          Exploring Barriers in North American Olives Market Market: Trends and Analysis 2025-2033

                                                                                                                          Discover the booming North American olives market! This comprehensive analysis reveals a $6.9B market with a 5.74% CAGR (2025-2033), driven by health trends & Mediterranean diet popularity. Explore market segmentation, key players (Napa Valley Olive Oil, Musco Family Olive Co., etc.), and future growth projections for olive oil, table olives, and more.

                                                                                                                          July 2025
                                                                                                                          Base Year: 2024
                                                                                                                          No Of Pages: 180
                                                                                                                          Price: $4750

                                                                                                                          Analyzing Competitor Moves: Iran Agricultural Sector Analysis Growth Outlook 2025-2033

                                                                                                                          Discover the growth opportunities and challenges within Iran's agricultural sector. This comprehensive analysis covers market size, CAGR, key drivers, trends, and regional variations across food crops, cash crops, fruits, vegetables, dairy, and fishery from 2019-2033. Gain valuable insights into this dynamic market.

                                                                                                                          July 2025
                                                                                                                          Base Year: 2024
                                                                                                                          No Of Pages: 150
                                                                                                                          Price: $3800

                                                                                                                          South America Agricultual Films Market Market’s Drivers and Challenges: Strategic Overview 2025-2033

                                                                                                                          Discover the booming South American agricultural films market! This in-depth analysis reveals a CAGR of 6.10% to 2033, driven by growing demand for modern farming techniques and food security. Explore key trends, leading companies (Dow, Agroflex, etc.), and regional insights for Brazil, Argentina, and beyond. Learn how this expanding market presents lucrative opportunities.

                                                                                                                          July 2025
                                                                                                                          Base Year: 2024
                                                                                                                          No Of Pages: 150
                                                                                                                          Price: $4750

                                                                                                                          Analyzing Coffee Trade Analysis Industry: Opportunities and Growth Patterns 2025-2033

                                                                                                                          Discover the latest insights into the booming global coffee trade market. This comprehensive analysis reveals key trends, growth drivers, and market segmentation for Arabica, Robusta, and various coffee processing methods. Explore regional market shares and leading companies like Starbucks & Nestlé. Project your business strategy with our 2025-2033 forecast.

                                                                                                                          July 2025
                                                                                                                          Base Year: 2024
                                                                                                                          No Of Pages: 150
                                                                                                                          Price: $4750

                                                                                                                          Kiwi Fruit Market Insightful Market Analysis: Trends and Opportunities 2025-2033

                                                                                                                          Discover the booming kiwi fruit market! This comprehensive analysis reveals a $1.89B market in 2025, projected to reach significant heights by 2033 with a 5.02% CAGR. Explore key drivers, regional trends, and leading companies shaping this dynamic industry.

                                                                                                                          July 2025
                                                                                                                          Base Year: 2024
                                                                                                                          No Of Pages: 180
                                                                                                                          Price: $4750

                                                                                                                          Africa Chia Seeds Industry: Growth Opportunities and Competitive Landscape Overview 2025-2033

                                                                                                                          Discover the booming Africa chia seeds market! Explore its $13.87M valuation (2025), 2.10% CAGR, key segments (organic, food & beverage, supplements), and leading companies. Learn about growth drivers, trends, and regional insights (South Africa, UAE) in this comprehensive market analysis.

                                                                                                                          July 2025
                                                                                                                          Base Year: 2024
                                                                                                                          No Of Pages: 180
                                                                                                                          Price: $4750

                                                                                                                          China Pesticide Industry Market Report: Strategic Insights

                                                                                                                          Discover the booming China pesticide market, projected to reach $XX million by 2025 and grow at a CAGR of 6.60% until 2033. Analyze key trends, leading companies (Bayer, Syngenta, UPL), and market segmentation (fungicides, herbicides, insecticides, etc.) impacting this dynamic sector.

                                                                                                                          July 2025
                                                                                                                          Base Year: 2024
                                                                                                                          No Of Pages: 197
                                                                                                                          Price: $3800

                                                                                                                          Global Metal Chelates Market Future-proof Strategies: Trends, Competitor Dynamics, and Opportunities 2025-2033

                                                                                                                          Discover the booming global metal chelates market! This comprehensive analysis reveals a CAGR of 10.20%, driven by surging demand for efficient micronutrient delivery in agriculture. Explore market size, segmentation (crop type, product type, application), key players, and regional trends for 2025-2033.

                                                                                                                          July 2025
                                                                                                                          Base Year: 2024
                                                                                                                          No Of Pages: 197
                                                                                                                          Price: $3800

                                                                                                                          Fresh Cherries Industry CAGR Trends: Growth Outlook 2025-2033

                                                                                                                          Discover the booming fresh cherries market! This in-depth analysis reveals key trends, drivers, and restraints, along with regional market share data and projections to 2033. Learn about leading companies and explore growth opportunities in this lucrative sector.

                                                                                                                          July 2025
                                                                                                                          Base Year: 2024
                                                                                                                          No Of Pages: 180
                                                                                                                          Price: $4750

                                                                                                                          North American Wheat Seed Treatment 2025 Market Trends and 2033 Forecasts: Exploring Growth Potential

                                                                                                                          Discover the booming North American wheat seed treatment market! Learn about key growth drivers, emerging trends, major players like Bayer and Syngenta, and the projected CAGR of 7.30% through 2033. Explore market segmentation by product type, application, and crop type in this comprehensive analysis.

                                                                                                                          July 2025
                                                                                                                          Base Year: 2024
                                                                                                                          No Of Pages: 197
                                                                                                                          Price: $3800
                                                                                                                          • Home
                                                                                                                          • About Us
                                                                                                                          • Industries
                                                                                                                            • Aerospace & Defense
                                                                                                                            • Agriculture
                                                                                                                            • Animal Nutrition & Wellness
                                                                                                                            • Automotive
                                                                                                                            • Chemicals & Materials
                                                                                                                            • Consumer Goods and Services
                                                                                                                            • Energy & Power
                                                                                                                            • Financial Services and Investment Intelligence
                                                                                                                            • Food & Beverage
                                                                                                                            • Home and Property Improvement
                                                                                                                            • Hospitality and Tourism
                                                                                                                            • Logistics
                                                                                                                            • Manufacturing Products and Services
                                                                                                                            • Packaging
                                                                                                                            • Professional and Commercial Services
                                                                                                                            • Real Estate and Construction
                                                                                                                            • Retail
                                                                                                                            • Technology, Media and Telecom
                                                                                                                            • Healthcare
                                                                                                                          • Services
                                                                                                                          • Contact
                                                                                                                          Main Logo
                                                                                                                          • Home
                                                                                                                          • About Us
                                                                                                                          • Industries
                                                                                                                            • Aerospace & Defense
                                                                                                                            • Agriculture
                                                                                                                            • Animal Nutrition & Wellness
                                                                                                                            • Automotive
                                                                                                                            • Chemicals & Materials
                                                                                                                            • Consumer Goods and Services
                                                                                                                            • Energy & Power
                                                                                                                            • Financial Services and Investment Intelligence
                                                                                                                            • Food & Beverage
                                                                                                                            • Home and Property Improvement
                                                                                                                            • Hospitality and Tourism
                                                                                                                            • Logistics
                                                                                                                            • Manufacturing Products and Services
                                                                                                                            • Packaging
                                                                                                                            • Professional and Commercial Services
                                                                                                                            • Real Estate and Construction
                                                                                                                            • Retail
                                                                                                                            • Technology, Media and Telecom
                                                                                                                            • Healthcare
                                                                                                                          • Services
                                                                                                                          • Contact
                                                                                                                          +17162654855
                                                                                                                          [email protected]

                                                                                                                          +17162654855

                                                                                                                          [email protected]

                                                                                                                          Business Address

                                                                                                                          Head Office

                                                                                                                          Office no. A 5010, fifth floor, Solitaire Business Hub, Near Phoenix mall, Pune, Maharashtra 411014

                                                                                                                          Contact Information

                                                                                                                          Craig Francis

                                                                                                                          Business Development Head

                                                                                                                          +17162654855

                                                                                                                          [email protected]

                                                                                                                          Connect With Us

                                                                                                                          Secure Payment Partners

                                                                                                                          payment image
                                                                                                                          RetailLogisticsPackagingAutomotiveHealthcareAgricultureEnergy & PowerFood & BeverageAerospace & DefenseChemicals & MaterialsHospitality and TourismAnimal Nutrition & WellnessConsumer Goods and ServicesReal Estate and ConstructionHome and Property ImprovementTechnology, Media and TelecomManufacturing Products and ServicesFinancial Services and Investment Intelligence

                                                                                                                          © 2025 All rights reserved


                                                                                                                          Privacy Policy
                                                                                                                          Terms and Conditions
                                                                                                                          FAQ