

Key Insights
The global Liquefied Petroleum Gas (LPG) market is poised for substantial expansion, projecting a Compound Annual Growth Rate (CAGR) of 3.9%. This growth trajectory, from a market size of 123.14 billion in the base year of 2024, is propelled by increasing urbanization, industrial development, and the growing adoption of LPG as a cleaner energy alternative. Key demand drivers include its use in residential cooking, industrial processes, and the automotive sector, particularly in regions with developing energy infrastructure. Favorable government policies promoting cleaner fuels and reducing reliance on traditional biomass further bolster market penetration. While price volatility and environmental considerations present challenges, technological advancements in efficiency and emission reduction are actively mitigating these risks. The market segmentation indicates crude oil as the primary production source, with residential applications dominating consumption, though industrial and automotive segments exhibit robust growth potential. Major industry players are actively pursuing strategic investments in expansion and diversification to capitalize on emerging opportunities.
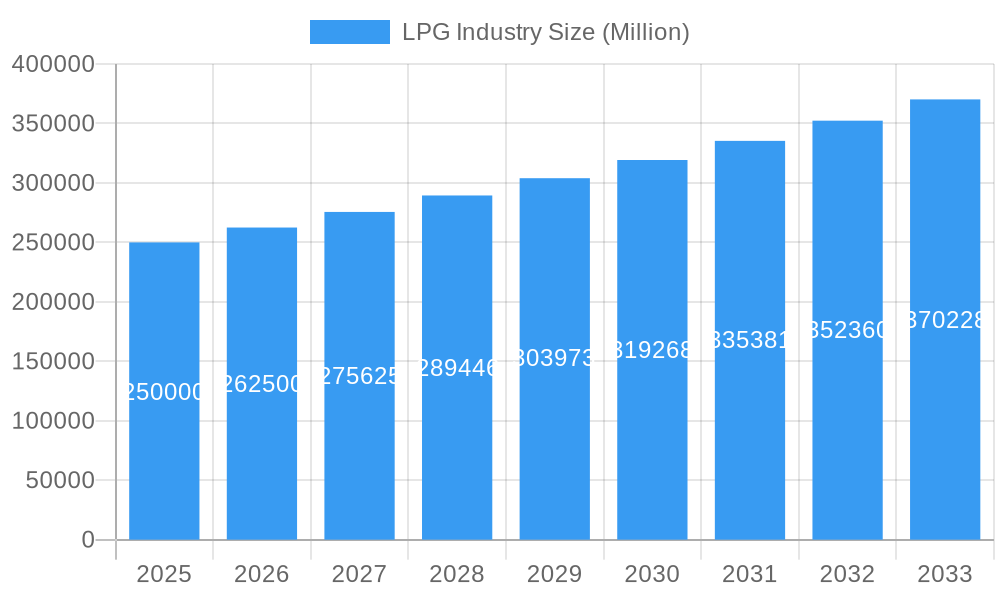
LPG Industry Market Size (In Billion)
Geographically, North America and Europe represent established markets with significant contributions from industrial applications. However, the highest growth rates are forecasted for the Asia-Pacific and Middle East & Africa regions, attributed to population growth, rising disposable incomes, and supportive government initiatives. South America also shows promising demand from residential and industrial sectors. The forecast period is expected to see industry consolidation, with strategic acquisitions enhancing market positions and global reach. Continued technological innovation in LPG storage, transportation, and utilization will be pivotal in shaping the industry's future. The LPG market offers significant investment potential, driven by sustained demand and ongoing innovation throughout the value chain.
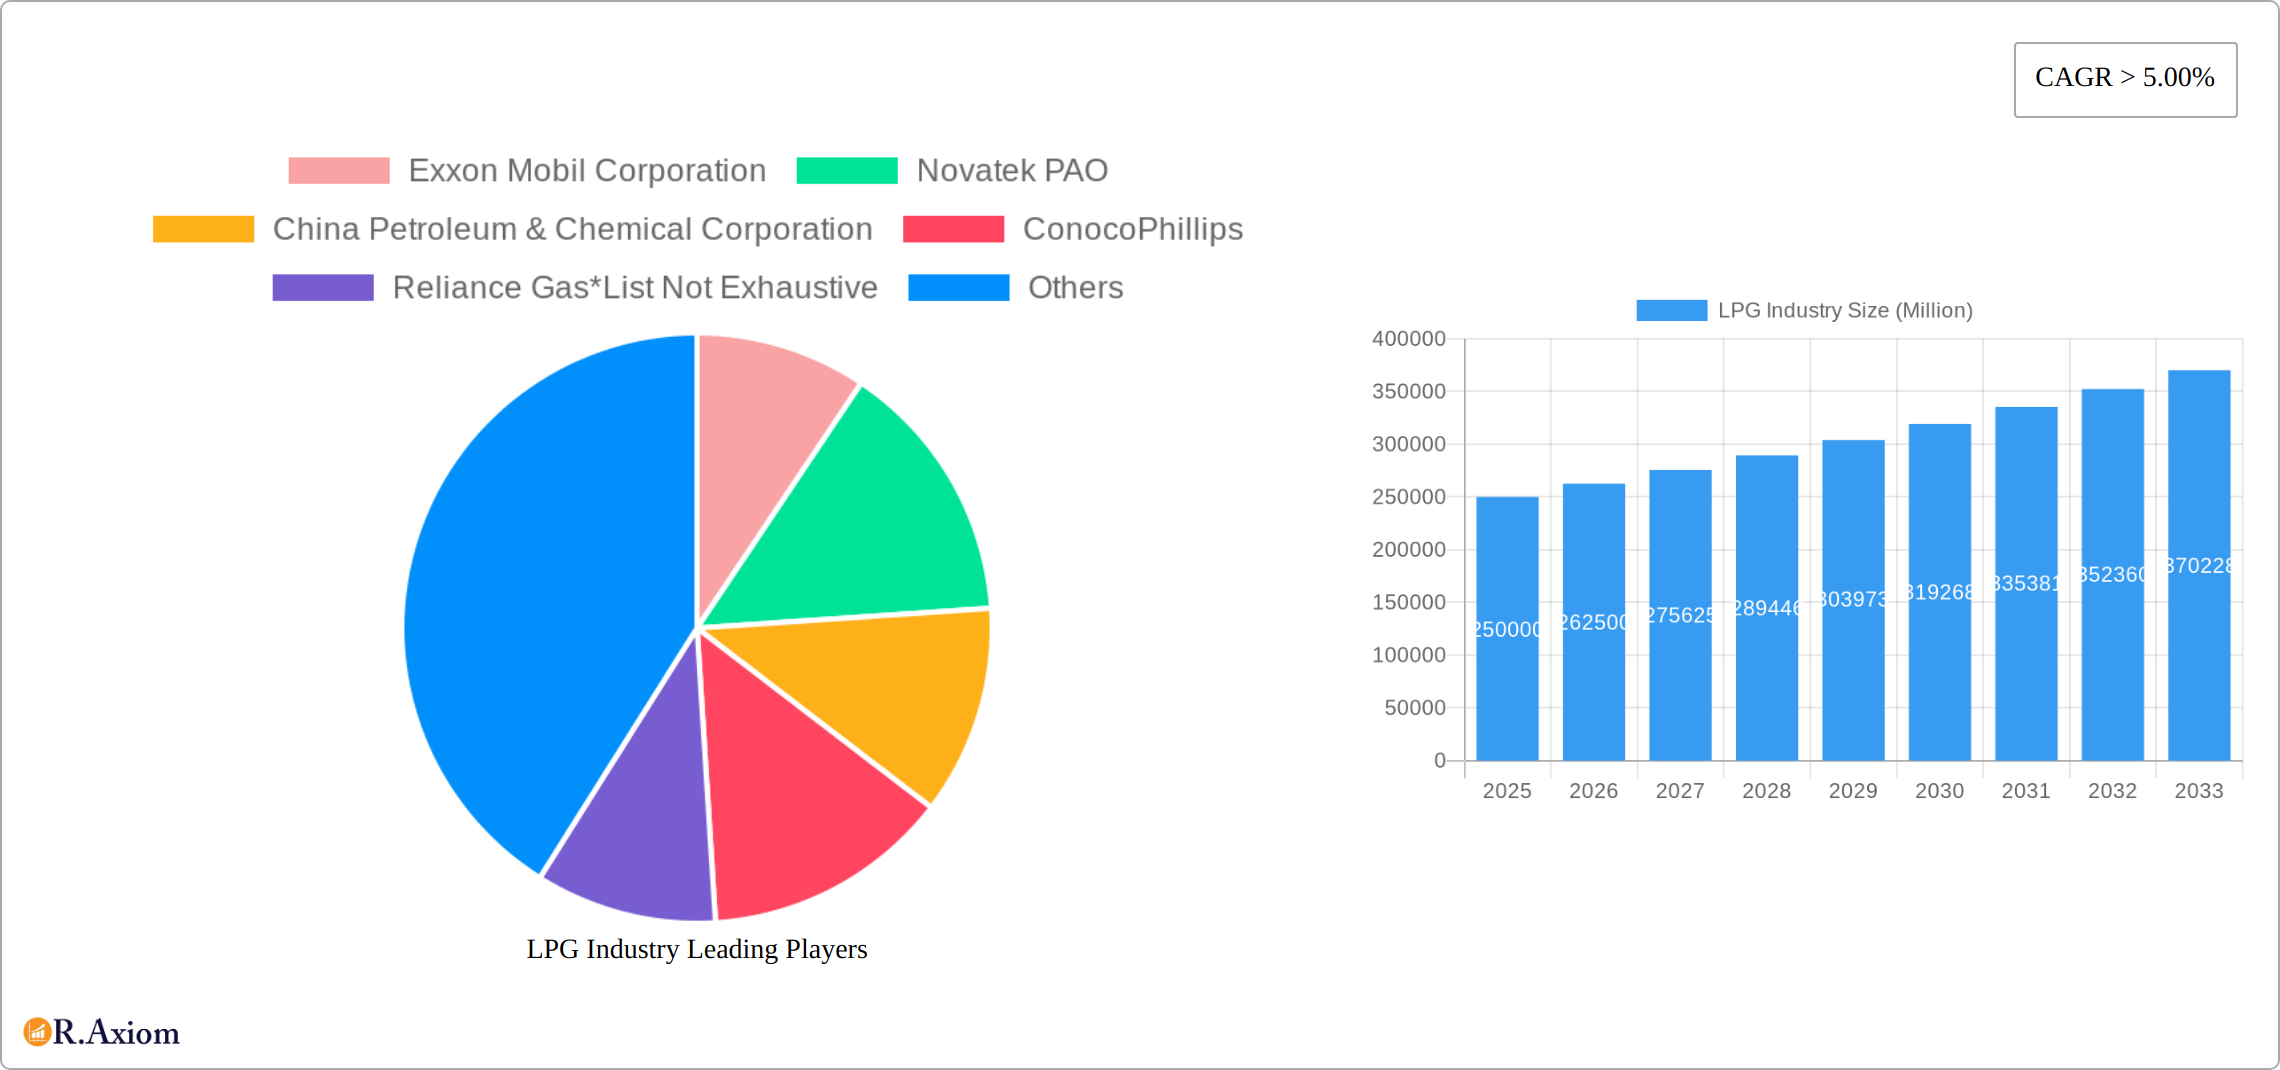
LPG Industry Company Market Share
LPG Industry: A Comprehensive Market Report (2019-2033)
This in-depth report provides a comprehensive analysis of the global Liquefied Petroleum Gas (LPG) industry, covering market dynamics, key players, and future growth prospects. The study period spans from 2019 to 2033, with 2025 serving as both the base and estimated year. The report utilizes data from the historical period (2019-2024) to forecast market trends from 2025 to 2033, offering valuable insights for industry stakeholders. The report analyzes a market valued at xx Million USD in 2025, projected to reach xx Million USD by 2033, exhibiting a CAGR of xx%.
LPG Industry Market Concentration & Innovation
This section provides a detailed analysis of the competitive landscape within the LPG industry, encompassing market concentration levels, innovation drivers, regulatory frameworks, the presence of product substitutes, evolving end-user trends, and a review of significant mergers and acquisitions (M&A) activities. The analysis offers a comprehensive understanding of the forces shaping market dynamics and future growth.
The global LPG market displays a moderately concentrated structure, with a few dominant players commanding substantial market share. Key players such as ExxonMobil Corporation, Novatek PAO, China Petroleum & Chemical Corporation, and ConocoPhillips are among the leading companies, collectively controlling an estimated xx% of the market in 2025. However, a significant number of regional and smaller players also contribute to a competitive market environment. This balance between established giants and emerging players creates a dynamic and evolving landscape.
Key Aspects Analyzed:
- Market Share Analysis: A granular breakdown of market share distribution across key segments, providing insights into the competitive positioning of leading players and emerging competitors.
- Innovation Drivers: An in-depth examination of technological advancements influencing LPG production, storage, distribution, and transportation, including improvements in safety protocols and the adoption of digital technologies.
- Regulatory Landscape: A thorough evaluation of government policies and regulations impacting LPG production, pricing, distribution, and safety standards across diverse geographical regions, including an assessment of their effects on market access and competitiveness.
- Product Substitutes: A comprehensive assessment of substitute fuels, such as natural gas, biofuels, and renewable energy sources, and their potential impact on LPG demand, incorporating an analysis of cost-competitiveness and environmental considerations.
- End-User Trends: An in-depth analysis of shifting consumption patterns across residential, commercial, industrial, and autofuel sectors, incorporating demographic trends, economic growth, and changes in consumer preferences.
- M&A Activity: A review of significant M&A transactions within the LPG industry during the specified period, including a detailed analysis of deal values, strategic rationale, and the resultant impact on market consolidation and competitive dynamics. For example, the total value of M&A deals within the observed period is estimated at xx Million USD, reflecting the ongoing industry restructuring.
LPG Industry Industry Trends & Insights
This section explores the key trends and insights shaping the LPG industry's growth trajectory, providing a forward-looking perspective. It analyzes the factors driving market expansion, the impact of disruptive technologies on established business models, the evolution of consumer preferences, and the resulting competitive dynamics among key players. The analysis leverages comprehensive market data and expert insights to present a holistic view of current and future market trends.
The analysis incorporates quantitative metrics such as CAGR and market penetration rates to support the assessment of key growth drivers, including the increasing energy demand in developing economies, the influence of environmental regulations on LPG production and usage, and advancements in LPG transportation and storage technologies. Specific examples and case studies will illustrate the impact of these trends on market behavior.
Dominant Markets & Segments in LPG Industry
This section identifies the dominant regions, countries, and market segments within the LPG industry based on the source of production (Crude Oil, Natural Gas Liquids) and application (Residential, Commercial & Industrial, Autofuels, Other Applications). The analysis highlights the key market drivers contributing to the dominance of specific regions or segments, offering a detailed understanding of market share distribution and growth potential.
Dominant Segments and Their Drivers:
- Source of Production: Natural Gas Liquids (NGLs) are projected to maintain their dominance in the LPG source segment due to the increasing extraction of NGLs alongside natural gas production and their lower cost compared to crude oil refining. This trend is expected to continue, driven by technological advancements in NGL extraction and processing.
- Application: While the Residential sector is expected to remain the largest LPG consumer due to its widespread use for cooking and heating in both developed and developing nations, the Industrial sector exhibits considerable potential for growth, fueled by industrial expansion in emerging economies and the increasing adoption of LPG in industrial processes.
Key Drivers:
- Economic Policies: Government subsidies and incentives promoting LPG usage, particularly in developing countries, play a crucial role in shaping market demand and accessibility.
- Infrastructure Development: The expansion of LPG distribution networks and storage facilities significantly enhances accessibility and affordability, contributing to market penetration and growth.
- Technological Advancements: Improvements in LPG storage and handling technologies enhance safety, reduce risks, and improve efficiency, thereby driving market expansion and competitiveness.
LPG Industry Product Developments
This section summarizes recent product innovations, applications, and competitive advantages in the LPG industry. Technological advancements, such as improved cylinder designs, automated filling systems, and enhanced safety features, are continually improving the efficiency, safety, and convenience of LPG usage. These innovations are shaping the competitive landscape by offering superior product features and enhanced value propositions to consumers and industrial clients. The integration of smart technologies in LPG distribution and management further enhances efficiency and supply chain transparency.
Report Scope & Segmentation Analysis
This report segments the LPG market by source of production (Crude Oil and Natural Gas Liquids) and application (Residential, Commercial & Industrial, Autofuels, and Other Applications).
Source of Production: The market is segmented by the primary source of LPG – Crude Oil refining or extraction from Natural Gas Liquids. This segmentation allows analysis of production cost, geographic concentration and environmental impact.
Application: The market is further segmented by end-use applications: Residential, Commercial & Industrial, Autofuels, and Other Applications (e.g., petrochemical feedstock). Each segment's growth projection, market size and competitive dynamics will be analyzed separately to understand specific market needs and opportunities.
Key Drivers of LPG Industry Growth
The growth trajectory of the LPG industry is propelled by a confluence of factors, including the escalating energy demand in developing nations, rapid urbanization, and supportive government policies aimed at promoting LPG as a clean energy source. Significant technological advancements, such as the development of more efficient and safer LPG storage and handling technologies, are contributing significantly to increased market penetration and growth. Furthermore, government initiatives advocating clean cooking fuel alternatives in developing nations further stimulate market demand and create new avenues for growth.
Challenges in the LPG Industry Sector
The LPG industry faces several challenges, including price volatility due to fluctuations in crude oil and natural gas prices, regulatory hurdles relating to safety and environmental regulations, and robust competition from alternative fuels. Supply chain disruptions, especially during geopolitical instability, also affect LPG availability and pricing, impacting the sector's growth trajectory. These factors need mitigation strategies to ensure market stability and sustainable growth.
Emerging Opportunities in LPG Industry
The LPG industry presents several emerging opportunities, including growth in developing economies, increasing demand for LPG in industrial applications, and advancements in LPG technology. The rise of innovative technologies such as smart gas meters and improved LPG storage solutions creates new market opportunities. Exploring new market segments and diversifying applications offer further growth potential.
Leading Players in the LPG Industry Market
Key Developments in LPG Industry Industry
- October 2022: Maire Tecnimont S.p.A. awarded a USD 380 Million EPC contract for an LPG extraction plant in Algeria. This signifies investment in expanding LPG production capacity.
- February 2022: Indian Oil Corp. announced plans to invest USD 43-46 Million in expanding LPG bottling capacity in Northeast India by 53%, reflecting growth in domestic demand.
Strategic Outlook for LPG Industry Market
The LPG industry is poised for sustained growth, primarily driven by the persistent increase in global energy demand, particularly in developing economies experiencing rapid industrialization and population growth. Technological advancements and the exploration of innovative applications will significantly shape the future of the market, leading to enhanced efficiency, improved safety standards, and increased sustainability. Strategic investments in infrastructure development, coupled with expansions into new and emerging markets, will further accelerate the industry's growth trajectory and solidify its position in the global energy landscape.
LPG Industry Segmentation
-
1. Source of Production
- 1.1. Crude Oil
- 1.2. Natural Gas Liquids
-
2. Application
- 2.1. Residential
- 2.2. Commercial & Industrial
- 2.3. Autofuels
- 2.4. Other Applications
LPG Industry Segmentation By Geography
-
1. North America
- 1.1. United States
- 1.2. Canada
- 1.3. Rest of North America
-
2. Europe
- 2.1. Norway
- 2.2. Netherlands
- 2.3. United Kingdom
- 2.4. Germany
- 2.5. Rest of Europe
-
3. Asia Pacific
- 3.1. China
- 3.2. India
- 3.3. South Korea
- 3.4. Japan
- 3.5. Rest of Asia Pacific
-
4. Middle East and Africa
- 4.1. Saudi Arabia
- 4.2. Qatar
- 4.3. South Africa
- 4.4. Rest of Middle East and Africa
-
5. South America
- 5.1. Brazil
- 5.2. Argentina
- 5.3. Chile
- 5.4. Rest of South America
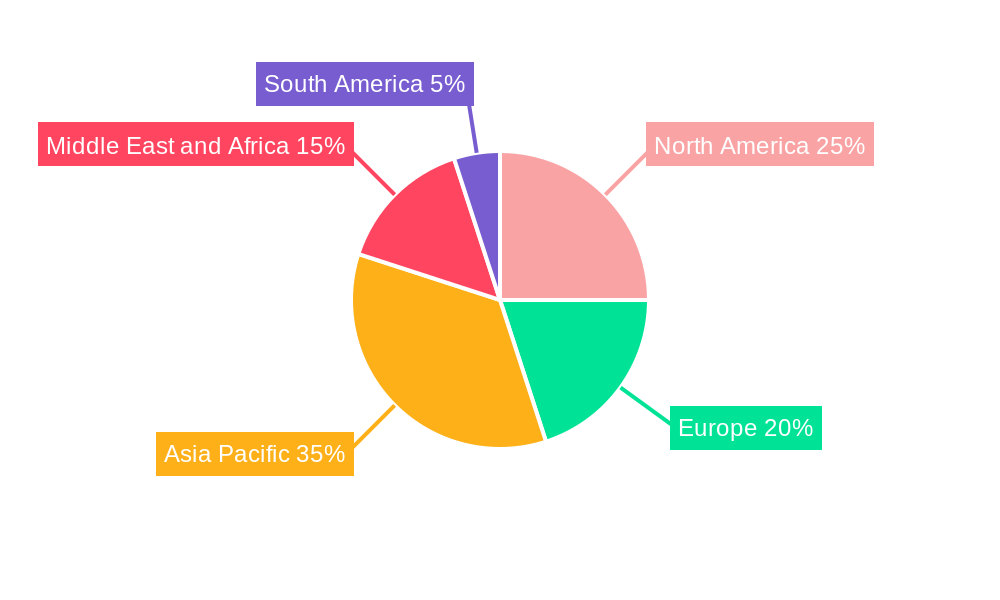
LPG Industry Regional Market Share
Geographic Coverage of LPG Industry
LPG Industry REPORT HIGHLIGHTS
| Aspects | Details |
|---|---|
| Study Period | 2020-2034 |
| Base Year | 2025 |
| Estimated Year | 2026 |
| Forecast Period | 2026-2034 |
| Historical Period | 2020-2025 |
| Growth Rate | CAGR of 3.9% from 2020-2034 |
| Segmentation |
|
Table of Contents
- 1. Introduction
- 1.1. Research Scope
- 1.2. Market Segmentation
- 1.3. Research Objective
- 1.4. Definitions and Assumptions
- 2. Executive Summary
- 2.1. Market Snapshot
- 3. Market Dynamics
- 3.1. Market Drivers
- 3.2. Market Restrains
- 3.3. Market Trends
- 3.4. Market Opportunities
- 4. Market Factor Analysis
- 4.1. Porters Five Forces
- 4.1.1. Bargaining Power of Suppliers
- 4.1.2. Bargaining Power of Buyers
- 4.1.3. Threat of New Entrants
- 4.1.4. Threat of Substitutes
- 4.1.5. Competitive Rivalry
- 4.2. PESTEL analysis
- 4.3. BCG Analysis
- 4.3.1. Stars (High Growth, High Market Share)
- 4.3.2. Cash Cows (Low Growth, High Market Share)
- 4.3.3. Question Mark (High Growth, Low Market Share)
- 4.3.4. Dogs (Low Growth, Low Market Share)
- 4.4. Ansoff Matrix Analysis
- 4.5. Supply Chain Analysis
- 4.6. Regulatory Landscape
- 4.7. Current Market Potential and Opportunity Assessment (TAM–SAM–SOM Framework)
- 4.8. RAX Analyst Note
- 4.1. Porters Five Forces
- 5. Market Analysis, Insights and Forecast 2021-2033
- 5.1. Market Analysis, Insights and Forecast - by Source of Production
- 5.1.1. Crude Oil
- 5.1.2. Natural Gas Liquids
- 5.2. Market Analysis, Insights and Forecast - by Application
- 5.2.1. Residential
- 5.2.2. Commercial & Industrial
- 5.2.3. Autofuels
- 5.2.4. Other Applications
- 5.3. Market Analysis, Insights and Forecast - by Region
- 5.3.1. North America
- 5.3.2. Europe
- 5.3.3. Asia Pacific
- 5.3.4. Middle East and Africa
- 5.3.5. South America
- 5.1. Market Analysis, Insights and Forecast - by Source of Production
- 6. Global LPG Industry Analysis, Insights and Forecast, 2021-2033
- 6.1. Market Analysis, Insights and Forecast - by Source of Production
- 6.1.1. Crude Oil
- 6.1.2. Natural Gas Liquids
- 6.2. Market Analysis, Insights and Forecast - by Application
- 6.2.1. Residential
- 6.2.2. Commercial & Industrial
- 6.2.3. Autofuels
- 6.2.4. Other Applications
- 6.1. Market Analysis, Insights and Forecast - by Source of Production
- 7. North America LPG Industry Analysis, Insights and Forecast, 2020-2032
- 7.1. Market Analysis, Insights and Forecast - by Source of Production
- 7.1.1. Crude Oil
- 7.1.2. Natural Gas Liquids
- 7.2. Market Analysis, Insights and Forecast - by Application
- 7.2.1. Residential
- 7.2.2. Commercial & Industrial
- 7.2.3. Autofuels
- 7.2.4. Other Applications
- 7.1. Market Analysis, Insights and Forecast - by Source of Production
- 8. Europe LPG Industry Analysis, Insights and Forecast, 2020-2032
- 8.1. Market Analysis, Insights and Forecast - by Source of Production
- 8.1.1. Crude Oil
- 8.1.2. Natural Gas Liquids
- 8.2. Market Analysis, Insights and Forecast - by Application
- 8.2.1. Residential
- 8.2.2. Commercial & Industrial
- 8.2.3. Autofuels
- 8.2.4. Other Applications
- 8.1. Market Analysis, Insights and Forecast - by Source of Production
- 9. Asia Pacific LPG Industry Analysis, Insights and Forecast, 2020-2032
- 9.1. Market Analysis, Insights and Forecast - by Source of Production
- 9.1.1. Crude Oil
- 9.1.2. Natural Gas Liquids
- 9.2. Market Analysis, Insights and Forecast - by Application
- 9.2.1. Residential
- 9.2.2. Commercial & Industrial
- 9.2.3. Autofuels
- 9.2.4. Other Applications
- 9.1. Market Analysis, Insights and Forecast - by Source of Production
- 10. Middle East and Africa LPG Industry Analysis, Insights and Forecast, 2020-2032
- 10.1. Market Analysis, Insights and Forecast - by Source of Production
- 10.1.1. Crude Oil
- 10.1.2. Natural Gas Liquids
- 10.2. Market Analysis, Insights and Forecast - by Application
- 10.2.1. Residential
- 10.2.2. Commercial & Industrial
- 10.2.3. Autofuels
- 10.2.4. Other Applications
- 10.1. Market Analysis, Insights and Forecast - by Source of Production
- 11. South America LPG Industry Analysis, Insights and Forecast, 2020-2032
- 11.1. Market Analysis, Insights and Forecast - by Source of Production
- 11.1.1. Crude Oil
- 11.1.2. Natural Gas Liquids
- 11.2. Market Analysis, Insights and Forecast - by Application
- 11.2.1. Residential
- 11.2.2. Commercial & Industrial
- 11.2.3. Autofuels
- 11.2.4. Other Applications
- 11.1. Market Analysis, Insights and Forecast - by Source of Production
- 12. Competitive Analysis
- 12.1. Company Profiles
- 12.1.1 Exxon Mobil Corporation
- 12.1.1.1. Company Overview
- 12.1.1.2. Products
- 12.1.1.3. Company Financials
- 12.1.1.4. SWOT Analysis
- 12.1.2 Novatek PAO
- 12.1.2.1. Company Overview
- 12.1.2.2. Products
- 12.1.2.3. Company Financials
- 12.1.2.4. SWOT Analysis
- 12.1.3 China Petroleum & Chemical Corporation
- 12.1.3.1. Company Overview
- 12.1.3.2. Products
- 12.1.3.3. Company Financials
- 12.1.3.4. SWOT Analysis
- 12.1.4 ConocoPhillips
- 12.1.4.1. Company Overview
- 12.1.4.2. Products
- 12.1.4.3. Company Financials
- 12.1.4.4. SWOT Analysis
- 12.1.5 Reliance Gas*List Not Exhaustive
- 12.1.5.1. Company Overview
- 12.1.5.2. Products
- 12.1.5.3. Company Financials
- 12.1.5.4. SWOT Analysis
- 12.1.6 QatarEnergy
- 12.1.6.1. Company Overview
- 12.1.6.2. Products
- 12.1.6.3. Company Financials
- 12.1.6.4. SWOT Analysis
- 12.1.7 BP PLC
- 12.1.7.1. Company Overview
- 12.1.7.2. Products
- 12.1.7.3. Company Financials
- 12.1.7.4. SWOT Analysis
- 12.1.8 Indian Oil Corporation Ltd
- 12.1.8.1. Company Overview
- 12.1.8.2. Products
- 12.1.8.3. Company Financials
- 12.1.8.4. SWOT Analysis
- 12.1.9 Gazprom PJSC
- 12.1.9.1. Company Overview
- 12.1.9.2. Products
- 12.1.9.3. Company Financials
- 12.1.9.4. SWOT Analysis
- 12.1.10 Abu Dhabi National Oil Company (ADNOC)
- 12.1.10.1. Company Overview
- 12.1.10.2. Products
- 12.1.10.3. Company Financials
- 12.1.10.4. SWOT Analysis
- 12.1.1 Exxon Mobil Corporation
- 12.2. Market Entropy
- 12.2.1 Company's Key Areas Served
- 12.2.2 Recent Developments
- 12.3. Company Market Share Analysis 2025
- 12.3.1 Top 5 Companies Market Share Analysis
- 12.3.2 Top 3 Companies Market Share Analysis
- 12.4. List of Potential Customers
- 13. Research Methodology
List of Figures
- Figure 1: Global LPG Industry Revenue Breakdown (billion, %) by Region 2025 & 2033
- Figure 2: North America LPG Industry Revenue (billion), by Source of Production 2025 & 2033
- Figure 3: North America LPG Industry Revenue Share (%), by Source of Production 2025 & 2033
- Figure 4: North America LPG Industry Revenue (billion), by Application 2025 & 2033
- Figure 5: North America LPG Industry Revenue Share (%), by Application 2025 & 2033
- Figure 6: North America LPG Industry Revenue (billion), by Country 2025 & 2033
- Figure 7: North America LPG Industry Revenue Share (%), by Country 2025 & 2033
- Figure 8: Europe LPG Industry Revenue (billion), by Source of Production 2025 & 2033
- Figure 9: Europe LPG Industry Revenue Share (%), by Source of Production 2025 & 2033
- Figure 10: Europe LPG Industry Revenue (billion), by Application 2025 & 2033
- Figure 11: Europe LPG Industry Revenue Share (%), by Application 2025 & 2033
- Figure 12: Europe LPG Industry Revenue (billion), by Country 2025 & 2033
- Figure 13: Europe LPG Industry Revenue Share (%), by Country 2025 & 2033
- Figure 14: Asia Pacific LPG Industry Revenue (billion), by Source of Production 2025 & 2033
- Figure 15: Asia Pacific LPG Industry Revenue Share (%), by Source of Production 2025 & 2033
- Figure 16: Asia Pacific LPG Industry Revenue (billion), by Application 2025 & 2033
- Figure 17: Asia Pacific LPG Industry Revenue Share (%), by Application 2025 & 2033
- Figure 18: Asia Pacific LPG Industry Revenue (billion), by Country 2025 & 2033
- Figure 19: Asia Pacific LPG Industry Revenue Share (%), by Country 2025 & 2033
- Figure 20: Middle East and Africa LPG Industry Revenue (billion), by Source of Production 2025 & 2033
- Figure 21: Middle East and Africa LPG Industry Revenue Share (%), by Source of Production 2025 & 2033
- Figure 22: Middle East and Africa LPG Industry Revenue (billion), by Application 2025 & 2033
- Figure 23: Middle East and Africa LPG Industry Revenue Share (%), by Application 2025 & 2033
- Figure 24: Middle East and Africa LPG Industry Revenue (billion), by Country 2025 & 2033
- Figure 25: Middle East and Africa LPG Industry Revenue Share (%), by Country 2025 & 2033
- Figure 26: South America LPG Industry Revenue (billion), by Source of Production 2025 & 2033
- Figure 27: South America LPG Industry Revenue Share (%), by Source of Production 2025 & 2033
- Figure 28: South America LPG Industry Revenue (billion), by Application 2025 & 2033
- Figure 29: South America LPG Industry Revenue Share (%), by Application 2025 & 2033
- Figure 30: South America LPG Industry Revenue (billion), by Country 2025 & 2033
- Figure 31: South America LPG Industry Revenue Share (%), by Country 2025 & 2033
List of Tables
- Table 1: Global LPG Industry Revenue billion Forecast, by Source of Production 2020 & 2033
- Table 2: Global LPG Industry Revenue billion Forecast, by Application 2020 & 2033
- Table 3: Global LPG Industry Revenue billion Forecast, by Region 2020 & 2033
- Table 4: Global LPG Industry Revenue billion Forecast, by Source of Production 2020 & 2033
- Table 5: Global LPG Industry Revenue billion Forecast, by Application 2020 & 2033
- Table 6: Global LPG Industry Revenue billion Forecast, by Country 2020 & 2033
- Table 7: United States LPG Industry Revenue (billion) Forecast, by Application 2020 & 2033
- Table 8: Canada LPG Industry Revenue (billion) Forecast, by Application 2020 & 2033
- Table 9: Rest of North America LPG Industry Revenue (billion) Forecast, by Application 2020 & 2033
- Table 10: Global LPG Industry Revenue billion Forecast, by Source of Production 2020 & 2033
- Table 11: Global LPG Industry Revenue billion Forecast, by Application 2020 & 2033
- Table 12: Global LPG Industry Revenue billion Forecast, by Country 2020 & 2033
- Table 13: Norway LPG Industry Revenue (billion) Forecast, by Application 2020 & 2033
- Table 14: Netherlands LPG Industry Revenue (billion) Forecast, by Application 2020 & 2033
- Table 15: United Kingdom LPG Industry Revenue (billion) Forecast, by Application 2020 & 2033
- Table 16: Germany LPG Industry Revenue (billion) Forecast, by Application 2020 & 2033
- Table 17: Rest of Europe LPG Industry Revenue (billion) Forecast, by Application 2020 & 2033
- Table 18: Global LPG Industry Revenue billion Forecast, by Source of Production 2020 & 2033
- Table 19: Global LPG Industry Revenue billion Forecast, by Application 2020 & 2033
- Table 20: Global LPG Industry Revenue billion Forecast, by Country 2020 & 2033
- Table 21: China LPG Industry Revenue (billion) Forecast, by Application 2020 & 2033
- Table 22: India LPG Industry Revenue (billion) Forecast, by Application 2020 & 2033
- Table 23: South Korea LPG Industry Revenue (billion) Forecast, by Application 2020 & 2033
- Table 24: Japan LPG Industry Revenue (billion) Forecast, by Application 2020 & 2033
- Table 25: Rest of Asia Pacific LPG Industry Revenue (billion) Forecast, by Application 2020 & 2033
- Table 26: Global LPG Industry Revenue billion Forecast, by Source of Production 2020 & 2033
- Table 27: Global LPG Industry Revenue billion Forecast, by Application 2020 & 2033
- Table 28: Global LPG Industry Revenue billion Forecast, by Country 2020 & 2033
- Table 29: Saudi Arabia LPG Industry Revenue (billion) Forecast, by Application 2020 & 2033
- Table 30: Qatar LPG Industry Revenue (billion) Forecast, by Application 2020 & 2033
- Table 31: South Africa LPG Industry Revenue (billion) Forecast, by Application 2020 & 2033
- Table 32: Rest of Middle East and Africa LPG Industry Revenue (billion) Forecast, by Application 2020 & 2033
- Table 33: Global LPG Industry Revenue billion Forecast, by Source of Production 2020 & 2033
- Table 34: Global LPG Industry Revenue billion Forecast, by Application 2020 & 2033
- Table 35: Global LPG Industry Revenue billion Forecast, by Country 2020 & 2033
- Table 36: Brazil LPG Industry Revenue (billion) Forecast, by Application 2020 & 2033
- Table 37: Argentina LPG Industry Revenue (billion) Forecast, by Application 2020 & 2033
- Table 38: Chile LPG Industry Revenue (billion) Forecast, by Application 2020 & 2033
- Table 39: Rest of South America LPG Industry Revenue (billion) Forecast, by Application 2020 & 2033
Frequently Asked Questions
1. What is the projected Compound Annual Growth Rate (CAGR) of the LPG Industry?
The projected CAGR is approximately 3.9%.
2. Which companies are prominent players in the LPG Industry?
Key companies in the market include Exxon Mobil Corporation, Novatek PAO, China Petroleum & Chemical Corporation, ConocoPhillips, Reliance Gas*List Not Exhaustive, QatarEnergy, BP PLC, Indian Oil Corporation Ltd, Gazprom PJSC, Abu Dhabi National Oil Company (ADNOC).
3. What are the main segments of the LPG Industry?
The market segments include Source of Production, Application.
4. Can you provide details about the market size?
The market size is estimated to be USD 123.14 billion as of 2022.
5. What are some drivers contributing to market growth?
4.; Increasing Demand for Gasoline and Diesel Across the Globe4.; Rapid Expansion of Automotive Industry.
6. What are the notable trends driving market growth?
LPG Extracted from Natural Gas Liquids to Dominate the Market.
7. Are there any restraints impacting market growth?
4.; Strict Mandates by the Global Organizations on VGO Composition.
8. Can you provide examples of recent developments in the market?
In October 2022, Maire Tecnimont S.p.A. announced that its principal subsidiary, Tecnimont S.p.A., was awarded an EPC contract by SONATRACH's Direction Centrale Engineering & Project Management for the execution of an LPG extraction plant within the existing Rhourde El Baguel oil and gas treatment complex in northeastern Algeria. The total contract value is around USD 380 million.
9. What pricing options are available for accessing the report?
Pricing options include single-user, multi-user, and enterprise licenses priced at USD 4750, USD 5250, and USD 8750 respectively.
10. Is the market size provided in terms of value or volume?
The market size is provided in terms of value, measured in billion.
11. Are there any specific market keywords associated with the report?
Yes, the market keyword associated with the report is "LPG Industry," which aids in identifying and referencing the specific market segment covered.
12. How do I determine which pricing option suits my needs best?
The pricing options vary based on user requirements and access needs. Individual users may opt for single-user licenses, while businesses requiring broader access may choose multi-user or enterprise licenses for cost-effective access to the report.
13. Are there any additional resources or data provided in the LPG Industry report?
While the report offers comprehensive insights, it's advisable to review the specific contents or supplementary materials provided to ascertain if additional resources or data are available.
14. How can I stay updated on further developments or reports in the LPG Industry?
To stay informed about further developments, trends, and reports in the LPG Industry, consider subscribing to industry newsletters, following relevant companies and organizations, or regularly checking reputable industry news sources and publications.
Methodology
Step 1 - Identification of Relevant Samples Size from Population Database


Step 2 - Approaches for Defining Global Market Size (Value, Volume* & Price*)

Note*: In applicable scenarios
Step 3 - Data Sources
Primary Research
- Web Analytics
- Survey Reports
- Research Institute
- Latest Research Reports
- Opinion Leaders
Secondary Research
- Annual Reports
- White Paper
- Latest Press Release
- Industry Association
- Paid Database
- Investor Presentations

Step 4 - Data Triangulation
Involves using different sources of information in order to increase the validity of a study
These sources are likely to be stakeholders in a program - participants, other researchers, program staff, other community members, and so on.
Then we put all data in single framework & apply various statistical tools to find out the dynamic on the market.
During the analysis stage, feedback from the stakeholder groups would be compared to determine areas of agreement as well as areas of divergence