

Key Insights
The global magnetic power bank market is projected to achieve a market size of $7.52 billion by 2033, expanding at a CAGR of 7.33% from a base year of 2025. This growth is driven by the escalating adoption of smartphones and portable electronics, alongside a rising demand for convenient, cable-free charging solutions. The inherent ease of use offered by magnetic power banks is a key driver, particularly appealing to tech-savvy consumers and younger demographics. Advances in battery technology, enabling more compact and higher-capacity devices, further enhance market appeal. The trend towards remote work and mobile lifestyles also necessitates reliable, portable power sources.
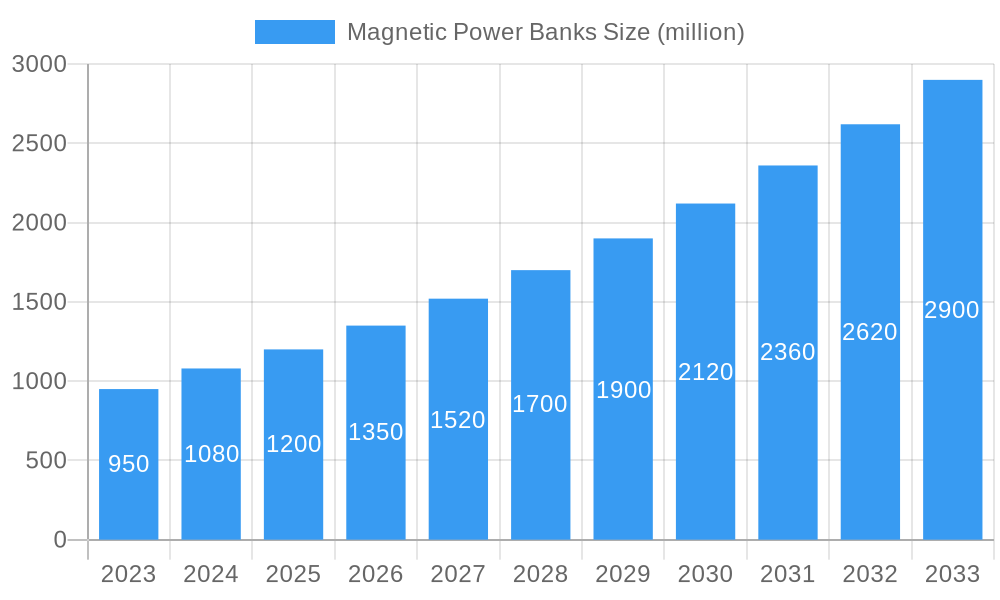
Magnetic Power Banks Market Size (In Billion)
Online sales channels are increasingly dominating the market, offering convenience and competitive pricing. While plastic-cased power banks currently lead due to cost-effectiveness and durability, metal variants are gaining traction for their premium aesthetics and superior heat dissipation. Leading companies are focusing on R&D for faster charging, higher capacities, and enhanced safety features. Geographically, the Asia Pacific region is expected to be a significant growth engine, with North America and Europe representing mature, substantial markets. Continued innovation and strategic market positioning are crucial for sustained success amidst competition and evolving charging standards.
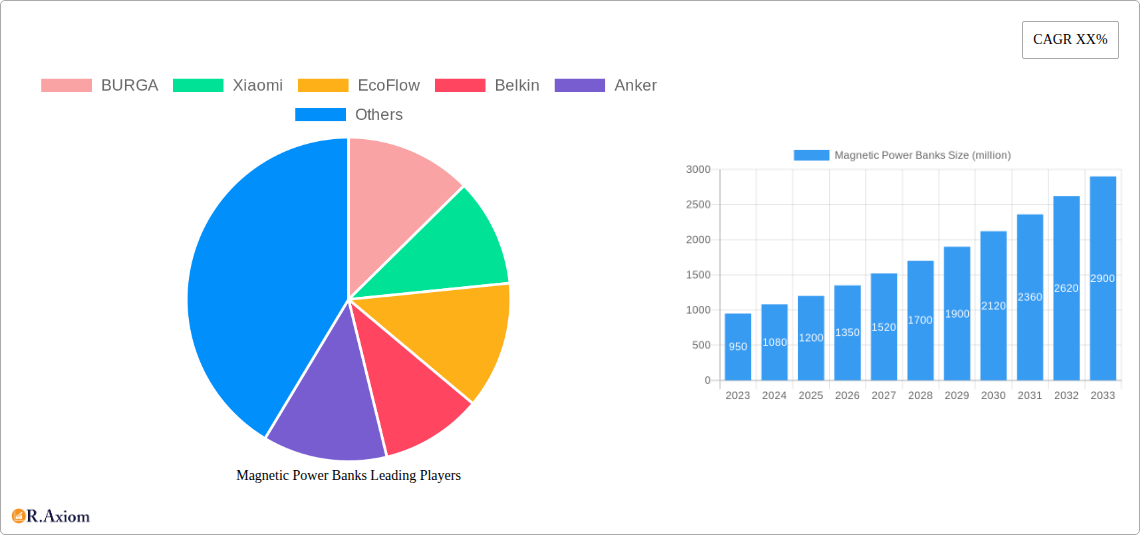
Magnetic Power Banks Company Market Share
Magnetic Power Banks Market Concentration & Innovation
The magnetic power banks market exhibits a moderate concentration, with several key players vying for market share, including BURGA, Xiaomi, EcoFlow, Belkin, Anker, ROKFORM, Epico, Xtorm, Native Union, iStore, and Apple. Innovation is primarily driven by the demand for enhanced portability, faster charging speeds, and seamless user experience. Advancements in battery technology, magnetic coupling mechanisms, and intelligent power management are at the forefront of product development. Regulatory frameworks are evolving to ensure safety standards and interoperability, impacting product design and market entry strategies.
- Market Share: Leading companies hold significant, yet fragmented, market shares, with the top five players collectively accounting for approximately 50 million in global market share in 2025.
- Innovation Drivers:
- Increased adoption of wireless charging technology.
- Demand for compact and lightweight power bank designs.
- Integration of smart features like LED indicators and multi-device charging.
- Development of higher capacity and faster charging capabilities.
- Regulatory Frameworks: Compliance with CE, FCC, and RoHS certifications is crucial for market access, influencing material choices and manufacturing processes.
- Product Substitutes: Traditional wired power banks and charging stations represent significant substitutes, necessitating continuous innovation to maintain competitive advantage.
- End-User Trends: Growing reliance on mobile devices, the rise of remote work, and a preference for cable-free solutions are fueling demand.
- M&A Activities: While major acquisitions are less prevalent, strategic partnerships and smaller-scale investments valued in the tens of millions are observed, particularly in technology development and niche market penetration. The total M&A deal value in the broader portable power market was estimated at over 500 million in 2024.
Magnetic Power Banks Industry Trends & Insights
The magnetic power banks industry is poised for substantial growth, driven by a confluence of technological advancements and evolving consumer lifestyles. The increasing ubiquity of smartphones, tablets, and other portable electronic devices, coupled with a growing demand for untethered charging solutions, forms the bedrock of this expansion. This report forecasts a Compound Annual Growth Rate (CAGR) of approximately 12.5% for the magnetic power banks market from 2025 to 2033, projecting the market size to reach an estimated 8,000 million by the end of the forecast period. The base year, 2025, sees a global market valuation of approximately 3,000 million, underscoring the significant growth trajectory.
Technological disruptions are playing a pivotal role. The refinement of magnetic charging technology, offering a more secure and effortless connection compared to traditional ports, has been a key differentiator. Innovations in battery density and charging speed, such as fast-charging protocols like USB Power Delivery (PD) and Qualcomm Quick Charge, are enhancing the user experience, reducing charging times, and making magnetic power banks increasingly attractive. The integration of MagSafe technology by Apple has further popularized magnetic attachment, creating a powerful ecosystem that encourages third-party accessory development and broader consumer adoption.
Consumer preferences are shifting towards convenience and aesthetic appeal. Magnetic power banks, often designed with sleek, minimalist aesthetics and premium materials like metal casings, align with modern design sensibilities. The ease of attaching and detaching the power bank without the need for precise alignment is a significant convenience factor, especially for users on the go. Furthermore, the rise of eco-consciousness is subtly influencing purchasing decisions, with a growing segment of consumers favoring brands that offer sustainable materials and energy-efficient solutions. Companies like EcoFlow are making strides in this area.
The competitive landscape is dynamic, characterized by both established electronics giants and agile startups. While Apple, Anker, and Belkin are dominant players, companies like BURGA, Xiaomi, ROKFORM, Epico, Xtorm, and Native Union are carving out niches through specialized designs, targeted marketing, and innovative features. The market penetration of magnetic power banks is still relatively nascent compared to traditional power banks, offering significant headroom for growth. The historical period from 2019 to 2024 saw a steady increase in awareness and adoption, with market revenue growing from an estimated 1,200 million in 2019 to approximately 2,700 million in 2024, setting a strong foundation for future expansion.
Dominant Markets & Segments in Magnetic Power Banks
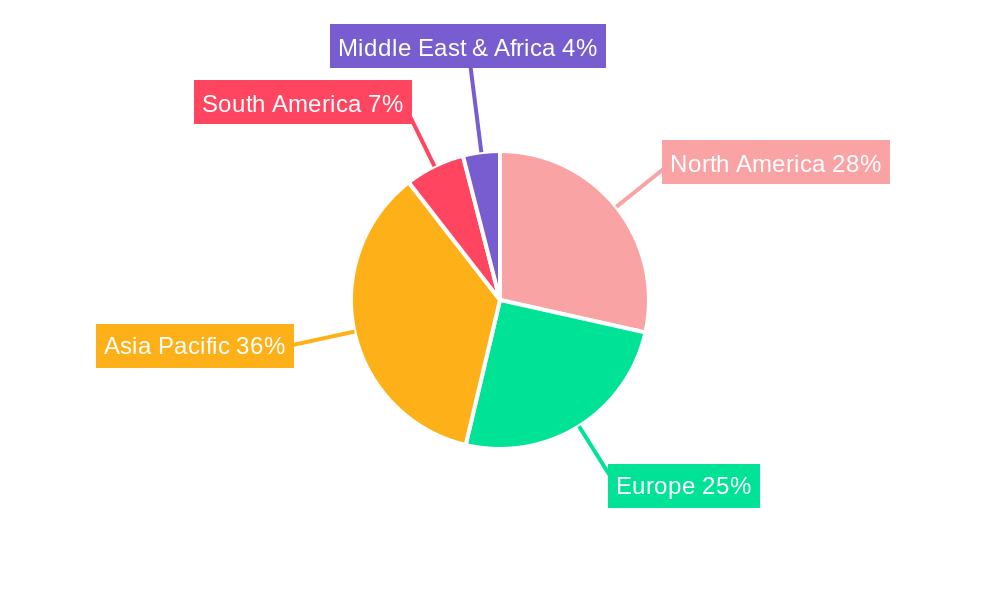
The magnetic power banks market is witnessing a pronounced dominance in certain geographical regions and distribution channels, significantly influenced by economic policies, infrastructure development, and prevailing consumer behavior. North America, particularly the United States, stands out as a leading market, driven by a high disposable income, rapid adoption of new technologies, and a robust ecosystem for mobile accessories. The strong presence of key players like Apple, Anker, and Belkin, coupled with a large consumer base with a high dependence on mobile devices, solidifies North America's position. The market size in North America is estimated to be over 1,500 million in 2025.
Asia Pacific, led by China and South Korea, is another rapidly growing and increasingly dominant region. This growth is fueled by an expanding middle class, increasing smartphone penetration, and a burgeoning e-commerce landscape. While offline sales remain significant, online sales channels are gaining substantial traction, mirroring global trends. The competitive landscape in this region is intense, with both global brands and strong local manufacturers like Xiaomi contributing to market dynamics. The market size in Asia Pacific is projected to reach approximately 1,200 million in 2025, with a higher growth rate than North America.
In terms of application segments, Online Sales represent a dominant and rapidly expanding channel for magnetic power banks. The convenience of browsing, comparing, and purchasing products from the comfort of one's home, coupled with efficient logistics and a wide array of product choices, makes online platforms highly attractive to consumers. E-commerce giants and direct-to-consumer websites are key distribution avenues, accounting for an estimated 65% of total sales in 2025, with a projected market value of approximately 1,950 million. Key drivers for this dominance include:
- Convenience and Accessibility: Consumers can access a vast selection of magnetic power banks anytime, anywhere.
- Competitive Pricing: Online platforms often offer more competitive pricing due to lower overhead costs.
- Detailed Product Information and Reviews: Online resources provide ample information and user feedback, aiding purchase decisions.
- Targeted Marketing: Online channels enable manufacturers to precisely target demographics interested in magnetic power banks.
Conversely, Offline Sales, encompassing retail stores, electronics outlets, and carrier stores, still hold significant importance, particularly for consumers who prefer to physically inspect products before purchasing or seek immediate gratification. While its share is gradually decreasing relative to online sales, it remains crucial for brand visibility and reaching a broader customer base. Offline sales are estimated to constitute 35% of the market in 2025, with a market value of approximately 1,050 million. Key drivers supporting offline sales include:
- Tangible Product Experience: Consumers can touch, feel, and test the magnetic attachment and build quality.
- Impulse Purchases: In-store placement and promotions can drive spontaneous buying decisions.
- Customer Service and Support: Brick-and-mortar stores offer immediate assistance and a personal touch.
- Brand Showcasing: Retail environments provide a platform for brands to create engaging displays and reinforce brand image.
Analyzing the Types of magnetic power banks, Metal-Cased Power Banks are emerging as a dominant segment, driven by their perceived durability, premium aesthetic, and superior heat dissipation capabilities. Consumers associate metal casings with higher quality and longevity, making them a preferred choice for those willing to invest in a more robust solution. The market for metal-cased power banks is estimated at roughly 60% of the total magnetic power bank market in 2025, valued at approximately 1,800 million. Key drivers include:
- Durability and Robustness: Metal offers superior protection against drops and impacts.
- Premium Aesthetics: Brushed aluminum and other metal finishes provide a sophisticated look and feel.
- Effective Heat Dissipation: Metal casings help manage heat generated during charging, ensuring optimal performance and battery longevity.
- Brand Differentiation: Premium materials allow brands to position their products in the higher-end market.
Plastic-Cased Power Banks, while still a substantial segment, are gradually yielding ground to their metal counterparts in the premium magnetic power bank category. However, they continue to be a viable and popular option due to their affordability, lightweight nature, and wider range of color and design options. They often appeal to budget-conscious consumers or those prioritizing portability above all else. The market for plastic-cased power banks is estimated at 40% of the total magnetic power bank market in 2025, valued at approximately 1,200 million. Key drivers include:
- Cost-Effectiveness: Plastic is generally less expensive, making these power banks more accessible.
- Lightweight Design: Ideal for users who prioritize portability and minimizing backpack weight.
- Variety of Designs: Plastics can be molded into diverse shapes and colors, offering greater customization.
- Impact Resistance: Certain plastics offer good resistance to minor impacts and scratches.
Magnetic Power Banks Product Developments
Magnetic power banks are evolving rapidly, with product developments focusing on enhanced charging speeds, increased capacity, and seamless integration into existing tech ecosystems. Innovations include the adoption of higher wattage charging capabilities, enabling faster power replenishment for devices, and the integration of advanced battery management systems for improved safety and longevity. The trend towards sleeker, more compact designs continues, making these power banks highly portable and aesthetically pleasing. Many products now feature intelligent charging that automatically detects connected devices to optimize power delivery. The competitive advantage lies in offering a user-friendly, cable-free experience that complements the growing demand for convenience.
Report Scope & Segmentation Analysis
This report comprehensively analyzes the global magnetic power banks market, segmenting it across key application and product type categories. The Application segmentation includes Online Sales, which are projected to grow at a CAGR of 13.2% from 2025–2033, reaching an estimated market size of 4,500 million. This segment's growth is driven by the increasing dominance of e-commerce and consumer preference for digital purchasing channels. Offline Sales, while still substantial, are expected to grow at a more moderate CAGR of 9.8%, reaching an estimated 2,500 million by 2033, driven by physical retail presence and impulse purchases.
The Type segmentation focuses on Plastic-Cased Power Banks, forecast to grow at a CAGR of 10.5% to reach an estimated 3,800 million by 2033, benefiting from their affordability and wide appeal. Metal-Cased Power Banks are anticipated to experience a higher CAGR of 15.1%, driven by consumer demand for premium build quality and durability, reaching an estimated 5,000 million by 2033. Competitive dynamics within each segment are characterized by price competition, feature differentiation, and brand perception.
Key Drivers of Magnetic Power Banks Growth
The magnetic power banks market is propelled by several key growth drivers. The exponential increase in smartphone and tablet usage worldwide necessitates constant power solutions, making portable chargers indispensable. The convenience and ease of use offered by magnetic attachment technology, eliminating the hassle of fumbling with cables, significantly enhances user experience. Advancements in battery technology are enabling higher capacities and faster charging speeds, making magnetic power banks more efficient and attractive. Furthermore, the growing popularity of wireless charging ecosystems, exemplified by Apple's MagSafe, is creating a strong demand for compatible accessories. The increasing disposable income in emerging economies is also contributing to market expansion as more consumers can afford these advanced portable charging solutions.
Challenges in the Magnetic Power Banks Sector
Despite robust growth, the magnetic power banks sector faces several challenges. Intense competition from both established brands and new entrants puts pressure on pricing and profit margins. The rapid pace of technological evolution requires continuous investment in research and development to stay competitive, which can be a significant barrier for smaller companies. Regulatory hurdles related to battery safety, charging standards, and e-waste disposal can increase compliance costs and affect product launches. Supply chain disruptions, particularly for critical components, can impact production and lead times. Furthermore, the perception of magnetic power banks as a premium product can limit their adoption among price-sensitive consumers, who may opt for cheaper, traditional wired power banks.
Emerging Opportunities in Magnetic Power Banks
Several emerging opportunities present significant potential for the magnetic power banks market. The integration of smart functionalities, such as personalized charging profiles, remote monitoring, and even power sharing capabilities, could unlock new revenue streams and enhance user engagement. The expanding adoption of electric vehicles (EVs) might pave the way for magnetic charging solutions for smaller EV accessories or even in-car charging for personal devices. Sustainability is becoming a key purchasing factor, creating opportunities for manufacturers to develop power banks using recycled materials and to implement more eco-friendly manufacturing processes. Expansion into emerging markets with rapidly growing mobile device penetration, particularly in Africa and Southeast Asia, offers substantial untapped potential.
Leading Players in the Magnetic Power Banks Market
- BURGA
- Xiaomi
- EcoFlow
- Belkin
- Anker
- ROKFORM
- Epico
- Xtorm
- Native Union
- iStore
- Apple
Key Developments in Magnetic Power Banks Industry
- 2023 January: Apple releases new MagSafe battery packs with enhanced capacity and faster charging.
- 2023 April: Anker launches a new line of magnetic power banks featuring GaN technology for faster, more efficient charging.
- 2023 July: Belkin introduces a range of magnetic wireless chargers designed for seamless integration with iPhones and AirPods.
- 2023 October: Xiaomi unveils a high-capacity magnetic power bank with innovative heat dissipation technology.
- 2024 February: EcoFlow announces a strategic partnership with a leading semiconductor firm to develop next-generation battery management systems for portable power solutions.
- 2024 May: ROKFORM introduces ruggedized magnetic power banks designed for outdoor and industrial applications.
- 2024 September: Native Union showcases innovative designs incorporating sustainable materials in their magnetic power bank offerings.
Strategic Outlook for Magnetic Power Banks Market
The strategic outlook for the magnetic power banks market is overwhelmingly positive, driven by sustained technological innovation and evolving consumer demands for convenience and seamless connectivity. The continued expansion of the smartphone market, coupled with the increasing adoption of other wireless-charging-enabled devices like smartwatches and earbuds, will continue to fuel demand. Strategic focus on enhancing charging speeds, increasing power density, and improving the user experience through intuitive design and smart features will be critical for market leaders. Companies that can effectively leverage partnerships, invest in sustainable practices, and expand into underserved emerging markets are well-positioned for significant growth and long-term success in this dynamic sector, projecting a lucrative future with abundant opportunities for expansion and profitability.
Magnetic Power Banks Segmentation
-
1. Application
- 1.1. Online Sales
- 1.2. Offline Sales
-
2. Types
- 2.1. Plastic-Cased Power Banks
- 2.2. Metal-Cased Power Banks
Magnetic Power Banks Segmentation By Geography
-
1. North America
- 1.1. United States
- 1.2. Canada
- 1.3. Mexico
-
2. South America
- 2.1. Brazil
- 2.2. Argentina
- 2.3. Rest of South America
-
3. Europe
- 3.1. United Kingdom
- 3.2. Germany
- 3.3. France
- 3.4. Italy
- 3.5. Spain
- 3.6. Russia
- 3.7. Benelux
- 3.8. Nordics
- 3.9. Rest of Europe
-
4. Middle East & Africa
- 4.1. Turkey
- 4.2. Israel
- 4.3. GCC
- 4.4. North Africa
- 4.5. South Africa
- 4.6. Rest of Middle East & Africa
-
5. Asia Pacific
- 5.1. China
- 5.2. India
- 5.3. Japan
- 5.4. South Korea
- 5.5. ASEAN
- 5.6. Oceania
- 5.7. Rest of Asia Pacific
Magnetic Power Banks Regional Market Share
Geographic Coverage of Magnetic Power Banks
Magnetic Power Banks REPORT HIGHLIGHTS
| Aspects | Details |
|---|---|
| Study Period | 2020-2034 |
| Base Year | 2025 |
| Estimated Year | 2026 |
| Forecast Period | 2026-2034 |
| Historical Period | 2020-2025 |
| Growth Rate | CAGR of 7.33% from 2020-2034 |
| Segmentation |
|
Table of Contents
- 1. Introduction
- 1.1. Research Scope
- 1.2. Market Segmentation
- 1.3. Research Objective
- 1.4. Definitions and Assumptions
- 2. Executive Summary
- 2.1. Market Snapshot
- 3. Market Dynamics
- 3.1. Market Drivers
- 3.2. Market Restrains
- 3.3. Market Trends
- 3.4. Market Opportunities
- 4. Market Factor Analysis
- 4.1. Porters Five Forces
- 4.1.1. Bargaining Power of Suppliers
- 4.1.2. Bargaining Power of Buyers
- 4.1.3. Threat of New Entrants
- 4.1.4. Threat of Substitutes
- 4.1.5. Competitive Rivalry
- 4.2. PESTEL analysis
- 4.3. BCG Analysis
- 4.3.1. Stars (High Growth, High Market Share)
- 4.3.2. Cash Cows (Low Growth, High Market Share)
- 4.3.3. Question Mark (High Growth, Low Market Share)
- 4.3.4. Dogs (Low Growth, Low Market Share)
- 4.4. Ansoff Matrix Analysis
- 4.5. Supply Chain Analysis
- 4.6. Regulatory Landscape
- 4.7. Current Market Potential and Opportunity Assessment (TAM–SAM–SOM Framework)
- 4.8. RAX Analyst Note
- 4.1. Porters Five Forces
- 5. Market Analysis, Insights and Forecast 2021-2033
- 5.1. Market Analysis, Insights and Forecast - by Application
- 5.1.1. Online Sales
- 5.1.2. Offline Sales
- 5.2. Market Analysis, Insights and Forecast - by Types
- 5.2.1. Plastic-Cased Power Banks
- 5.2.2. Metal-Cased Power Banks
- 5.3. Market Analysis, Insights and Forecast - by Region
- 5.3.1. North America
- 5.3.2. South America
- 5.3.3. Europe
- 5.3.4. Middle East & Africa
- 5.3.5. Asia Pacific
- 5.1. Market Analysis, Insights and Forecast - by Application
- 6. Global Magnetic Power Banks Analysis, Insights and Forecast, 2021-2033
- 6.1. Market Analysis, Insights and Forecast - by Application
- 6.1.1. Online Sales
- 6.1.2. Offline Sales
- 6.2. Market Analysis, Insights and Forecast - by Types
- 6.2.1. Plastic-Cased Power Banks
- 6.2.2. Metal-Cased Power Banks
- 6.1. Market Analysis, Insights and Forecast - by Application
- 7. North America Magnetic Power Banks Analysis, Insights and Forecast, 2020-2032
- 7.1. Market Analysis, Insights and Forecast - by Application
- 7.1.1. Online Sales
- 7.1.2. Offline Sales
- 7.2. Market Analysis, Insights and Forecast - by Types
- 7.2.1. Plastic-Cased Power Banks
- 7.2.2. Metal-Cased Power Banks
- 7.1. Market Analysis, Insights and Forecast - by Application
- 8. South America Magnetic Power Banks Analysis, Insights and Forecast, 2020-2032
- 8.1. Market Analysis, Insights and Forecast - by Application
- 8.1.1. Online Sales
- 8.1.2. Offline Sales
- 8.2. Market Analysis, Insights and Forecast - by Types
- 8.2.1. Plastic-Cased Power Banks
- 8.2.2. Metal-Cased Power Banks
- 8.1. Market Analysis, Insights and Forecast - by Application
- 9. Europe Magnetic Power Banks Analysis, Insights and Forecast, 2020-2032
- 9.1. Market Analysis, Insights and Forecast - by Application
- 9.1.1. Online Sales
- 9.1.2. Offline Sales
- 9.2. Market Analysis, Insights and Forecast - by Types
- 9.2.1. Plastic-Cased Power Banks
- 9.2.2. Metal-Cased Power Banks
- 9.1. Market Analysis, Insights and Forecast - by Application
- 10. Middle East & Africa Magnetic Power Banks Analysis, Insights and Forecast, 2020-2032
- 10.1. Market Analysis, Insights and Forecast - by Application
- 10.1.1. Online Sales
- 10.1.2. Offline Sales
- 10.2. Market Analysis, Insights and Forecast - by Types
- 10.2.1. Plastic-Cased Power Banks
- 10.2.2. Metal-Cased Power Banks
- 10.1. Market Analysis, Insights and Forecast - by Application
- 11. Asia Pacific Magnetic Power Banks Analysis, Insights and Forecast, 2020-2032
- 11.1. Market Analysis, Insights and Forecast - by Application
- 11.1.1. Online Sales
- 11.1.2. Offline Sales
- 11.2. Market Analysis, Insights and Forecast - by Types
- 11.2.1. Plastic-Cased Power Banks
- 11.2.2. Metal-Cased Power Banks
- 11.1. Market Analysis, Insights and Forecast - by Application
- 12. Competitive Analysis
- 12.1. Company Profiles
- 12.1.1 BURGA
- 12.1.1.1. Company Overview
- 12.1.1.2. Products
- 12.1.1.3. Company Financials
- 12.1.1.4. SWOT Analysis
- 12.1.2 Xiaomi
- 12.1.2.1. Company Overview
- 12.1.2.2. Products
- 12.1.2.3. Company Financials
- 12.1.2.4. SWOT Analysis
- 12.1.3 EcoFlow
- 12.1.3.1. Company Overview
- 12.1.3.2. Products
- 12.1.3.3. Company Financials
- 12.1.3.4. SWOT Analysis
- 12.1.4 Belkin
- 12.1.4.1. Company Overview
- 12.1.4.2. Products
- 12.1.4.3. Company Financials
- 12.1.4.4. SWOT Analysis
- 12.1.5 Anker
- 12.1.5.1. Company Overview
- 12.1.5.2. Products
- 12.1.5.3. Company Financials
- 12.1.5.4. SWOT Analysis
- 12.1.6 ROKFORM
- 12.1.6.1. Company Overview
- 12.1.6.2. Products
- 12.1.6.3. Company Financials
- 12.1.6.4. SWOT Analysis
- 12.1.7 Epico
- 12.1.7.1. Company Overview
- 12.1.7.2. Products
- 12.1.7.3. Company Financials
- 12.1.7.4. SWOT Analysis
- 12.1.8 Xtorm
- 12.1.8.1. Company Overview
- 12.1.8.2. Products
- 12.1.8.3. Company Financials
- 12.1.8.4. SWOT Analysis
- 12.1.9 Native Union
- 12.1.9.1. Company Overview
- 12.1.9.2. Products
- 12.1.9.3. Company Financials
- 12.1.9.4. SWOT Analysis
- 12.1.10 iStore
- 12.1.10.1. Company Overview
- 12.1.10.2. Products
- 12.1.10.3. Company Financials
- 12.1.10.4. SWOT Analysis
- 12.1.11 Apple
- 12.1.11.1. Company Overview
- 12.1.11.2. Products
- 12.1.11.3. Company Financials
- 12.1.11.4. SWOT Analysis
- 12.1.1 BURGA
- 12.2. Market Entropy
- 12.2.1 Company's Key Areas Served
- 12.2.2 Recent Developments
- 12.3. Company Market Share Analysis 2025
- 12.3.1 Top 5 Companies Market Share Analysis
- 12.3.2 Top 3 Companies Market Share Analysis
- 12.4. List of Potential Customers
- 13. Research Methodology
List of Figures
- Figure 1: Global Magnetic Power Banks Revenue Breakdown (billion, %) by Region 2025 & 2033
- Figure 2: North America Magnetic Power Banks Revenue (billion), by Application 2025 & 2033
- Figure 3: North America Magnetic Power Banks Revenue Share (%), by Application 2025 & 2033
- Figure 4: North America Magnetic Power Banks Revenue (billion), by Types 2025 & 2033
- Figure 5: North America Magnetic Power Banks Revenue Share (%), by Types 2025 & 2033
- Figure 6: North America Magnetic Power Banks Revenue (billion), by Country 2025 & 2033
- Figure 7: North America Magnetic Power Banks Revenue Share (%), by Country 2025 & 2033
- Figure 8: South America Magnetic Power Banks Revenue (billion), by Application 2025 & 2033
- Figure 9: South America Magnetic Power Banks Revenue Share (%), by Application 2025 & 2033
- Figure 10: South America Magnetic Power Banks Revenue (billion), by Types 2025 & 2033
- Figure 11: South America Magnetic Power Banks Revenue Share (%), by Types 2025 & 2033
- Figure 12: South America Magnetic Power Banks Revenue (billion), by Country 2025 & 2033
- Figure 13: South America Magnetic Power Banks Revenue Share (%), by Country 2025 & 2033
- Figure 14: Europe Magnetic Power Banks Revenue (billion), by Application 2025 & 2033
- Figure 15: Europe Magnetic Power Banks Revenue Share (%), by Application 2025 & 2033
- Figure 16: Europe Magnetic Power Banks Revenue (billion), by Types 2025 & 2033
- Figure 17: Europe Magnetic Power Banks Revenue Share (%), by Types 2025 & 2033
- Figure 18: Europe Magnetic Power Banks Revenue (billion), by Country 2025 & 2033
- Figure 19: Europe Magnetic Power Banks Revenue Share (%), by Country 2025 & 2033
- Figure 20: Middle East & Africa Magnetic Power Banks Revenue (billion), by Application 2025 & 2033
- Figure 21: Middle East & Africa Magnetic Power Banks Revenue Share (%), by Application 2025 & 2033
- Figure 22: Middle East & Africa Magnetic Power Banks Revenue (billion), by Types 2025 & 2033
- Figure 23: Middle East & Africa Magnetic Power Banks Revenue Share (%), by Types 2025 & 2033
- Figure 24: Middle East & Africa Magnetic Power Banks Revenue (billion), by Country 2025 & 2033
- Figure 25: Middle East & Africa Magnetic Power Banks Revenue Share (%), by Country 2025 & 2033
- Figure 26: Asia Pacific Magnetic Power Banks Revenue (billion), by Application 2025 & 2033
- Figure 27: Asia Pacific Magnetic Power Banks Revenue Share (%), by Application 2025 & 2033
- Figure 28: Asia Pacific Magnetic Power Banks Revenue (billion), by Types 2025 & 2033
- Figure 29: Asia Pacific Magnetic Power Banks Revenue Share (%), by Types 2025 & 2033
- Figure 30: Asia Pacific Magnetic Power Banks Revenue (billion), by Country 2025 & 2033
- Figure 31: Asia Pacific Magnetic Power Banks Revenue Share (%), by Country 2025 & 2033
List of Tables
- Table 1: Global Magnetic Power Banks Revenue billion Forecast, by Application 2020 & 2033
- Table 2: Global Magnetic Power Banks Revenue billion Forecast, by Types 2020 & 2033
- Table 3: Global Magnetic Power Banks Revenue billion Forecast, by Region 2020 & 2033
- Table 4: Global Magnetic Power Banks Revenue billion Forecast, by Application 2020 & 2033
- Table 5: Global Magnetic Power Banks Revenue billion Forecast, by Types 2020 & 2033
- Table 6: Global Magnetic Power Banks Revenue billion Forecast, by Country 2020 & 2033
- Table 7: United States Magnetic Power Banks Revenue (billion) Forecast, by Application 2020 & 2033
- Table 8: Canada Magnetic Power Banks Revenue (billion) Forecast, by Application 2020 & 2033
- Table 9: Mexico Magnetic Power Banks Revenue (billion) Forecast, by Application 2020 & 2033
- Table 10: Global Magnetic Power Banks Revenue billion Forecast, by Application 2020 & 2033
- Table 11: Global Magnetic Power Banks Revenue billion Forecast, by Types 2020 & 2033
- Table 12: Global Magnetic Power Banks Revenue billion Forecast, by Country 2020 & 2033
- Table 13: Brazil Magnetic Power Banks Revenue (billion) Forecast, by Application 2020 & 2033
- Table 14: Argentina Magnetic Power Banks Revenue (billion) Forecast, by Application 2020 & 2033
- Table 15: Rest of South America Magnetic Power Banks Revenue (billion) Forecast, by Application 2020 & 2033
- Table 16: Global Magnetic Power Banks Revenue billion Forecast, by Application 2020 & 2033
- Table 17: Global Magnetic Power Banks Revenue billion Forecast, by Types 2020 & 2033
- Table 18: Global Magnetic Power Banks Revenue billion Forecast, by Country 2020 & 2033
- Table 19: United Kingdom Magnetic Power Banks Revenue (billion) Forecast, by Application 2020 & 2033
- Table 20: Germany Magnetic Power Banks Revenue (billion) Forecast, by Application 2020 & 2033
- Table 21: France Magnetic Power Banks Revenue (billion) Forecast, by Application 2020 & 2033
- Table 22: Italy Magnetic Power Banks Revenue (billion) Forecast, by Application 2020 & 2033
- Table 23: Spain Magnetic Power Banks Revenue (billion) Forecast, by Application 2020 & 2033
- Table 24: Russia Magnetic Power Banks Revenue (billion) Forecast, by Application 2020 & 2033
- Table 25: Benelux Magnetic Power Banks Revenue (billion) Forecast, by Application 2020 & 2033
- Table 26: Nordics Magnetic Power Banks Revenue (billion) Forecast, by Application 2020 & 2033
- Table 27: Rest of Europe Magnetic Power Banks Revenue (billion) Forecast, by Application 2020 & 2033
- Table 28: Global Magnetic Power Banks Revenue billion Forecast, by Application 2020 & 2033
- Table 29: Global Magnetic Power Banks Revenue billion Forecast, by Types 2020 & 2033
- Table 30: Global Magnetic Power Banks Revenue billion Forecast, by Country 2020 & 2033
- Table 31: Turkey Magnetic Power Banks Revenue (billion) Forecast, by Application 2020 & 2033
- Table 32: Israel Magnetic Power Banks Revenue (billion) Forecast, by Application 2020 & 2033
- Table 33: GCC Magnetic Power Banks Revenue (billion) Forecast, by Application 2020 & 2033
- Table 34: North Africa Magnetic Power Banks Revenue (billion) Forecast, by Application 2020 & 2033
- Table 35: South Africa Magnetic Power Banks Revenue (billion) Forecast, by Application 2020 & 2033
- Table 36: Rest of Middle East & Africa Magnetic Power Banks Revenue (billion) Forecast, by Application 2020 & 2033
- Table 37: Global Magnetic Power Banks Revenue billion Forecast, by Application 2020 & 2033
- Table 38: Global Magnetic Power Banks Revenue billion Forecast, by Types 2020 & 2033
- Table 39: Global Magnetic Power Banks Revenue billion Forecast, by Country 2020 & 2033
- Table 40: China Magnetic Power Banks Revenue (billion) Forecast, by Application 2020 & 2033
- Table 41: India Magnetic Power Banks Revenue (billion) Forecast, by Application 2020 & 2033
- Table 42: Japan Magnetic Power Banks Revenue (billion) Forecast, by Application 2020 & 2033
- Table 43: South Korea Magnetic Power Banks Revenue (billion) Forecast, by Application 2020 & 2033
- Table 44: ASEAN Magnetic Power Banks Revenue (billion) Forecast, by Application 2020 & 2033
- Table 45: Oceania Magnetic Power Banks Revenue (billion) Forecast, by Application 2020 & 2033
- Table 46: Rest of Asia Pacific Magnetic Power Banks Revenue (billion) Forecast, by Application 2020 & 2033
Frequently Asked Questions
1. What is the projected Compound Annual Growth Rate (CAGR) of the Magnetic Power Banks?
The projected CAGR is approximately 7.33%.
2. Which companies are prominent players in the Magnetic Power Banks?
Key companies in the market include BURGA, Xiaomi, EcoFlow, Belkin, Anker, ROKFORM, Epico, Xtorm, Native Union, iStore, Apple.
3. What are the main segments of the Magnetic Power Banks?
The market segments include Application, Types.
4. Can you provide details about the market size?
The market size is estimated to be USD 7.52 billion as of 2022.
5. What are some drivers contributing to market growth?
N/A
6. What are the notable trends driving market growth?
N/A
7. Are there any restraints impacting market growth?
N/A
8. Can you provide examples of recent developments in the market?
N/A
9. What pricing options are available for accessing the report?
Pricing options include single-user, multi-user, and enterprise licenses priced at USD 2900.00, USD 4350.00, and USD 5800.00 respectively.
10. Is the market size provided in terms of value or volume?
The market size is provided in terms of value, measured in billion.
11. Are there any specific market keywords associated with the report?
Yes, the market keyword associated with the report is "Magnetic Power Banks," which aids in identifying and referencing the specific market segment covered.
12. How do I determine which pricing option suits my needs best?
The pricing options vary based on user requirements and access needs. Individual users may opt for single-user licenses, while businesses requiring broader access may choose multi-user or enterprise licenses for cost-effective access to the report.
13. Are there any additional resources or data provided in the Magnetic Power Banks report?
While the report offers comprehensive insights, it's advisable to review the specific contents or supplementary materials provided to ascertain if additional resources or data are available.
14. How can I stay updated on further developments or reports in the Magnetic Power Banks?
To stay informed about further developments, trends, and reports in the Magnetic Power Banks, consider subscribing to industry newsletters, following relevant companies and organizations, or regularly checking reputable industry news sources and publications.
Methodology
Step 1 - Identification of Relevant Samples Size from Population Database


Step 2 - Approaches for Defining Global Market Size (Value, Volume* & Price*)

Note*: In applicable scenarios
Step 3 - Data Sources
Primary Research
- Web Analytics
- Survey Reports
- Research Institute
- Latest Research Reports
- Opinion Leaders
Secondary Research
- Annual Reports
- White Paper
- Latest Press Release
- Industry Association
- Paid Database
- Investor Presentations

Step 4 - Data Triangulation
Involves using different sources of information in order to increase the validity of a study
These sources are likely to be stakeholders in a program - participants, other researchers, program staff, other community members, and so on.
Then we put all data in single framework & apply various statistical tools to find out the dynamic on the market.
During the analysis stage, feedback from the stakeholder groups would be compared to determine areas of agreement as well as areas of divergence