
Key Insights
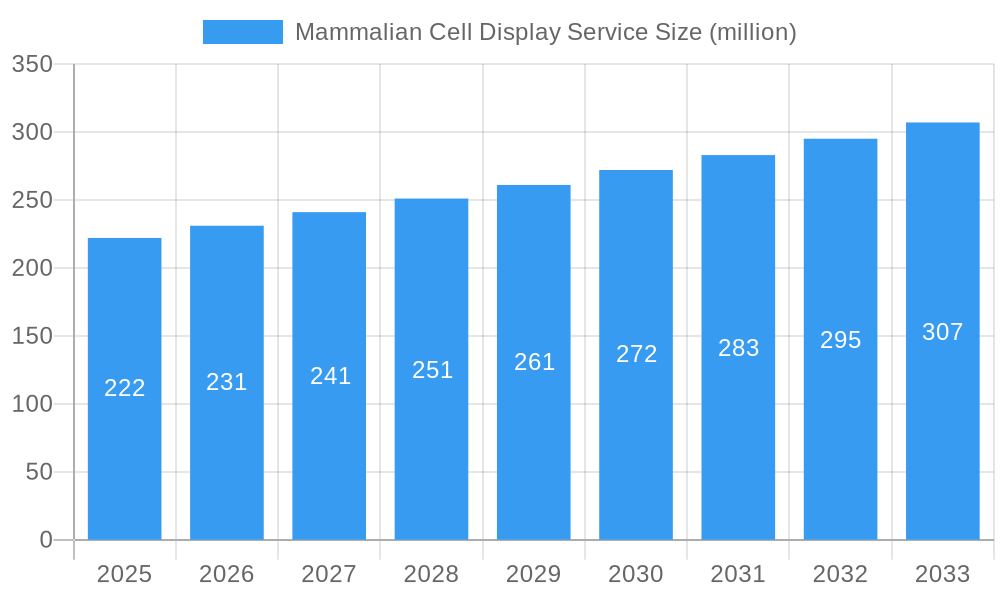
The mammalian cell display service market, valued at $222 million in 2025, is projected to experience steady growth, driven by a Compound Annual Growth Rate (CAGR) of 4.1% from 2025 to 2033. This growth is fueled by several key factors. Firstly, the increasing demand for advanced therapeutic protein development, particularly in the biopharmaceutical industry, necessitates efficient and high-throughput screening methods. Mammalian cell display technology offers a significant advantage by enabling the rapid identification and characterization of antibodies, receptors, and other therapeutic proteins with improved efficacy and specificity. Secondly, the rising prevalence of chronic diseases like cancer and autoimmune disorders is further bolstering market growth, as these conditions drive the need for novel therapeutic approaches. Finally, continuous technological advancements in mammalian cell display, leading to increased efficiency and reduced costs, are also contributing to market expansion. Companies like Cusabio, Creative Biolabs, Creative BioMart, Sino Biological, Sydlabs, and GenScript are key players in this competitive landscape, constantly innovating and expanding their service offerings to meet the growing demand.
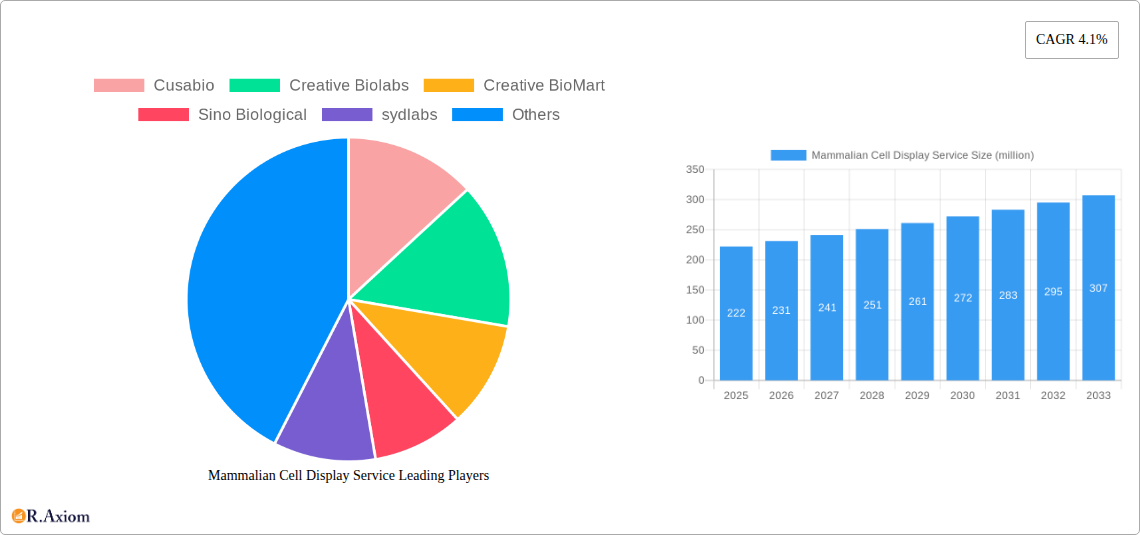
Mammalian Cell Display Service Market Size (In Million)

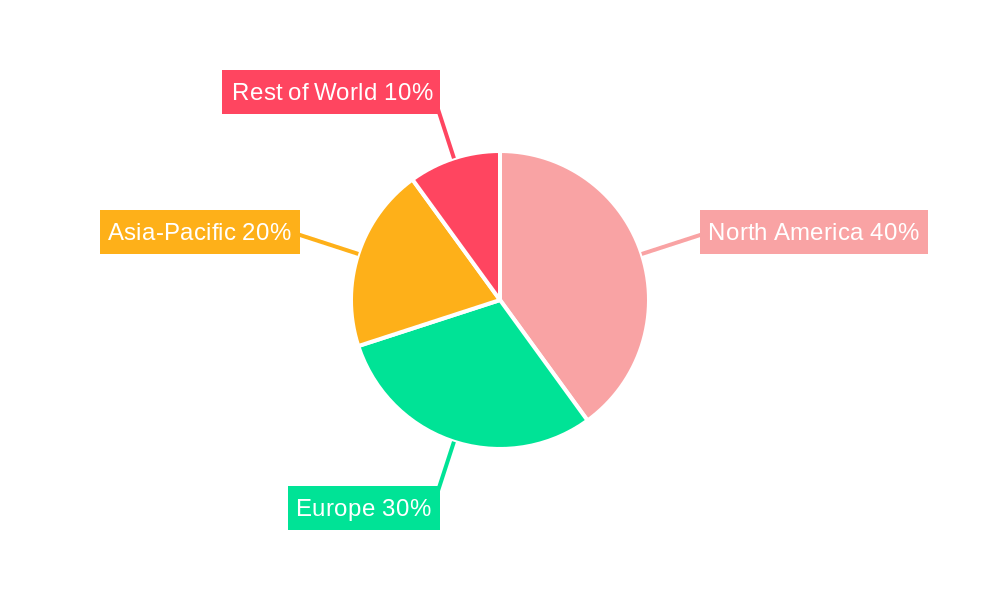
The market is segmented by application (e.g., antibody discovery, protein engineering, vaccine development) and by end-user (pharmaceutical companies, academic research institutions, biotechnology companies). While precise segmental breakdowns are unavailable, a reasonable assumption, given industry trends, suggests a significant portion of market revenue is driven by the pharmaceutical industry due to their high R&D spending. Geographic distribution likely shows a concentration in developed regions such as North America and Europe due to higher investment in biotechnology and advanced healthcare infrastructure. However, emerging economies in Asia-Pacific are expected to witness substantial growth in the coming years, driven by increasing R&D activities and favorable regulatory environments. Overall, the mammalian cell display service market presents a promising outlook, with continued expansion anticipated throughout the forecast period.
Mammalian Cell Display Service Company Market Share
Mammalian Cell Display Service Market Report: 2019-2033
This comprehensive report provides a detailed analysis of the global mammalian cell display service market, encompassing historical data (2019-2024), the base year (2025), and a forecast period (2025-2033). It delves into market size, growth drivers, challenges, opportunities, competitive landscape, and key technological advancements. The report offers actionable insights for industry stakeholders, including established players and emerging companies. The market is projected to reach $XX million by 2033, representing a significant growth opportunity.
Mammalian Cell Display Service Market Concentration & Innovation
The mammalian cell display service market exhibits a moderately concentrated landscape, with several key players holding significant market share. Cusabio, Creative Biolabs, Creative BioMart, Sino Biological, sydlabs, and GenScript are among the prominent players, collectively accounting for approximately 60% of the market in 2025. Market share fluctuates based on technological advancements, pricing strategies, and client acquisition. M&A activity has been moderate in recent years, with deal values averaging $XX million per transaction. Innovation is a key driver, fueled by advancements in cell engineering, high-throughput screening, and automation. Regulatory frameworks, particularly concerning the safety and efficacy of cell-based products, significantly influence market dynamics. Product substitutes, such as phage display and yeast display, present competitive pressures, necessitating continuous innovation. End-user trends, including increased demand from pharmaceutical and biotechnology companies, are driving market growth.
- Market Concentration: Moderately concentrated, with top 6 players holding ~60% market share (2025).
- Innovation Drivers: Advancements in cell engineering, high-throughput screening, automation.
- Regulatory Frameworks: Stringent regulations impacting product development and market access.
- Product Substitutes: Phage display, yeast display.
- End-User Trends: Increasing demand from pharmaceutical and biotechnology sectors.
- M&A Activity: Moderate activity, average deal value of $XX million.
Mammalian Cell Display Service Industry Trends & Insights
The mammalian cell display service market is experiencing robust growth, driven by the rising demand for novel therapeutic antibodies and the increasing adoption of cell-based technologies in drug discovery and development. The market's Compound Annual Growth Rate (CAGR) is estimated at XX% during the forecast period (2025-2033). This growth is fueled by several factors, including advancements in display technology, such as the development of more efficient and robust display systems. The penetration rate of mammalian cell display services in the biopharmaceutical industry is increasing steadily, reaching approximately XX% in 2025. Technological disruptions, such as the integration of artificial intelligence (AI) and machine learning (ML) in screening and selection processes, are significantly improving efficiency and reducing development time. Consumer preferences are shifting towards more personalized and targeted therapeutics, further driving the demand for customized cell display services. Intense competition necessitates continuous innovation and strategic partnerships to maintain market leadership.
Dominant Markets & Segments in Mammalian Cell Display Service
The North American region currently dominates the mammalian cell display service market, holding approximately 45% of the global market share in 2025. This dominance is primarily attributed to:
- Strong presence of pharmaceutical and biotechnology companies: A large number of major pharmaceutical and biotechnology firms are located in North America, fueling the demand for cell display services.
- Robust research and development infrastructure: The region has a well-established research and development infrastructure, supporting the growth of this sector.
- Favorable regulatory environment: A relatively favorable regulatory environment facilitates quicker approval and adoption of new technologies.
- High investment in biotechnological research: Significant government and private investments in biotechnological research underpin innovation and market expansion.
The European and Asian markets are also experiencing significant growth, driven by increasing investments in healthcare infrastructure and growing adoption of cell-based therapies. However, regulatory hurdles and varying levels of technological advancement across different countries pose challenges to market penetration.
Mammalian Cell Display Service Product Developments
Recent advancements in mammalian cell display technology have focused on improving the efficiency and throughput of screening processes. This includes the development of more efficient selection methods, the use of high-throughput screening platforms, and the integration of advanced analytical techniques. New applications are constantly emerging, expanding the market beyond antibody discovery to include the identification of novel receptors, ligands, and enzymes. The competitive advantage in this market lies in offering customized services, higher throughput, superior quality, and cost-effective solutions. The trend towards automation and the integration of AI and ML tools will further streamline workflows and optimize outcomes.
Report Scope & Segmentation Analysis
This report segments the mammalian cell display service market based on various factors, including:
By Service Type: This segment includes antibody discovery and engineering, receptor identification, and ligand screening. Each segment demonstrates distinct growth trajectories based on technological advancements and market demands. Antibody discovery currently dominates this segment, representing approximately 65% of the market in 2025.
By Application: This includes therapeutic antibody development, vaccine development, diagnostic tool development, and other applications. Therapeutic antibody development represents the largest segment, with approximately 70% of the market share in 2025.
By End-User: This comprises pharmaceutical and biotechnology companies, academic research institutions, and contract research organizations (CROs). Pharmaceutical and biotechnology companies are the primary end-users, driving the majority of market demand.
Key Drivers of Mammalian Cell Display Service Growth
Several factors are contributing to the growth of the mammalian cell display service market. The increasing demand for novel therapeutic antibodies, driven by the rising prevalence of chronic diseases and unmet medical needs, is a key driver. Advancements in cell engineering techniques, resulting in higher efficiency and throughput, are further accelerating market growth. Government funding and initiatives supporting biotechnology research and development are creating a favorable environment for market expansion. The increasing adoption of cell-based technologies in drug discovery and development is also bolstering market growth. Finally, the growing awareness of the potential of personalized medicine is creating opportunities for customized cell display services.
Challenges in the Mammalian Cell Display Service Sector
The mammalian cell display service sector faces several challenges. Regulatory hurdles associated with the development and approval of cell-based therapies can significantly impede market growth. Supply chain issues, including the availability of high-quality reagents and specialized equipment, can impact operational efficiency and cost. Intense competition from existing players and the emergence of new technologies present significant competitive pressures. The high cost of development and manufacturing can restrict market access, particularly for smaller companies and emerging players. These factors, collectively, can potentially reduce the market's overall growth rate by an estimated XX% by 2033.
Emerging Opportunities in Mammalian Cell Display Service
The mammalian cell display service market presents several emerging opportunities. The expansion into new therapeutic areas, such as immuno-oncology and gene therapy, presents significant potential for growth. The development of more efficient and versatile display platforms offers opportunities for innovation and market expansion. The increasing adoption of AI and ML in screening and selection processes can significantly improve the efficiency and effectiveness of mammalian cell display services. The growing demand for personalized medicine presents opportunities for the development of customized cell display services. The integration of advanced analytical techniques enables more precise characterization and selection of superior candidates.
Leading Players in the Mammalian Cell Display Service Market
Key Developments in Mammalian Cell Display Service Industry
- 2022 Q4: Creative Biolabs launched a new high-throughput mammalian cell display platform.
- 2023 Q1: Sino Biological announced a strategic partnership with a major pharmaceutical company for antibody discovery.
- 2023 Q3: Cusabio secured significant funding to expand its mammalian cell display service capabilities.
- 2024 Q2: GenScript introduced a novel cell line engineering technology for improved display efficiency. (Further key developments can be added as data becomes available)
Strategic Outlook for Mammalian Cell Display Service Market
The mammalian cell display service market is poised for continued growth over the forecast period (2025-2033). The factors contributing to this positive outlook include ongoing technological advancements, increasing demand from the pharmaceutical and biotechnology sectors, and supportive government initiatives. The increasing adoption of advanced analytical techniques and the integration of AI and ML tools will further enhance the efficiency and effectiveness of these services. Strategic partnerships and collaborations among key players will likely play a crucial role in shaping market dynamics. The expansion into new therapeutic areas and the development of more sophisticated display platforms will create further opportunities for growth and innovation within this dynamic sector.
Mammalian Cell Display Service Segmentation
-
1. Application
- 1.1. Antibody Screening
- 1.2. Peptide Display
- 1.3. Membrane Protein Display
- 1.4. Other
-
2. Type
- 2.1. Cell Display Based on Membrane Proteins
- 2.2. Cell Display Based on Secreted Proteins
- 2.3. Whole Cell Display
- 2.4. Other
Mammalian Cell Display Service Segmentation By Geography
-
1. North America
- 1.1. United States
- 1.2. Canada
- 1.3. Mexico
-
2. South America
- 2.1. Brazil
- 2.2. Argentina
- 2.3. Rest of South America
-
3. Europe
- 3.1. United Kingdom
- 3.2. Germany
- 3.3. France
- 3.4. Italy
- 3.5. Spain
- 3.6. Russia
- 3.7. Benelux
- 3.8. Nordics
- 3.9. Rest of Europe
-
4. Middle East & Africa
- 4.1. Turkey
- 4.2. Israel
- 4.3. GCC
- 4.4. North Africa
- 4.5. South Africa
- 4.6. Rest of Middle East & Africa
-
5. Asia Pacific
- 5.1. China
- 5.2. India
- 5.3. Japan
- 5.4. South Korea
- 5.5. ASEAN
- 5.6. Oceania
- 5.7. Rest of Asia Pacific
Mammalian Cell Display Service Regional Market Share
Geographic Coverage of Mammalian Cell Display Service
Mammalian Cell Display Service REPORT HIGHLIGHTS
| Aspects | Details |
|---|---|
| Study Period | 2020-2034 |
| Base Year | 2025 |
| Estimated Year | 2026 |
| Forecast Period | 2026-2034 |
| Historical Period | 2020-2025 |
| Growth Rate | CAGR of 4.1% from 2020-2034 |
| Segmentation |
|
Table of Contents
- 1. Introduction
- 1.1. Research Scope
- 1.2. Market Segmentation
- 1.3. Research Methodology
- 1.4. Definitions and Assumptions
- 2. Executive Summary
- 2.1. Introduction
- 3. Market Dynamics
- 3.1. Introduction
- 3.2. Market Drivers
- 3.3. Market Restrains
- 3.4. Market Trends
- 4. Market Factor Analysis
- 4.1. Porters Five Forces
- 4.2. Supply/Value Chain
- 4.3. PESTEL analysis
- 4.4. Market Entropy
- 4.5. Patent/Trademark Analysis
- 5. Global Mammalian Cell Display Service Analysis, Insights and Forecast, 2020-2032
- 5.1. Market Analysis, Insights and Forecast - by Application
- 5.1.1. Antibody Screening
- 5.1.2. Peptide Display
- 5.1.3. Membrane Protein Display
- 5.1.4. Other
- 5.2. Market Analysis, Insights and Forecast - by Type
- 5.2.1. Cell Display Based on Membrane Proteins
- 5.2.2. Cell Display Based on Secreted Proteins
- 5.2.3. Whole Cell Display
- 5.2.4. Other
- 5.3. Market Analysis, Insights and Forecast - by Region
- 5.3.1. North America
- 5.3.2. South America
- 5.3.3. Europe
- 5.3.4. Middle East & Africa
- 5.3.5. Asia Pacific
- 5.1. Market Analysis, Insights and Forecast - by Application
- 6. North America Mammalian Cell Display Service Analysis, Insights and Forecast, 2020-2032
- 6.1. Market Analysis, Insights and Forecast - by Application
- 6.1.1. Antibody Screening
- 6.1.2. Peptide Display
- 6.1.3. Membrane Protein Display
- 6.1.4. Other
- 6.2. Market Analysis, Insights and Forecast - by Type
- 6.2.1. Cell Display Based on Membrane Proteins
- 6.2.2. Cell Display Based on Secreted Proteins
- 6.2.3. Whole Cell Display
- 6.2.4. Other
- 6.1. Market Analysis, Insights and Forecast - by Application
- 7. South America Mammalian Cell Display Service Analysis, Insights and Forecast, 2020-2032
- 7.1. Market Analysis, Insights and Forecast - by Application
- 7.1.1. Antibody Screening
- 7.1.2. Peptide Display
- 7.1.3. Membrane Protein Display
- 7.1.4. Other
- 7.2. Market Analysis, Insights and Forecast - by Type
- 7.2.1. Cell Display Based on Membrane Proteins
- 7.2.2. Cell Display Based on Secreted Proteins
- 7.2.3. Whole Cell Display
- 7.2.4. Other
- 7.1. Market Analysis, Insights and Forecast - by Application
- 8. Europe Mammalian Cell Display Service Analysis, Insights and Forecast, 2020-2032
- 8.1. Market Analysis, Insights and Forecast - by Application
- 8.1.1. Antibody Screening
- 8.1.2. Peptide Display
- 8.1.3. Membrane Protein Display
- 8.1.4. Other
- 8.2. Market Analysis, Insights and Forecast - by Type
- 8.2.1. Cell Display Based on Membrane Proteins
- 8.2.2. Cell Display Based on Secreted Proteins
- 8.2.3. Whole Cell Display
- 8.2.4. Other
- 8.1. Market Analysis, Insights and Forecast - by Application
- 9. Middle East & Africa Mammalian Cell Display Service Analysis, Insights and Forecast, 2020-2032
- 9.1. Market Analysis, Insights and Forecast - by Application
- 9.1.1. Antibody Screening
- 9.1.2. Peptide Display
- 9.1.3. Membrane Protein Display
- 9.1.4. Other
- 9.2. Market Analysis, Insights and Forecast - by Type
- 9.2.1. Cell Display Based on Membrane Proteins
- 9.2.2. Cell Display Based on Secreted Proteins
- 9.2.3. Whole Cell Display
- 9.2.4. Other
- 9.1. Market Analysis, Insights and Forecast - by Application
- 10. Asia Pacific Mammalian Cell Display Service Analysis, Insights and Forecast, 2020-2032
- 10.1. Market Analysis, Insights and Forecast - by Application
- 10.1.1. Antibody Screening
- 10.1.2. Peptide Display
- 10.1.3. Membrane Protein Display
- 10.1.4. Other
- 10.2. Market Analysis, Insights and Forecast - by Type
- 10.2.1. Cell Display Based on Membrane Proteins
- 10.2.2. Cell Display Based on Secreted Proteins
- 10.2.3. Whole Cell Display
- 10.2.4. Other
- 10.1. Market Analysis, Insights and Forecast - by Application
- 11. Competitive Analysis
- 11.1. Global Market Share Analysis 2025
- 11.2. Company Profiles
- 11.2.1 Cusabio
- 11.2.1.1. Overview
- 11.2.1.2. Products
- 11.2.1.3. SWOT Analysis
- 11.2.1.4. Recent Developments
- 11.2.1.5. Financials (Based on Availability)
- 11.2.2 Creative Biolabs
- 11.2.2.1. Overview
- 11.2.2.2. Products
- 11.2.2.3. SWOT Analysis
- 11.2.2.4. Recent Developments
- 11.2.2.5. Financials (Based on Availability)
- 11.2.3 Creative BioMart
- 11.2.3.1. Overview
- 11.2.3.2. Products
- 11.2.3.3. SWOT Analysis
- 11.2.3.4. Recent Developments
- 11.2.3.5. Financials (Based on Availability)
- 11.2.4 Sino Biological
- 11.2.4.1. Overview
- 11.2.4.2. Products
- 11.2.4.3. SWOT Analysis
- 11.2.4.4. Recent Developments
- 11.2.4.5. Financials (Based on Availability)
- 11.2.5 sydlabs
- 11.2.5.1. Overview
- 11.2.5.2. Products
- 11.2.5.3. SWOT Analysis
- 11.2.5.4. Recent Developments
- 11.2.5.5. Financials (Based on Availability)
- 11.2.6 GenScript
- 11.2.6.1. Overview
- 11.2.6.2. Products
- 11.2.6.3. SWOT Analysis
- 11.2.6.4. Recent Developments
- 11.2.6.5. Financials (Based on Availability)
- 11.2.1 Cusabio
List of Figures
- Figure 1: Global Mammalian Cell Display Service Revenue Breakdown (million, %) by Region 2025 & 2033
- Figure 2: North America Mammalian Cell Display Service Revenue (million), by Application 2025 & 2033
- Figure 3: North America Mammalian Cell Display Service Revenue Share (%), by Application 2025 & 2033
- Figure 4: North America Mammalian Cell Display Service Revenue (million), by Type 2025 & 2033
- Figure 5: North America Mammalian Cell Display Service Revenue Share (%), by Type 2025 & 2033
- Figure 6: North America Mammalian Cell Display Service Revenue (million), by Country 2025 & 2033
- Figure 7: North America Mammalian Cell Display Service Revenue Share (%), by Country 2025 & 2033
- Figure 8: South America Mammalian Cell Display Service Revenue (million), by Application 2025 & 2033
- Figure 9: South America Mammalian Cell Display Service Revenue Share (%), by Application 2025 & 2033
- Figure 10: South America Mammalian Cell Display Service Revenue (million), by Type 2025 & 2033
- Figure 11: South America Mammalian Cell Display Service Revenue Share (%), by Type 2025 & 2033
- Figure 12: South America Mammalian Cell Display Service Revenue (million), by Country 2025 & 2033
- Figure 13: South America Mammalian Cell Display Service Revenue Share (%), by Country 2025 & 2033
- Figure 14: Europe Mammalian Cell Display Service Revenue (million), by Application 2025 & 2033
- Figure 15: Europe Mammalian Cell Display Service Revenue Share (%), by Application 2025 & 2033
- Figure 16: Europe Mammalian Cell Display Service Revenue (million), by Type 2025 & 2033
- Figure 17: Europe Mammalian Cell Display Service Revenue Share (%), by Type 2025 & 2033
- Figure 18: Europe Mammalian Cell Display Service Revenue (million), by Country 2025 & 2033
- Figure 19: Europe Mammalian Cell Display Service Revenue Share (%), by Country 2025 & 2033
- Figure 20: Middle East & Africa Mammalian Cell Display Service Revenue (million), by Application 2025 & 2033
- Figure 21: Middle East & Africa Mammalian Cell Display Service Revenue Share (%), by Application 2025 & 2033
- Figure 22: Middle East & Africa Mammalian Cell Display Service Revenue (million), by Type 2025 & 2033
- Figure 23: Middle East & Africa Mammalian Cell Display Service Revenue Share (%), by Type 2025 & 2033
- Figure 24: Middle East & Africa Mammalian Cell Display Service Revenue (million), by Country 2025 & 2033
- Figure 25: Middle East & Africa Mammalian Cell Display Service Revenue Share (%), by Country 2025 & 2033
- Figure 26: Asia Pacific Mammalian Cell Display Service Revenue (million), by Application 2025 & 2033
- Figure 27: Asia Pacific Mammalian Cell Display Service Revenue Share (%), by Application 2025 & 2033
- Figure 28: Asia Pacific Mammalian Cell Display Service Revenue (million), by Type 2025 & 2033
- Figure 29: Asia Pacific Mammalian Cell Display Service Revenue Share (%), by Type 2025 & 2033
- Figure 30: Asia Pacific Mammalian Cell Display Service Revenue (million), by Country 2025 & 2033
- Figure 31: Asia Pacific Mammalian Cell Display Service Revenue Share (%), by Country 2025 & 2033
List of Tables
- Table 1: Global Mammalian Cell Display Service Revenue million Forecast, by Application 2020 & 2033
- Table 2: Global Mammalian Cell Display Service Revenue million Forecast, by Type 2020 & 2033
- Table 3: Global Mammalian Cell Display Service Revenue million Forecast, by Region 2020 & 2033
- Table 4: Global Mammalian Cell Display Service Revenue million Forecast, by Application 2020 & 2033
- Table 5: Global Mammalian Cell Display Service Revenue million Forecast, by Type 2020 & 2033
- Table 6: Global Mammalian Cell Display Service Revenue million Forecast, by Country 2020 & 2033
- Table 7: United States Mammalian Cell Display Service Revenue (million) Forecast, by Application 2020 & 2033
- Table 8: Canada Mammalian Cell Display Service Revenue (million) Forecast, by Application 2020 & 2033
- Table 9: Mexico Mammalian Cell Display Service Revenue (million) Forecast, by Application 2020 & 2033
- Table 10: Global Mammalian Cell Display Service Revenue million Forecast, by Application 2020 & 2033
- Table 11: Global Mammalian Cell Display Service Revenue million Forecast, by Type 2020 & 2033
- Table 12: Global Mammalian Cell Display Service Revenue million Forecast, by Country 2020 & 2033
- Table 13: Brazil Mammalian Cell Display Service Revenue (million) Forecast, by Application 2020 & 2033
- Table 14: Argentina Mammalian Cell Display Service Revenue (million) Forecast, by Application 2020 & 2033
- Table 15: Rest of South America Mammalian Cell Display Service Revenue (million) Forecast, by Application 2020 & 2033
- Table 16: Global Mammalian Cell Display Service Revenue million Forecast, by Application 2020 & 2033
- Table 17: Global Mammalian Cell Display Service Revenue million Forecast, by Type 2020 & 2033
- Table 18: Global Mammalian Cell Display Service Revenue million Forecast, by Country 2020 & 2033
- Table 19: United Kingdom Mammalian Cell Display Service Revenue (million) Forecast, by Application 2020 & 2033
- Table 20: Germany Mammalian Cell Display Service Revenue (million) Forecast, by Application 2020 & 2033
- Table 21: France Mammalian Cell Display Service Revenue (million) Forecast, by Application 2020 & 2033
- Table 22: Italy Mammalian Cell Display Service Revenue (million) Forecast, by Application 2020 & 2033
- Table 23: Spain Mammalian Cell Display Service Revenue (million) Forecast, by Application 2020 & 2033
- Table 24: Russia Mammalian Cell Display Service Revenue (million) Forecast, by Application 2020 & 2033
- Table 25: Benelux Mammalian Cell Display Service Revenue (million) Forecast, by Application 2020 & 2033
- Table 26: Nordics Mammalian Cell Display Service Revenue (million) Forecast, by Application 2020 & 2033
- Table 27: Rest of Europe Mammalian Cell Display Service Revenue (million) Forecast, by Application 2020 & 2033
- Table 28: Global Mammalian Cell Display Service Revenue million Forecast, by Application 2020 & 2033
- Table 29: Global Mammalian Cell Display Service Revenue million Forecast, by Type 2020 & 2033
- Table 30: Global Mammalian Cell Display Service Revenue million Forecast, by Country 2020 & 2033
- Table 31: Turkey Mammalian Cell Display Service Revenue (million) Forecast, by Application 2020 & 2033
- Table 32: Israel Mammalian Cell Display Service Revenue (million) Forecast, by Application 2020 & 2033
- Table 33: GCC Mammalian Cell Display Service Revenue (million) Forecast, by Application 2020 & 2033
- Table 34: North Africa Mammalian Cell Display Service Revenue (million) Forecast, by Application 2020 & 2033
- Table 35: South Africa Mammalian Cell Display Service Revenue (million) Forecast, by Application 2020 & 2033
- Table 36: Rest of Middle East & Africa Mammalian Cell Display Service Revenue (million) Forecast, by Application 2020 & 2033
- Table 37: Global Mammalian Cell Display Service Revenue million Forecast, by Application 2020 & 2033
- Table 38: Global Mammalian Cell Display Service Revenue million Forecast, by Type 2020 & 2033
- Table 39: Global Mammalian Cell Display Service Revenue million Forecast, by Country 2020 & 2033
- Table 40: China Mammalian Cell Display Service Revenue (million) Forecast, by Application 2020 & 2033
- Table 41: India Mammalian Cell Display Service Revenue (million) Forecast, by Application 2020 & 2033
- Table 42: Japan Mammalian Cell Display Service Revenue (million) Forecast, by Application 2020 & 2033
- Table 43: South Korea Mammalian Cell Display Service Revenue (million) Forecast, by Application 2020 & 2033
- Table 44: ASEAN Mammalian Cell Display Service Revenue (million) Forecast, by Application 2020 & 2033
- Table 45: Oceania Mammalian Cell Display Service Revenue (million) Forecast, by Application 2020 & 2033
- Table 46: Rest of Asia Pacific Mammalian Cell Display Service Revenue (million) Forecast, by Application 2020 & 2033
Frequently Asked Questions
1. What is the projected Compound Annual Growth Rate (CAGR) of the Mammalian Cell Display Service?
The projected CAGR is approximately 4.1%.
2. Which companies are prominent players in the Mammalian Cell Display Service?
Key companies in the market include Cusabio, Creative Biolabs, Creative BioMart, Sino Biological, sydlabs, GenScript.
3. What are the main segments of the Mammalian Cell Display Service?
The market segments include Application, Type.
4. Can you provide details about the market size?
The market size is estimated to be USD 222 million as of 2022.
5. What are some drivers contributing to market growth?
N/A
6. What are the notable trends driving market growth?
N/A
7. Are there any restraints impacting market growth?
N/A
8. Can you provide examples of recent developments in the market?
N/A
9. What pricing options are available for accessing the report?
Pricing options include single-user, multi-user, and enterprise licenses priced at USD 4250.00, USD 6375.00, and USD 8500.00 respectively.
10. Is the market size provided in terms of value or volume?
The market size is provided in terms of value, measured in million.
11. Are there any specific market keywords associated with the report?
Yes, the market keyword associated with the report is "Mammalian Cell Display Service," which aids in identifying and referencing the specific market segment covered.
12. How do I determine which pricing option suits my needs best?
The pricing options vary based on user requirements and access needs. Individual users may opt for single-user licenses, while businesses requiring broader access may choose multi-user or enterprise licenses for cost-effective access to the report.
13. Are there any additional resources or data provided in the Mammalian Cell Display Service report?
While the report offers comprehensive insights, it's advisable to review the specific contents or supplementary materials provided to ascertain if additional resources or data are available.
14. How can I stay updated on further developments or reports in the Mammalian Cell Display Service?
To stay informed about further developments, trends, and reports in the Mammalian Cell Display Service, consider subscribing to industry newsletters, following relevant companies and organizations, or regularly checking reputable industry news sources and publications.
Methodology
Step 1 - Identification of Relevant Samples Size from Population Database


Step 2 - Approaches for Defining Global Market Size (Value, Volume* & Price*)

Note*: In applicable scenarios
Step 3 - Data Sources
Primary Research
- Web Analytics
- Survey Reports
- Research Institute
- Latest Research Reports
- Opinion Leaders
Secondary Research
- Annual Reports
- White Paper
- Latest Press Release
- Industry Association
- Paid Database
- Investor Presentations

Step 4 - Data Triangulation
Involves using different sources of information in order to increase the validity of a study
These sources are likely to be stakeholders in a program - participants, other researchers, program staff, other community members, and so on.
Then we put all data in single framework & apply various statistical tools to find out the dynamic on the market.
During the analysis stage, feedback from the stakeholder groups would be compared to determine areas of agreement as well as areas of divergence

