


Key Insights
The Mammography Market is poised for substantial expansion, driven by increasing breast cancer incidence, enhanced screening initiatives, and continuous technological advancements. Valued at an estimated $2742.5 million in 2023, the market is projected to reach approximately $7685.2 million by 2034, demonstrating a robust Compound Annual Growth Rate (CAGR) of 9.7% over the forecast period. This growth trajectory is fundamentally underpinned by the global emphasis on early disease detection and the transition from conventional 2D to advanced 3D mammography systems.
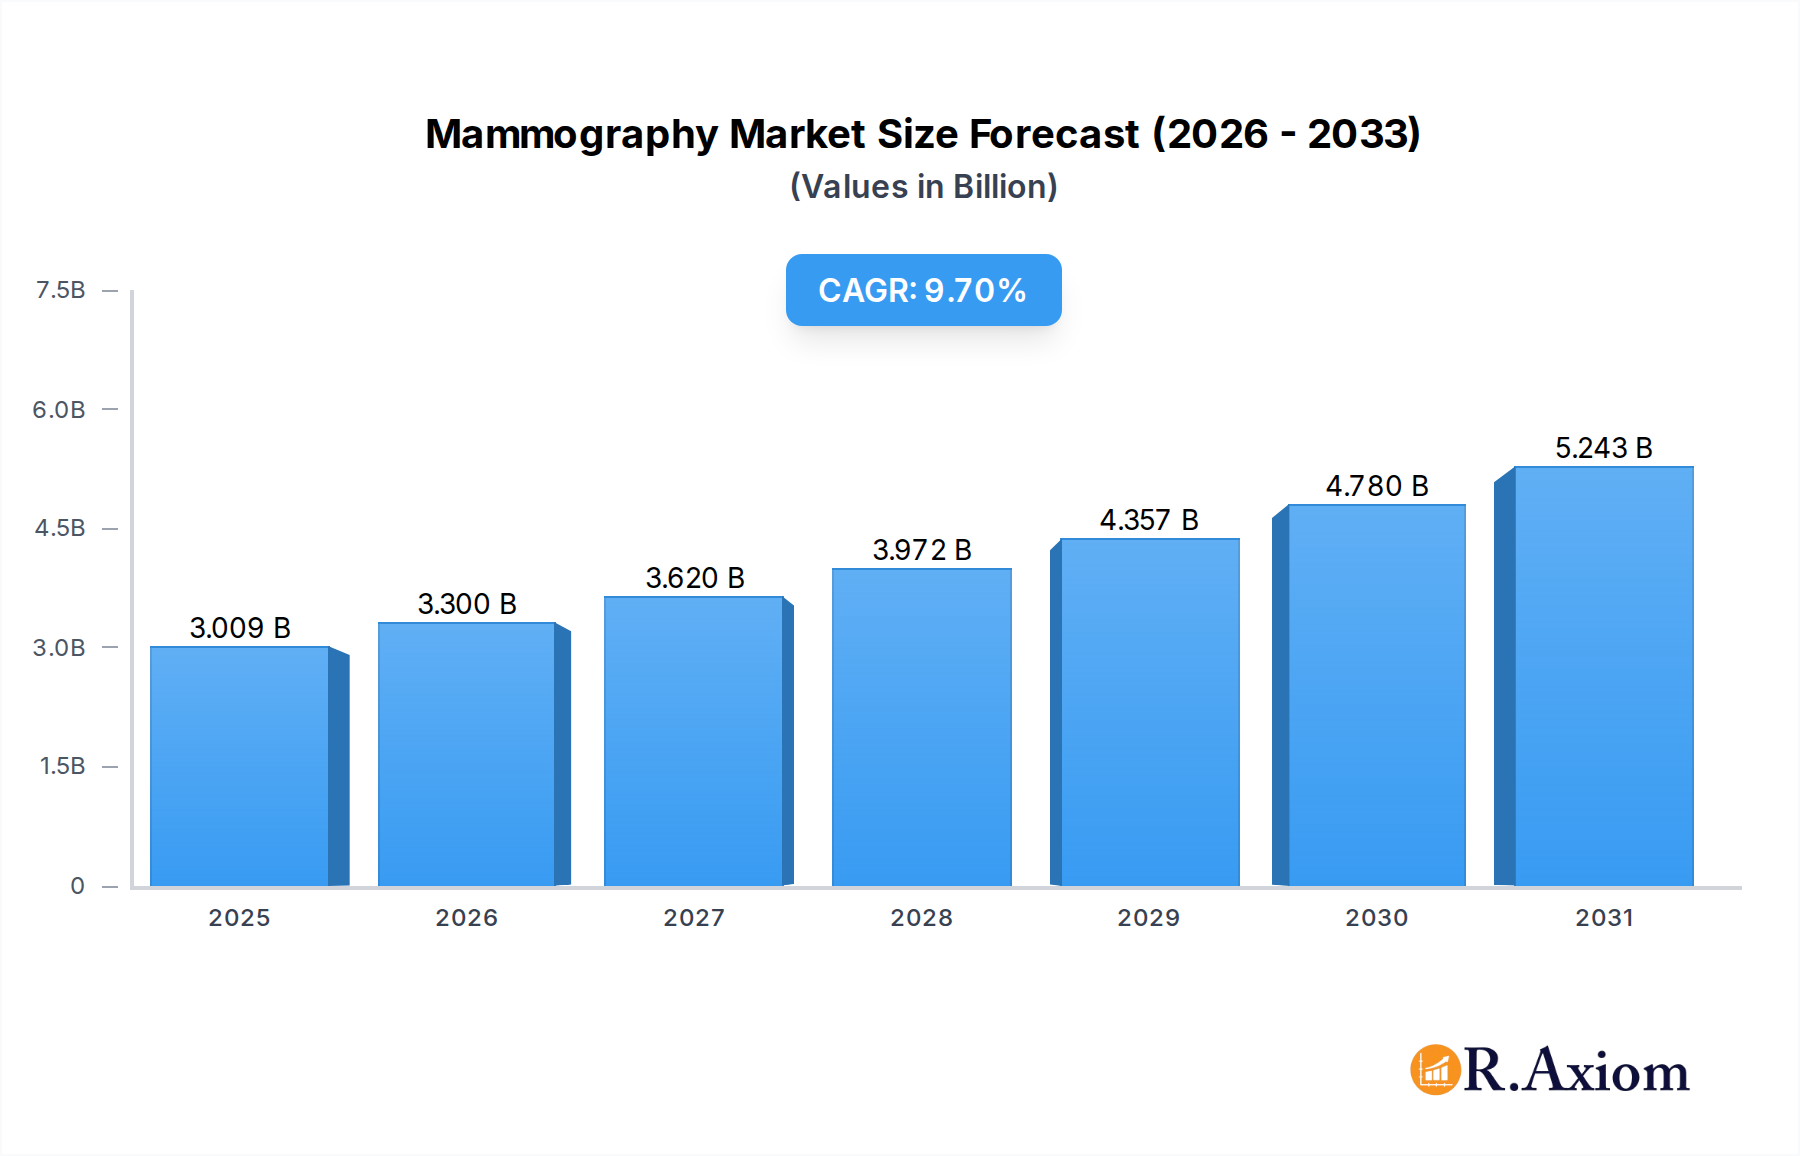
Mammography Market Size (In Billion)

Key demand drivers include the rising prevalence of breast cancer, which necessitates broader and more frequent screening, especially among at-risk populations. Government and non-governmental organizations' initiatives to raise awareness about the importance of early diagnosis are significantly contributing to market uplift. Furthermore, the integration of artificial intelligence and advanced digital technologies is transforming the efficiency and accuracy of mammographic imaging. The Digital Systems Market, for instance, represents a dominant segment, offering superior image quality, faster processing, and improved diagnostic capabilities compared to traditional film-screen systems. This shift is also fueling the expansion of the 3D Systems Market, which provides clearer images by reducing tissue overlap, crucial for dense breast tissue analysis.
Mammography Company Market Share
From a macro perspective, improvements in healthcare infrastructure, particularly in emerging economies, are expanding the reach of diagnostic services. The increasing geriatric population, a demographic highly susceptible to breast cancer, further propels the demand for regular screenings. While North America and Europe currently hold significant revenue shares due to established healthcare systems and high adoption rates of advanced technologies, the Asia Pacific region is expected to witness the fastest growth, driven by increasing healthcare expenditure, awareness programs, and a growing patient pool. The competitive landscape is characterized by innovation-driven strategies, with leading players focusing on product development, strategic collaborations, and geographical expansion to capitalize on untapped opportunities. The broader Medical Imaging Equipment Market continues to see significant investment, with mammography remaining a critical component. This sustained innovation and expanding application base position the Mammography Market for sustained growth over the next decade.
Digital Systems Dominance in the Mammography Market
The product type segment analysis reveals that the Digital Systems Market holds a commanding position within the Mammography Market, primarily due to its technological superiority and operational efficiencies over traditional film-screen or analog systems. Digital mammography, encompassing both computed radiography (CR) and direct radiography (DR) technologies, provides clinicians with several distinct advantages, including enhanced image quality, reduced radiation dose, and increased workflow efficiency. The ability to manipulate images post-acquisition—adjusting contrast, brightness, and zoom—significantly aids in better visualization of breast tissue, leading to more accurate diagnoses and reduced recall rates for additional imaging.
This dominance is further solidified by the increasing integration of computer-aided detection (CAD) systems and teleradiology capabilities, which are inherently compatible with digital platforms. These advancements allow for quicker interpretation and review of images, particularly crucial in high-volume screening environments. Major players like Hologic, Inc., GE Healthcare, Siemens Healthineers, and Koninklijke Philips N.V. have heavily invested in the development and proliferation of digital mammography solutions, offering a range of systems from full-field digital mammography (FFDM) to digital breast tomosynthesis (DBT) or 3D Systems Market. The market share of digital systems is consistently growing, driven by both replacement demand from older analog units and new installations in developing healthcare facilities globally. Diagnostic centers, hospitals, and specialty clinics are increasingly opting for digital solutions due to their long-term cost-effectiveness, environmental benefits (elimination of chemical processing), and improved patient experience.
While the initial capital expenditure for digital systems can be higher than analog counterparts, the operational savings, improved diagnostic accuracy, and patient throughput often justify the investment. The trend towards integrating these systems with broader hospital information systems (HIS) and picture archiving and communication systems (PACS) further enhances their value proposition. The segment's dominance is expected to consolidate further as technological innovations continue to push the boundaries of imaging resolution and diagnostic utility, making digital mammography the standard of care for breast imaging worldwide. This continuous evolution underpins the significant role of digital technologies in shaping the future trajectory of the Mammography Market.
Key Market Drivers and Constraints in the Mammography Market
The Mammography Market's trajectory is significantly influenced by a confluence of drivers and constraints, each quantified by specific trends or events.
Drivers:
- Increasing Breast Cancer Incidence and Mortality Rates: The global incidence of breast cancer continues to rise, with estimates from the World Health Organization indicating it is the most common cancer among women, accounting for 12.5% of all new cancer cases annually. This rising prevalence directly fuels the demand for effective screening and diagnostic tools like mammography. Early detection through regular screening is critical, as it significantly improves survival rates, driving uptake within the Breast Cancer Screening Market. For instance, 5-year relative survival rates for localized breast cancer are over 99% when detected early, compared to 28% for distant-stage cancer, underscoring the imperative for widespread mammography adoption.
- Technological Advancements in Imaging: Continuous innovation, particularly the transition from 2D to 3D mammography (Digital Breast Tomosynthesis - DBT), is a major driver. DBT offers superior diagnostic accuracy by reducing tissue overlap artifacts, especially beneficial for women with dense breasts. Studies show DBT can increase cancer detection rates by 15-40% and decrease recall rates by 15-30% compared to 2D mammography. This technological leap, prominently seen in the 3D Systems Market, encourages healthcare providers to upgrade existing equipment and invest in newer, more capable systems.
- Growing Awareness and Screening Programs: Government-led and non-governmental organization (NGO) initiatives promoting breast cancer awareness and regular screening are expanding the patient pool undergoing mammography. Campaigns like Breast Cancer Awareness Month globally emphasize the importance of early detection, leading to increased participation in screening programs. Mandatory screening recommendations for women over a certain age in many developed countries (e.g., biennial screening for women aged 50-74 in several European nations) ensure a consistent demand for mammography services.
Constraints:
- High Cost of Advanced Mammography Systems: The capital expenditure for advanced digital mammography and 3D systems is substantial, often ranging from $300,000 to over $500,000 per unit, depending on features and manufacturer. This high upfront cost can be a significant barrier to adoption, particularly for smaller hospitals, clinics, and emerging market healthcare providers, limiting the widespread deployment of the latest technologies in the Mammography Market.
- Concerns Regarding Radiation Exposure: Despite advancements in dose reduction, concerns persist among patients and some clinicians regarding cumulative radiation exposure from repeat mammograms, particularly in younger women. Although the radiation dose from a single mammogram is minimal (typically equivalent to a few months of natural background radiation), public perception and regulatory scrutiny (e.g., ALARA principle – As Low As Reasonably Achievable) can influence screening compliance and necessitate ongoing technological efforts to further minimize dose without compromising image quality.
- Shortage of Skilled Radiologists and Technicians: The specialized nature of mammography interpretation and operation requires highly trained professionals. A global shortage of radiologists, particularly those with expertise in breast imaging and Artificial Intelligence in Healthcare Market integration, poses a significant constraint. This deficit can lead to longer waiting times for appointments and reporting, impacting patient access and the overall efficiency of screening programs, thereby affecting the throughput of the Radiology Equipment Market segment dedicated to mammography.
Competitive Ecosystem of Mammography Market
The competitive landscape of the Mammography Market is characterized by the presence of several established global players and niche specialists, all vying for market share through innovation, strategic partnerships, and geographical expansion. These companies are instrumental in shaping technological trends and market accessibility:
- GE Healthcare: A global leader in medical technology, offering a comprehensive portfolio of mammography systems, including advanced 3D mammography (Digital Breast Tomosynthesis) and AI-powered solutions aimed at improving diagnostic accuracy and workflow efficiency.
- Allengers: An Indian-based company providing a range of medical equipment, including conventional and digital mammography systems, focusing on cost-effective solutions for diverse healthcare settings, particularly in emerging markets.
- FUJIFILM Healthcare Solutions: Known for its diagnostic imaging and information systems, Fujifilm offers advanced digital mammography systems that prioritize image quality, dose efficiency, and streamlined workflow, with solutions integrating seamlessly into existing PACS infrastructure.
- Koninklijke Philips N.V.: A diversified technology company with a strong presence in healthcare, Philips provides advanced mammography solutions designed for enhanced patient experience and diagnostic confidence, often incorporating AI for improved analysis and efficiency.
- Hologic, Inc.: A prominent global medical technology company recognized for its leadership in women's health. Hologic is a pioneer in 3D mammography (DBT) technology, offering a wide array of innovative systems and related products that are critical to the Breast Cancer Screening Market.
- Planmed Oy: A Finnish company specializing in advanced imaging equipment for mammography and orthopedic imaging, known for user-friendly designs and ergonomic solutions that enhance both patient comfort and clinical efficiency.
- Konica Minolta Healthcare: Provides a range of diagnostic imaging solutions, including digital mammography, focusing on high-quality imaging with low dose and solutions that support integrated clinical workflows.
- Siemens Healthcare Private Limited: A major player in medical technology, offering an extensive portfolio of mammography systems, including both 2D and 3D options, integrated with their broader diagnostic imaging and healthcare IT solutions.
- Carestream: While broadly known for various medical imaging solutions, Carestream provides digital radiography systems that can be adapted for mammography applications, emphasizing robust image processing and connectivity.
- Canon Medical: Offers comprehensive diagnostic imaging solutions, including advanced digital mammography systems that leverage its expertise in imaging technology to deliver high-resolution images and enhance diagnostic capabilities within the Radiology Equipment Market.
Recent Developments & Milestones in Mammography Market
Recent innovations and strategic movements underscore the dynamic nature of the Mammography Market, reflecting a continuous drive towards enhanced diagnostic accuracy, patient comfort, and operational efficiency.
- March 2024: Several leading manufacturers showcased next-generation 3D mammography systems at a major radiology conference, featuring faster scan times and enhanced image reconstruction algorithms, aimed at improving patient throughput and reducing motion artifacts. These advancements are crucial for the evolving 3D Systems Market.
- January 2024: A significant partnership was announced between a prominent AI developer and a major mammography system manufacturer to integrate advanced deep learning algorithms directly into mammography workstations. This initiative aims to assist radiologists in detecting subtle lesions and reducing false positives, showcasing the growing influence of the Artificial Intelligence in Healthcare Market.
- November 2023: Regulatory bodies in several European countries updated screening guidelines, recommending 3D mammography as the preferred modality for women with dense breast tissue, further accelerating the adoption of advanced digital systems in the Breast Cancer Screening Market.
- September 2023: A new software update for digital mammography platforms was released, offering improved image processing capabilities and better visualization of microcalcifications, a key indicator of early-stage breast cancer. This enhances the diagnostic utility of the Digital Systems Market.
- June 2023: Several diagnostic centers in North America announced major investments in upgrading their mammography fleet to exclusively utilize 3D digital mammography, reflecting a broader trend towards higher-resolution imaging and improved diagnostic confidence. This signals a commitment among Diagnostic Centers Market players to adopt the latest technologies.
- April 2023: A major medical device company launched a new biopsy guidance system specifically designed for use with 3D mammography, allowing for more precise targeting of suspicious lesions and enhancing the accuracy of diagnostic procedures.
- February 2023: Research grants were awarded for studies exploring the efficacy of contrast-enhanced mammography as a supplementary tool for breast cancer detection in specific patient populations, indicating future avenues for diagnostic enhancement in the Mammography Market.
Regional Market Breakdown for Mammography Market
Geographic analysis reveals diverse growth patterns and adoption rates for the Mammography Market across key regions, driven by varying healthcare infrastructures, awareness levels, and economic capacities.
North America remains a dominant force in the Mammography Market, holding a significant revenue share, estimated to be over 35% in 2023. This region benefits from advanced healthcare infrastructure, high awareness regarding breast cancer screening, favorable reimbursement policies, and early adoption of technological innovations such as 3D mammography. The United States, in particular, leads in investment in premium Radiology Equipment Market solutions and Artificial Intelligence in Healthcare Market applications in diagnostics. The primary demand driver is the well-established screening programs and the presence of major market players aggressively introducing new technologies.
Europe constitutes another substantial market share, accounting for an estimated 30% of the global market. Countries like Germany, France, and the UK are major contributors, characterized by robust public and private healthcare systems and an aging population with increasing breast cancer incidence. The region's growth is driven by national screening programs and a strong focus on clinical research and development. However, market maturity and stringent regulatory frameworks for Medical Device Manufacturing Market products may lead to a slightly slower, albeit stable, CAGR compared to emerging regions.
Asia Pacific is identified as the fastest-growing region in the Mammography Market, with an anticipated CAGR of over 11% during the forecast period. This growth is propelled by improving healthcare access, increasing disposable incomes, rising health awareness campaigns, and a large patient pool in countries like China, India, and Japan. Investments in expanding diagnostic capabilities in Diagnostic Centers Market and hospitals, coupled with government initiatives to combat cancer, are key drivers. The relatively untapped market potential and increasing adoption of modern Medical Imaging Equipment Market systems present significant opportunities for market players.
Latin America and Middle East & Africa (MEA) represent nascent but rapidly growing markets. Latin America, particularly Brazil and Mexico, is experiencing growth due to expanding healthcare infrastructure and increasing prevalence of breast cancer, driving the need for better diagnostic tools. MEA's growth is largely attributable to improvements in healthcare spending, rising awareness, and international collaborations aimed at enhancing cancer care facilities. While these regions currently hold smaller market shares, they offer considerable potential for future expansion as healthcare systems develop and access to screening services improves.
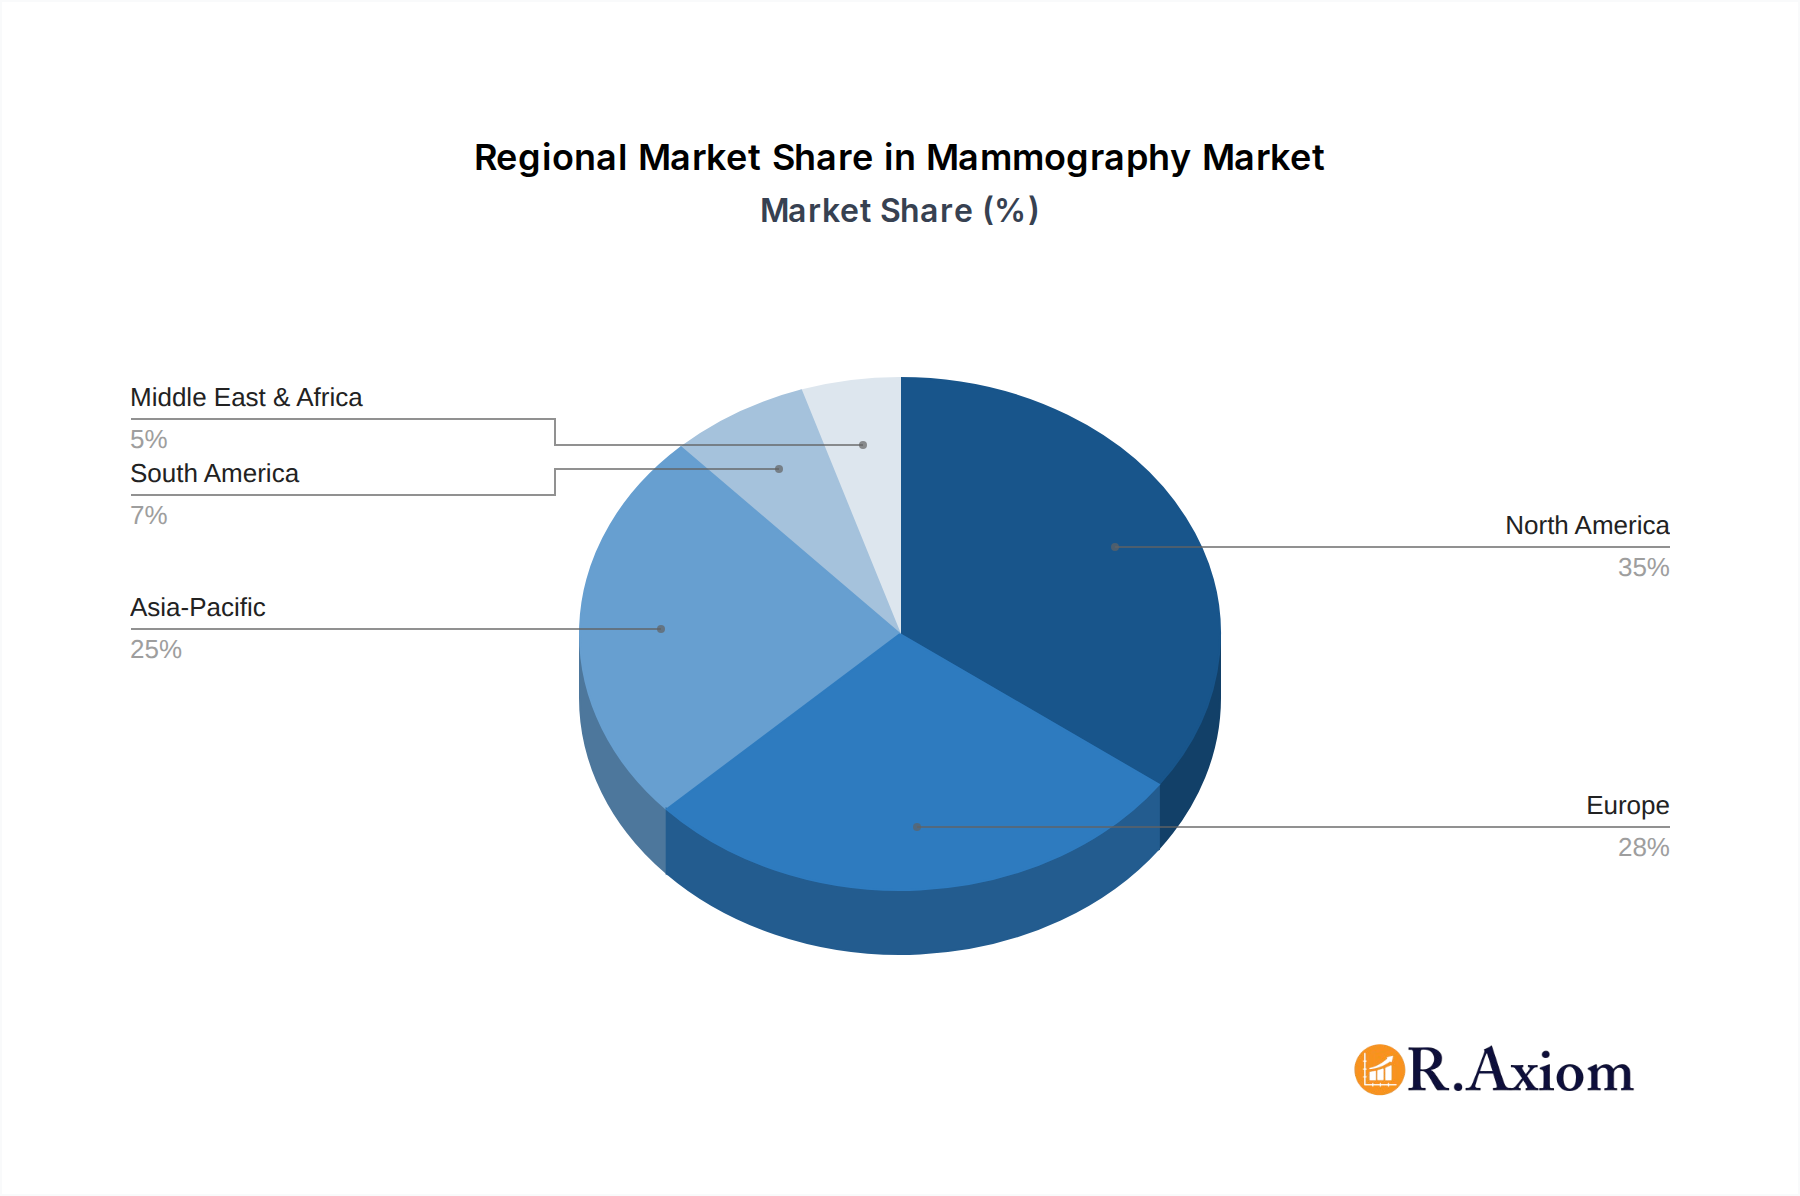
Mammography Regional Market Share
Supply Chain & Raw Material Dynamics for Mammography Market
Understanding the supply chain and raw material dynamics is critical for assessing the resilience and cost structure within the Mammography Market. The production of mammography systems is a complex process, heavily reliant on a specialized supply chain that sources high-precision components and critical raw materials.
Upstream dependencies are significant, with core components like X-ray tubes, digital detectors, and advanced computing units forming the backbone of these systems. The X-Ray Tube Market, for instance, is dominated by a few specialized manufacturers, making the supply vulnerable to disruptions. Key materials in X-ray tubes include tungsten, rhenium, and molybdenum for anodes, and rare earth elements for specialized coatings or scintillators. Prices for these materials can exhibit volatility due to geopolitical factors, mining output fluctuations, and demand from other high-tech industries. Tungsten prices, for example, have seen moderate fluctuations in recent years, impacting the cost of tube manufacturing.
Digital detectors, essential for the Digital Systems Market, primarily utilize amorphous selenium or silicon, which are processed into large-area detector panels. The supply chain for these semiconductor components is intertwined with the broader electronics industry, making it susceptible to global semiconductor shortages, as experienced during the recent pandemic. Similarly, specialized optics, high-voltage power supplies, and advanced display technologies for diagnostic workstations depend on complex global sourcing networks.
Sourcing risks include geographical concentration of raw material extraction (e.g., rare earths from China) and manufacturing hubs for electronic components (e.g., Southeast Asia). Any natural disaster, trade dispute, or pandemic-related lockdown in these regions can lead to significant supply bottlenecks and price escalations. Price volatility of critical inputs directly impacts the manufacturing cost of mammography machines, which can then be passed on to end-users, affecting the overall cost of Radiology Equipment Market solutions. For instance, increased copper prices can impact wiring and circuit board costs, while plastics derived from petroleum are subject to oil price swings. Historically, supply chain disruptions have led to extended lead times for equipment delivery, higher acquisition costs for hospitals and Diagnostic Centers Market, and potential delays in upgrading or expanding diagnostic services. Manufacturers are increasingly focusing on diversifying their supplier base and implementing robust inventory management strategies to mitigate these risks.
Export, Trade Flow & Tariff Impact on Mammography Market
The Mammography Market is inherently global, characterized by significant international trade flows driven by specialized manufacturing hubs and widespread demand for advanced medical imaging technology. Major trade corridors primarily involve exports from developed economies with strong Medical Device Manufacturing Market capabilities to regions with developing healthcare infrastructure or those undergoing equipment upgrades.
Leading Exporting Nations: The United States, Germany, Japan, and the Netherlands are prominent exporters of mammography systems. These countries host major manufacturers like GE Healthcare, Siemens Healthineers, FUJIFILM, Koninklijke Philips N.V., and Hologic, Inc., which produce a significant portion of the world's advanced digital and 3D mammography equipment. Their export volumes are substantial, serving global demand, particularly in the 3D Systems Market.
Leading Importing Nations: Developing nations in Asia Pacific (e.g., China, India, ASEAN countries), Latin America (e.g., Brazil, Mexico), and certain parts of the Middle East and Africa are major importers. These regions are characterized by increasing healthcare investments, expanding screening programs within the Breast Cancer Screening Market, and a growing need to replace outdated analog systems with modern Digital Systems Market.
Trade Policy and Tariff Impact: Tariffs and non-tariff barriers can significantly influence the cost and accessibility of mammography equipment. For instance, the US-China trade tensions in recent years led to tariffs on various medical devices and components, which could increase the landed cost of imported parts or finished mammography systems, potentially affecting affordability in either market. Similarly, the European Union's Medical Device Regulation (MDR), while not a tariff, acts as a significant non-tariff barrier by imposing more stringent requirements for market entry and post-market surveillance. This can increase compliance costs for manufacturers, potentially limiting the availability of certain products or driving up prices for the European Radiology Equipment Market.
Recent trade policy changes, such as regional trade agreements or shifts in import duties, can alter competitive dynamics. A reduction in tariffs between trading blocs could lower equipment costs, stimulating demand in importing nations. Conversely, new protectionist measures could raise prices, potentially slowing the adoption of advanced mammography technologies in affected regions. Geopolitical events and trade disputes therefore demand continuous monitoring by industry participants in the Mammography Market, as they directly impact the cross-border movement, pricing, and ultimately, the accessibility of crucial diagnostic equipment worldwide.
Mammography Segmentation
-
1. Product Type
- 1.1. Film Screen Systems
- 1.2. Digital Systems
- 1.3. Analog Systems
- 1.4. 3D Systems
-
2. Type
- 2.1. Screening Mammography
- 2.2. Diagnostic Mammography
-
3. Application
- 3.1. 2D Mammography
- 3.2. 3D Mammography
- 3.3. Combined 2D and 3D Mammography
-
4. End User
- 4.1. Hospital and Clinics
- 4.2. Ambulatory Surgical Centers
- 4.3. Diagnostic Centers
- 4.4. Others
Mammography Segmentation By Geography
-
1. North America
- 1.1. United States
- 1.2. Canada
- 1.3. Mexico
-
2. South America
- 2.1. Brazil
- 2.2. Argentina
- 2.3. Rest of South America
-
3. Europe
- 3.1. United Kingdom
- 3.2. Germany
- 3.3. France
- 3.4. Italy
- 3.5. Spain
- 3.6. Russia
- 3.7. Benelux
- 3.8. Nordics
- 3.9. Rest of Europe
-
4. Middle East & Africa
- 4.1. Turkey
- 4.2. Israel
- 4.3. GCC
- 4.4. North Africa
- 4.5. South Africa
- 4.6. Rest of Middle East & Africa
-
5. Asia Pacific
- 5.1. China
- 5.2. India
- 5.3. Japan
- 5.4. South Korea
- 5.5. ASEAN
- 5.6. Oceania
- 5.7. Rest of Asia Pacific
Mammography Regional Market Share
Geographic Coverage of Mammography
Mammography REPORT HIGHLIGHTS
| Aspects | Details |
|---|---|
| Study Period | 2020-2034 |
| Base Year | 2025 |
| Estimated Year | 2026 |
| Forecast Period | 2026-2034 |
| Historical Period | 2020-2025 |
| Growth Rate | CAGR of 9.7% from 2020-2034 |
| Segmentation |
|
Table of Contents
- 1. Introduction
- 1.1. Research Scope
- 1.2. Market Segmentation
- 1.3. Research Objective
- 1.4. Definitions and Assumptions
- 2. Executive Summary
- 2.1. Market Snapshot
- 3. Market Dynamics
- 3.1. Market Drivers
- 3.2. Market Restrains
- 3.3. Market Trends
- 3.4. Market Opportunities
- 4. Market Factor Analysis
- 4.1. Porters Five Forces
- 4.1.1. Bargaining Power of Suppliers
- 4.1.2. Bargaining Power of Buyers
- 4.1.3. Threat of New Entrants
- 4.1.4. Threat of Substitutes
- 4.1.5. Competitive Rivalry
- 4.2. PESTEL analysis
- 4.3. BCG Analysis
- 4.3.1. Stars (High Growth, High Market Share)
- 4.3.2. Cash Cows (Low Growth, High Market Share)
- 4.3.3. Question Mark (High Growth, Low Market Share)
- 4.3.4. Dogs (Low Growth, Low Market Share)
- 4.4. Ansoff Matrix Analysis
- 4.5. Supply Chain Analysis
- 4.6. Regulatory Landscape
- 4.7. Current Market Potential and Opportunity Assessment (TAM–SAM–SOM Framework)
- 4.8. RAX Analyst Note
- 4.1. Porters Five Forces
- 5. Market Analysis, Insights and Forecast 2021-2033
- 5.1. Market Analysis, Insights and Forecast - by Product Type
- 5.1.1. Film Screen Systems
- 5.1.2. Digital Systems
- 5.1.3. Analog Systems
- 5.1.4. 3D Systems
- 5.2. Market Analysis, Insights and Forecast - by Type
- 5.2.1. Screening Mammography
- 5.2.2. Diagnostic Mammography
- 5.3. Market Analysis, Insights and Forecast - by Application
- 5.3.1. 2D Mammography
- 5.3.2. 3D Mammography
- 5.3.3. Combined 2D and 3D Mammography
- 5.4. Market Analysis, Insights and Forecast - by End User
- 5.4.1. Hospital and Clinics
- 5.4.2. Ambulatory Surgical Centers
- 5.4.3. Diagnostic Centers
- 5.4.4. Others
- 5.5. Market Analysis, Insights and Forecast - by Region
- 5.5.1. North America
- 5.5.2. South America
- 5.5.3. Europe
- 5.5.4. Middle East & Africa
- 5.5.5. Asia Pacific
- 5.1. Market Analysis, Insights and Forecast - by Product Type
- 6. Global Mammography Analysis, Insights and Forecast, 2021-2033
- 6.1. Market Analysis, Insights and Forecast - by Product Type
- 6.1.1. Film Screen Systems
- 6.1.2. Digital Systems
- 6.1.3. Analog Systems
- 6.1.4. 3D Systems
- 6.2. Market Analysis, Insights and Forecast - by Type
- 6.2.1. Screening Mammography
- 6.2.2. Diagnostic Mammography
- 6.3. Market Analysis, Insights and Forecast - by Application
- 6.3.1. 2D Mammography
- 6.3.2. 3D Mammography
- 6.3.3. Combined 2D and 3D Mammography
- 6.4. Market Analysis, Insights and Forecast - by End User
- 6.4.1. Hospital and Clinics
- 6.4.2. Ambulatory Surgical Centers
- 6.4.3. Diagnostic Centers
- 6.4.4. Others
- 6.1. Market Analysis, Insights and Forecast - by Product Type
- 7. North America Mammography Analysis, Insights and Forecast, 2020-2032
- 7.1. Market Analysis, Insights and Forecast - by Product Type
- 7.1.1. Film Screen Systems
- 7.1.2. Digital Systems
- 7.1.3. Analog Systems
- 7.1.4. 3D Systems
- 7.2. Market Analysis, Insights and Forecast - by Type
- 7.2.1. Screening Mammography
- 7.2.2. Diagnostic Mammography
- 7.3. Market Analysis, Insights and Forecast - by Application
- 7.3.1. 2D Mammography
- 7.3.2. 3D Mammography
- 7.3.3. Combined 2D and 3D Mammography
- 7.4. Market Analysis, Insights and Forecast - by End User
- 7.4.1. Hospital and Clinics
- 7.4.2. Ambulatory Surgical Centers
- 7.4.3. Diagnostic Centers
- 7.4.4. Others
- 7.1. Market Analysis, Insights and Forecast - by Product Type
- 8. South America Mammography Analysis, Insights and Forecast, 2020-2032
- 8.1. Market Analysis, Insights and Forecast - by Product Type
- 8.1.1. Film Screen Systems
- 8.1.2. Digital Systems
- 8.1.3. Analog Systems
- 8.1.4. 3D Systems
- 8.2. Market Analysis, Insights and Forecast - by Type
- 8.2.1. Screening Mammography
- 8.2.2. Diagnostic Mammography
- 8.3. Market Analysis, Insights and Forecast - by Application
- 8.3.1. 2D Mammography
- 8.3.2. 3D Mammography
- 8.3.3. Combined 2D and 3D Mammography
- 8.4. Market Analysis, Insights and Forecast - by End User
- 8.4.1. Hospital and Clinics
- 8.4.2. Ambulatory Surgical Centers
- 8.4.3. Diagnostic Centers
- 8.4.4. Others
- 8.1. Market Analysis, Insights and Forecast - by Product Type
- 9. Europe Mammography Analysis, Insights and Forecast, 2020-2032
- 9.1. Market Analysis, Insights and Forecast - by Product Type
- 9.1.1. Film Screen Systems
- 9.1.2. Digital Systems
- 9.1.3. Analog Systems
- 9.1.4. 3D Systems
- 9.2. Market Analysis, Insights and Forecast - by Type
- 9.2.1. Screening Mammography
- 9.2.2. Diagnostic Mammography
- 9.3. Market Analysis, Insights and Forecast - by Application
- 9.3.1. 2D Mammography
- 9.3.2. 3D Mammography
- 9.3.3. Combined 2D and 3D Mammography
- 9.4. Market Analysis, Insights and Forecast - by End User
- 9.4.1. Hospital and Clinics
- 9.4.2. Ambulatory Surgical Centers
- 9.4.3. Diagnostic Centers
- 9.4.4. Others
- 9.1. Market Analysis, Insights and Forecast - by Product Type
- 10. Middle East & Africa Mammography Analysis, Insights and Forecast, 2020-2032
- 10.1. Market Analysis, Insights and Forecast - by Product Type
- 10.1.1. Film Screen Systems
- 10.1.2. Digital Systems
- 10.1.3. Analog Systems
- 10.1.4. 3D Systems
- 10.2. Market Analysis, Insights and Forecast - by Type
- 10.2.1. Screening Mammography
- 10.2.2. Diagnostic Mammography
- 10.3. Market Analysis, Insights and Forecast - by Application
- 10.3.1. 2D Mammography
- 10.3.2. 3D Mammography
- 10.3.3. Combined 2D and 3D Mammography
- 10.4. Market Analysis, Insights and Forecast - by End User
- 10.4.1. Hospital and Clinics
- 10.4.2. Ambulatory Surgical Centers
- 10.4.3. Diagnostic Centers
- 10.4.4. Others
- 10.1. Market Analysis, Insights and Forecast - by Product Type
- 11. Asia Pacific Mammography Analysis, Insights and Forecast, 2020-2032
- 11.1. Market Analysis, Insights and Forecast - by Product Type
- 11.1.1. Film Screen Systems
- 11.1.2. Digital Systems
- 11.1.3. Analog Systems
- 11.1.4. 3D Systems
- 11.2. Market Analysis, Insights and Forecast - by Type
- 11.2.1. Screening Mammography
- 11.2.2. Diagnostic Mammography
- 11.3. Market Analysis, Insights and Forecast - by Application
- 11.3.1. 2D Mammography
- 11.3.2. 3D Mammography
- 11.3.3. Combined 2D and 3D Mammography
- 11.4. Market Analysis, Insights and Forecast - by End User
- 11.4.1. Hospital and Clinics
- 11.4.2. Ambulatory Surgical Centers
- 11.4.3. Diagnostic Centers
- 11.4.4. Others
- 11.1. Market Analysis, Insights and Forecast - by Product Type
- 12. Competitive Analysis
- 12.1. Company Profiles
- 12.1.1 GE Healthcare
- 12.1.1.1. Company Overview
- 12.1.1.2. Products
- 12.1.1.3. Company Financials
- 12.1.1.4. SWOT Analysis
- 12.1.2 Allengers
- 12.1.2.1. Company Overview
- 12.1.2.2. Products
- 12.1.2.3. Company Financials
- 12.1.2.4. SWOT Analysis
- 12.1.3 FUJIFILM Healthcare Solutions
- 12.1.3.1. Company Overview
- 12.1.3.2. Products
- 12.1.3.3. Company Financials
- 12.1.3.4. SWOT Analysis
- 12.1.4 Koninklijke Philips N.V.
- 12.1.4.1. Company Overview
- 12.1.4.2. Products
- 12.1.4.3. Company Financials
- 12.1.4.4. SWOT Analysis
- 12.1.5 Hologic Inc.
- 12.1.5.1. Company Overview
- 12.1.5.2. Products
- 12.1.5.3. Company Financials
- 12.1.5.4. SWOT Analysis
- 12.1.6 Planmed Oy
- 12.1.6.1. Company Overview
- 12.1.6.2. Products
- 12.1.6.3. Company Financials
- 12.1.6.4. SWOT Analysis
- 12.1.7 Konica Minolta Healthcare
- 12.1.7.1. Company Overview
- 12.1.7.2. Products
- 12.1.7.3. Company Financials
- 12.1.7.4. SWOT Analysis
- 12.1.8 Siemens Healthcare Private Limited
- 12.1.8.1. Company Overview
- 12.1.8.2. Products
- 12.1.8.3. Company Financials
- 12.1.8.4. SWOT Analysis
- 12.1.9 Carestream
- 12.1.9.1. Company Overview
- 12.1.9.2. Products
- 12.1.9.3. Company Financials
- 12.1.9.4. SWOT Analysis
- 12.1.10 Canon Medical
- 12.1.10.1. Company Overview
- 12.1.10.2. Products
- 12.1.10.3. Company Financials
- 12.1.10.4. SWOT Analysis
- 12.1.11 Others
- 12.1.11.1. Company Overview
- 12.1.11.2. Products
- 12.1.11.3. Company Financials
- 12.1.11.4. SWOT Analysis
- 12.1.1 GE Healthcare
- 12.2. Market Entropy
- 12.2.1 Company's Key Areas Served
- 12.2.2 Recent Developments
- 12.3. Company Market Share Analysis 2025
- 12.3.1 Top 5 Companies Market Share Analysis
- 12.3.2 Top 3 Companies Market Share Analysis
- 12.4. List of Potential Customers
- 13. Research Methodology
List of Figures
- Figure 1: Global Mammography Revenue Breakdown (million, %) by Region 2025 & 2033
- Figure 2: North America Mammography Revenue (million), by Product Type 2025 & 2033
- Figure 3: North America Mammography Revenue Share (%), by Product Type 2025 & 2033
- Figure 4: North America Mammography Revenue (million), by Type 2025 & 2033
- Figure 5: North America Mammography Revenue Share (%), by Type 2025 & 2033
- Figure 6: North America Mammography Revenue (million), by Application 2025 & 2033
- Figure 7: North America Mammography Revenue Share (%), by Application 2025 & 2033
- Figure 8: North America Mammography Revenue (million), by End User 2025 & 2033
- Figure 9: North America Mammography Revenue Share (%), by End User 2025 & 2033
- Figure 10: North America Mammography Revenue (million), by Country 2025 & 2033
- Figure 11: North America Mammography Revenue Share (%), by Country 2025 & 2033
- Figure 12: South America Mammography Revenue (million), by Product Type 2025 & 2033
- Figure 13: South America Mammography Revenue Share (%), by Product Type 2025 & 2033
- Figure 14: South America Mammography Revenue (million), by Type 2025 & 2033
- Figure 15: South America Mammography Revenue Share (%), by Type 2025 & 2033
- Figure 16: South America Mammography Revenue (million), by Application 2025 & 2033
- Figure 17: South America Mammography Revenue Share (%), by Application 2025 & 2033
- Figure 18: South America Mammography Revenue (million), by End User 2025 & 2033
- Figure 19: South America Mammography Revenue Share (%), by End User 2025 & 2033
- Figure 20: South America Mammography Revenue (million), by Country 2025 & 2033
- Figure 21: South America Mammography Revenue Share (%), by Country 2025 & 2033
- Figure 22: Europe Mammography Revenue (million), by Product Type 2025 & 2033
- Figure 23: Europe Mammography Revenue Share (%), by Product Type 2025 & 2033
- Figure 24: Europe Mammography Revenue (million), by Type 2025 & 2033
- Figure 25: Europe Mammography Revenue Share (%), by Type 2025 & 2033
- Figure 26: Europe Mammography Revenue (million), by Application 2025 & 2033
- Figure 27: Europe Mammography Revenue Share (%), by Application 2025 & 2033
- Figure 28: Europe Mammography Revenue (million), by End User 2025 & 2033
- Figure 29: Europe Mammography Revenue Share (%), by End User 2025 & 2033
- Figure 30: Europe Mammography Revenue (million), by Country 2025 & 2033
- Figure 31: Europe Mammography Revenue Share (%), by Country 2025 & 2033
- Figure 32: Middle East & Africa Mammography Revenue (million), by Product Type 2025 & 2033
- Figure 33: Middle East & Africa Mammography Revenue Share (%), by Product Type 2025 & 2033
- Figure 34: Middle East & Africa Mammography Revenue (million), by Type 2025 & 2033
- Figure 35: Middle East & Africa Mammography Revenue Share (%), by Type 2025 & 2033
- Figure 36: Middle East & Africa Mammography Revenue (million), by Application 2025 & 2033
- Figure 37: Middle East & Africa Mammography Revenue Share (%), by Application 2025 & 2033
- Figure 38: Middle East & Africa Mammography Revenue (million), by End User 2025 & 2033
- Figure 39: Middle East & Africa Mammography Revenue Share (%), by End User 2025 & 2033
- Figure 40: Middle East & Africa Mammography Revenue (million), by Country 2025 & 2033
- Figure 41: Middle East & Africa Mammography Revenue Share (%), by Country 2025 & 2033
- Figure 42: Asia Pacific Mammography Revenue (million), by Product Type 2025 & 2033
- Figure 43: Asia Pacific Mammography Revenue Share (%), by Product Type 2025 & 2033
- Figure 44: Asia Pacific Mammography Revenue (million), by Type 2025 & 2033
- Figure 45: Asia Pacific Mammography Revenue Share (%), by Type 2025 & 2033
- Figure 46: Asia Pacific Mammography Revenue (million), by Application 2025 & 2033
- Figure 47: Asia Pacific Mammography Revenue Share (%), by Application 2025 & 2033
- Figure 48: Asia Pacific Mammography Revenue (million), by End User 2025 & 2033
- Figure 49: Asia Pacific Mammography Revenue Share (%), by End User 2025 & 2033
- Figure 50: Asia Pacific Mammography Revenue (million), by Country 2025 & 2033
- Figure 51: Asia Pacific Mammography Revenue Share (%), by Country 2025 & 2033
List of Tables
- Table 1: Global Mammography Revenue million Forecast, by Product Type 2020 & 2033
- Table 2: Global Mammography Revenue million Forecast, by Type 2020 & 2033
- Table 3: Global Mammography Revenue million Forecast, by Application 2020 & 2033
- Table 4: Global Mammography Revenue million Forecast, by End User 2020 & 2033
- Table 5: Global Mammography Revenue million Forecast, by Region 2020 & 2033
- Table 6: Global Mammography Revenue million Forecast, by Product Type 2020 & 2033
- Table 7: Global Mammography Revenue million Forecast, by Type 2020 & 2033
- Table 8: Global Mammography Revenue million Forecast, by Application 2020 & 2033
- Table 9: Global Mammography Revenue million Forecast, by End User 2020 & 2033
- Table 10: Global Mammography Revenue million Forecast, by Country 2020 & 2033
- Table 11: United States Mammography Revenue (million) Forecast, by Application 2020 & 2033
- Table 12: Canada Mammography Revenue (million) Forecast, by Application 2020 & 2033
- Table 13: Mexico Mammography Revenue (million) Forecast, by Application 2020 & 2033
- Table 14: Global Mammography Revenue million Forecast, by Product Type 2020 & 2033
- Table 15: Global Mammography Revenue million Forecast, by Type 2020 & 2033
- Table 16: Global Mammography Revenue million Forecast, by Application 2020 & 2033
- Table 17: Global Mammography Revenue million Forecast, by End User 2020 & 2033
- Table 18: Global Mammography Revenue million Forecast, by Country 2020 & 2033
- Table 19: Brazil Mammography Revenue (million) Forecast, by Application 2020 & 2033
- Table 20: Argentina Mammography Revenue (million) Forecast, by Application 2020 & 2033
- Table 21: Rest of South America Mammography Revenue (million) Forecast, by Application 2020 & 2033
- Table 22: Global Mammography Revenue million Forecast, by Product Type 2020 & 2033
- Table 23: Global Mammography Revenue million Forecast, by Type 2020 & 2033
- Table 24: Global Mammography Revenue million Forecast, by Application 2020 & 2033
- Table 25: Global Mammography Revenue million Forecast, by End User 2020 & 2033
- Table 26: Global Mammography Revenue million Forecast, by Country 2020 & 2033
- Table 27: United Kingdom Mammography Revenue (million) Forecast, by Application 2020 & 2033
- Table 28: Germany Mammography Revenue (million) Forecast, by Application 2020 & 2033
- Table 29: France Mammography Revenue (million) Forecast, by Application 2020 & 2033
- Table 30: Italy Mammography Revenue (million) Forecast, by Application 2020 & 2033
- Table 31: Spain Mammography Revenue (million) Forecast, by Application 2020 & 2033
- Table 32: Russia Mammography Revenue (million) Forecast, by Application 2020 & 2033
- Table 33: Benelux Mammography Revenue (million) Forecast, by Application 2020 & 2033
- Table 34: Nordics Mammography Revenue (million) Forecast, by Application 2020 & 2033
- Table 35: Rest of Europe Mammography Revenue (million) Forecast, by Application 2020 & 2033
- Table 36: Global Mammography Revenue million Forecast, by Product Type 2020 & 2033
- Table 37: Global Mammography Revenue million Forecast, by Type 2020 & 2033
- Table 38: Global Mammography Revenue million Forecast, by Application 2020 & 2033
- Table 39: Global Mammography Revenue million Forecast, by End User 2020 & 2033
- Table 40: Global Mammography Revenue million Forecast, by Country 2020 & 2033
- Table 41: Turkey Mammography Revenue (million) Forecast, by Application 2020 & 2033
- Table 42: Israel Mammography Revenue (million) Forecast, by Application 2020 & 2033
- Table 43: GCC Mammography Revenue (million) Forecast, by Application 2020 & 2033
- Table 44: North Africa Mammography Revenue (million) Forecast, by Application 2020 & 2033
- Table 45: South Africa Mammography Revenue (million) Forecast, by Application 2020 & 2033
- Table 46: Rest of Middle East & Africa Mammography Revenue (million) Forecast, by Application 2020 & 2033
- Table 47: Global Mammography Revenue million Forecast, by Product Type 2020 & 2033
- Table 48: Global Mammography Revenue million Forecast, by Type 2020 & 2033
- Table 49: Global Mammography Revenue million Forecast, by Application 2020 & 2033
- Table 50: Global Mammography Revenue million Forecast, by End User 2020 & 2033
- Table 51: Global Mammography Revenue million Forecast, by Country 2020 & 2033
- Table 52: China Mammography Revenue (million) Forecast, by Application 2020 & 2033
- Table 53: India Mammography Revenue (million) Forecast, by Application 2020 & 2033
- Table 54: Japan Mammography Revenue (million) Forecast, by Application 2020 & 2033
- Table 55: South Korea Mammography Revenue (million) Forecast, by Application 2020 & 2033
- Table 56: ASEAN Mammography Revenue (million) Forecast, by Application 2020 & 2033
- Table 57: Oceania Mammography Revenue (million) Forecast, by Application 2020 & 2033
- Table 58: Rest of Asia Pacific Mammography Revenue (million) Forecast, by Application 2020 & 2033
Frequently Asked Questions
1. What is the projected Compound Annual Growth Rate (CAGR) of the Mammography?
The projected CAGR is approximately 9.7%.
2. Which companies are prominent players in the Mammography?
Key companies in the market include GE Healthcare, Allengers, FUJIFILM Healthcare Solutions, Koninklijke Philips N.V., Hologic, Inc., Planmed Oy, Konica Minolta Healthcare, Siemens Healthcare Private Limited, Carestream, Canon Medical, Others.
3. What are the main segments of the Mammography?
The market segments include Product Type, Type, Application, End User.
4. Can you provide details about the market size?
The market size is estimated to be USD 2742.5 million as of 2022.
5. What are some drivers contributing to market growth?
N/A
6. What are the notable trends driving market growth?
N/A
7. Are there any restraints impacting market growth?
N/A
8. Can you provide examples of recent developments in the market?
N/A
9. What pricing options are available for accessing the report?
Pricing options include single-user, multi-user, and enterprise licenses priced at USD 3350.00, USD 5025.00, and USD 6700.00 respectively.
10. Is the market size provided in terms of value or volume?
The market size is provided in terms of value, measured in million.
11. Are there any specific market keywords associated with the report?
Yes, the market keyword associated with the report is "Mammography," which aids in identifying and referencing the specific market segment covered.
12. How do I determine which pricing option suits my needs best?
The pricing options vary based on user requirements and access needs. Individual users may opt for single-user licenses, while businesses requiring broader access may choose multi-user or enterprise licenses for cost-effective access to the report.
13. Are there any additional resources or data provided in the Mammography report?
While the report offers comprehensive insights, it's advisable to review the specific contents or supplementary materials provided to ascertain if additional resources or data are available.
14. How can I stay updated on further developments or reports in the Mammography?
To stay informed about further developments, trends, and reports in the Mammography, consider subscribing to industry newsletters, following relevant companies and organizations, or regularly checking reputable industry news sources and publications.
Methodology
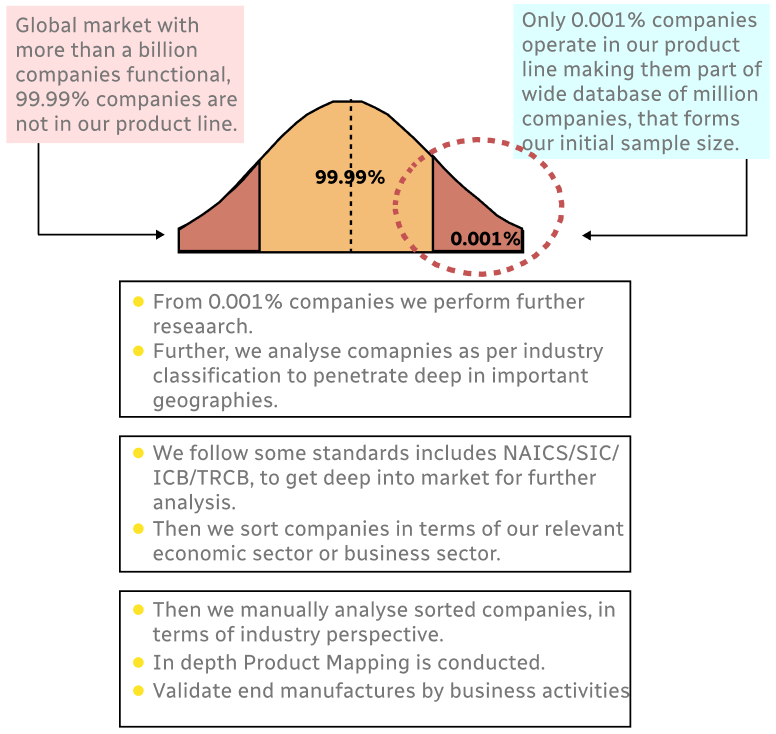
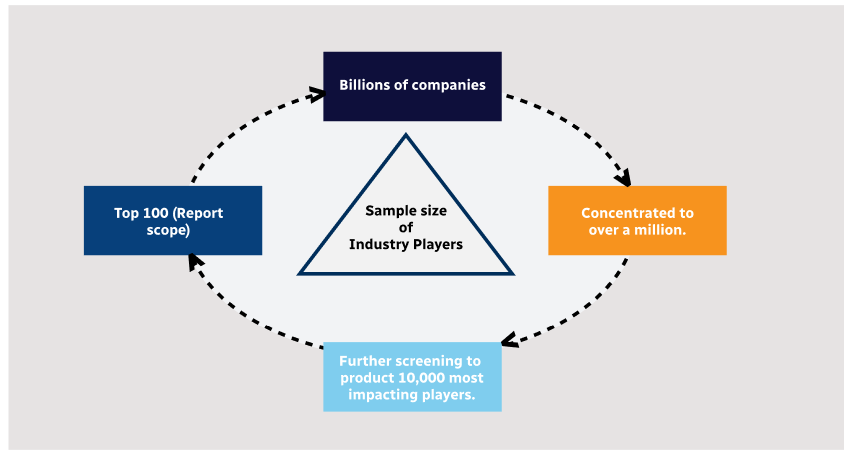
Step 1 - Identification of Relevant Samples Size from Population Database
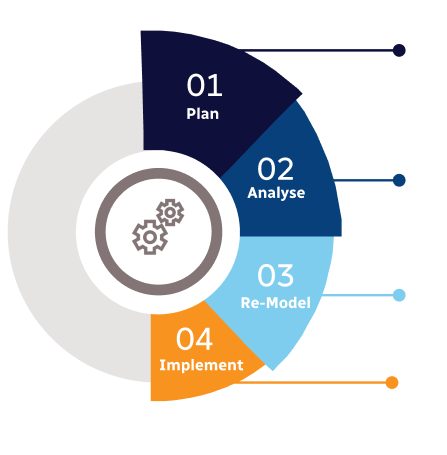
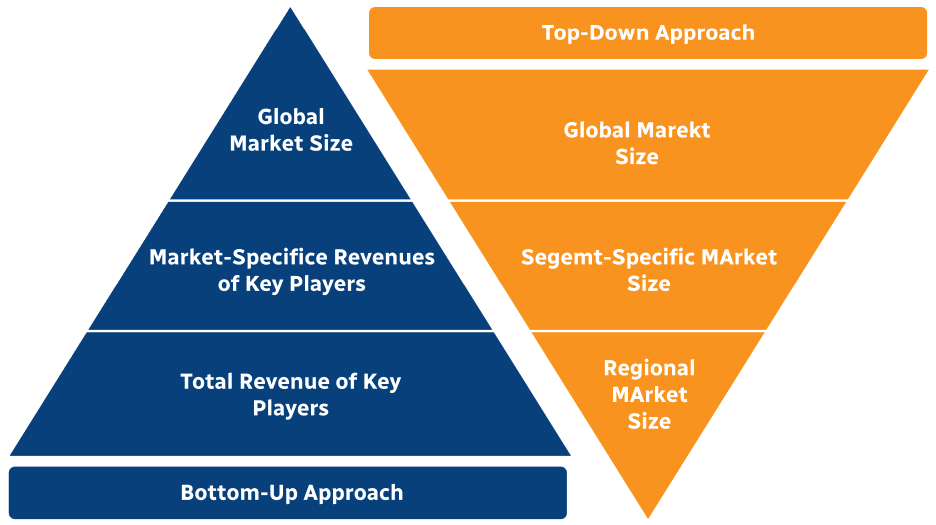
Step 2 - Approaches for Defining Global Market Size (Value, Volume* & Price*)
Note*: In applicable scenarios
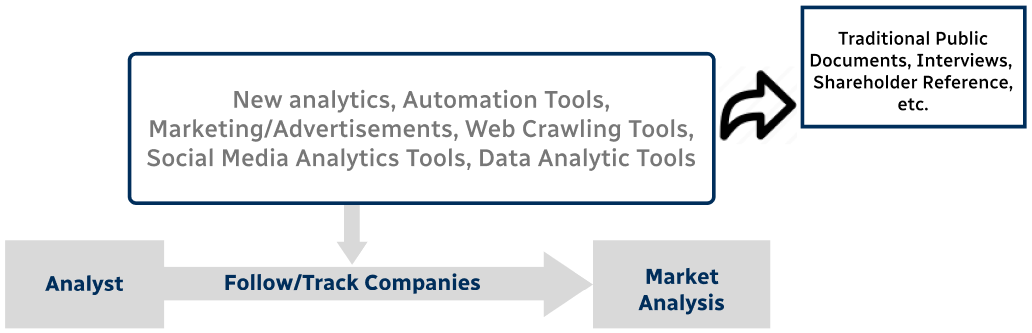
Step 3 - Data Sources
Primary Research
- Web Analytics
- Survey Reports
- Research Institute
- Latest Research Reports
- Opinion Leaders
Secondary Research
- Annual Reports
- White Paper
- Latest Press Release
- Industry Association
- Paid Database
- Investor Presentations
Step 4 - Data Triangulation
Involves using different sources of information in order to increase the validity of a study
These sources are likely to be stakeholders in a program - participants, other researchers, program staff, other community members, and so on.
Then we put all data in single framework & apply various statistical tools to find out the dynamic on the market.
During the analysis stage, feedback from the stakeholder groups would be compared to determine areas of agreement as well as areas of divergence