
Key Insights
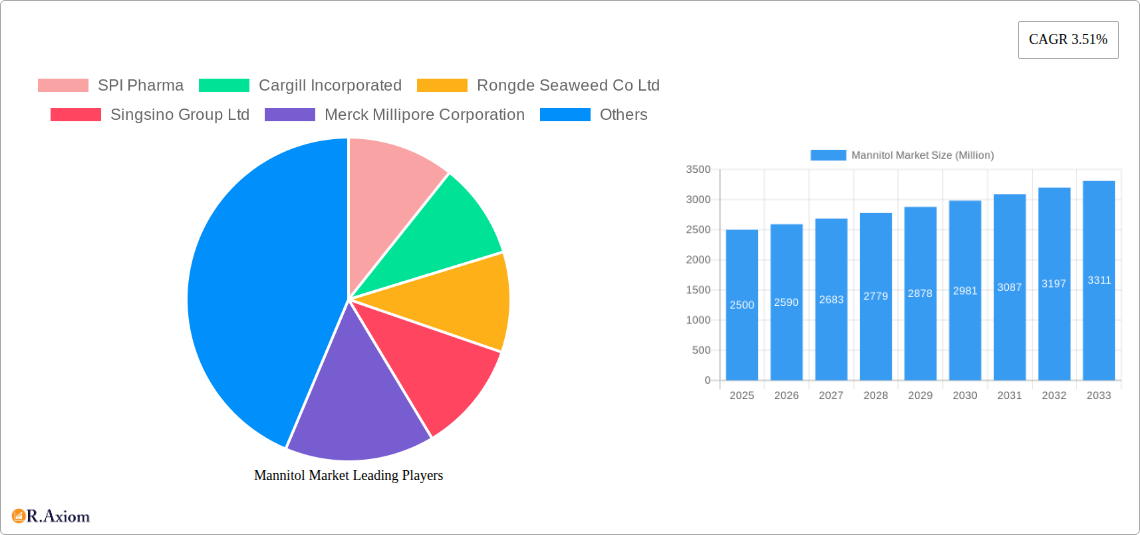
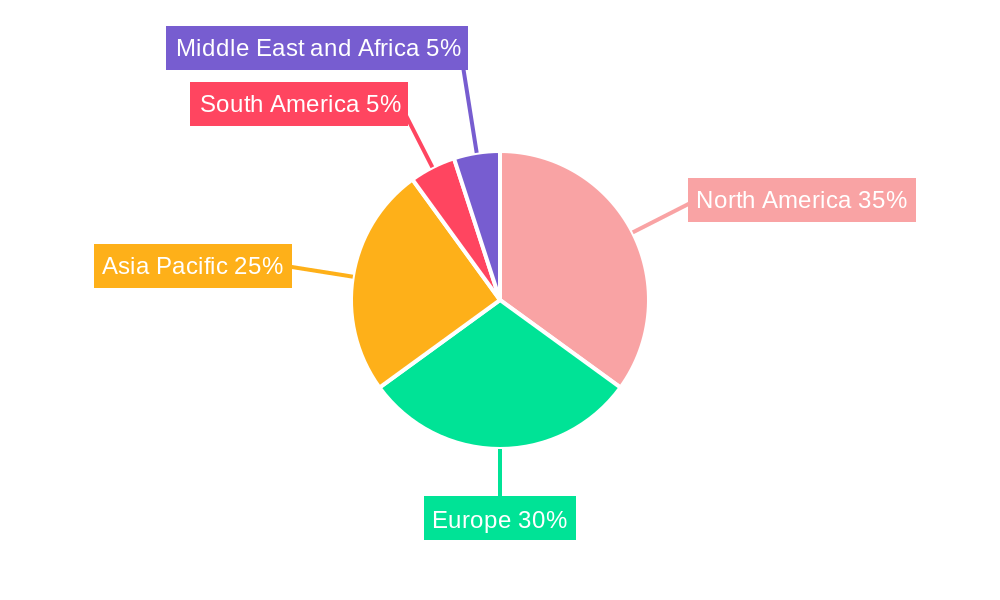
The mannitol market, valued at approximately $XX million in 2025, is projected to experience steady growth, exhibiting a compound annual growth rate (CAGR) of 3.51% from 2025 to 2033. This growth is driven by the increasing demand for mannitol in pharmaceutical applications, particularly as a pharmaceutical excipient in tablets and injections, and its rising use as a food additive and sweetener in the food and beverage industry. The expanding pharmaceutical sector globally, coupled with the growing preference for healthier food options containing natural sweeteners, are significant market drivers. Powdered mannitol currently dominates the market by form, reflecting its versatility and ease of use in various applications. The food and pharmaceutical sectors represent the largest application segments, though the industrial segment is also poised for growth due to mannitol's use in specific manufacturing processes. However, price fluctuations in raw materials and potential competition from alternative sweeteners represent key restraints to market expansion. Geographic analysis reveals a strong presence in North America and Europe, driven by established pharmaceutical and food industries in these regions. Asia-Pacific is anticipated to witness significant growth in the coming years, fueled by rising healthcare expenditure and increasing consumer awareness regarding health and nutrition in developing economies like India and China.
The competitive landscape includes both large multinational corporations like Cargill Incorporated and Roquette Freres, and smaller, specialized manufacturers focusing on specific regional markets. Significant opportunities lie in developing innovative mannitol-based products tailored to specific applications, alongside focusing on sustainable and cost-effective production methods. Market players are also likely to explore strategic partnerships and acquisitions to broaden their product portfolio and reach wider customer bases. Further growth will be driven by advancements in mannitol production technology, focusing on efficiency and sustainability. The market is expected to continue its steady growth trajectory, driven by these key factors, presenting attractive opportunities for investors and industry participants alike.
Mannitol Market: A Comprehensive Report (2019-2033)
This in-depth report provides a comprehensive analysis of the global Mannitol market, offering invaluable insights for stakeholders across the value chain. Spanning the period from 2019 to 2033, with a focus on 2025, this report meticulously examines market dynamics, competitive landscapes, and future growth potential. It leverages extensive research and data analysis to deliver actionable intelligence, empowering informed decision-making.
Mannitol Market Concentration & Innovation
The Mannitol market exhibits a moderately concentrated structure, with a handful of key players holding significant market share. While precise market share figures for individual companies are proprietary and require deeper market research, preliminary estimates suggest that SPI Pharma, Cargill Incorporated, and Roquette Freres Company are among the leading players, together controlling an estimated xx% of the global market in 2025. Innovation within the sector is driven by the continuous demand for higher purity products, enhanced functionalities, and cost-effective manufacturing processes. Regulatory frameworks, particularly concerning food safety and pharmaceutical standards, significantly influence market dynamics. Product substitutes, like other sugar alcohols, pose a competitive challenge, although Mannitol's unique properties maintain its dominance in specific applications. End-user trends toward healthier food choices and increased demand for pharmaceutical-grade Mannitol are major growth drivers. Mergers and acquisitions (M&A) activity in the industry has been moderate in recent years, with deal values averaging around xx Million annually during 2019-2024. Future M&A activity is anticipated to increase due to the consolidation of the market and the continuous quest for improved efficiency, product diversification, and market penetration.
- Market Concentration: Moderately concentrated, with top three players holding xx% market share (estimated).
- Innovation Drivers: Higher purity, enhanced functionalities, cost-effective manufacturing.
- Regulatory Influence: Stringent food safety and pharmaceutical standards.
- M&A Activity: Moderate, with average deal values of xx Million annually (2019-2024).
- Substitutes: Other sugar alcohols, posing a moderate competitive challenge.
Mannitol Market Industry Trends & Insights
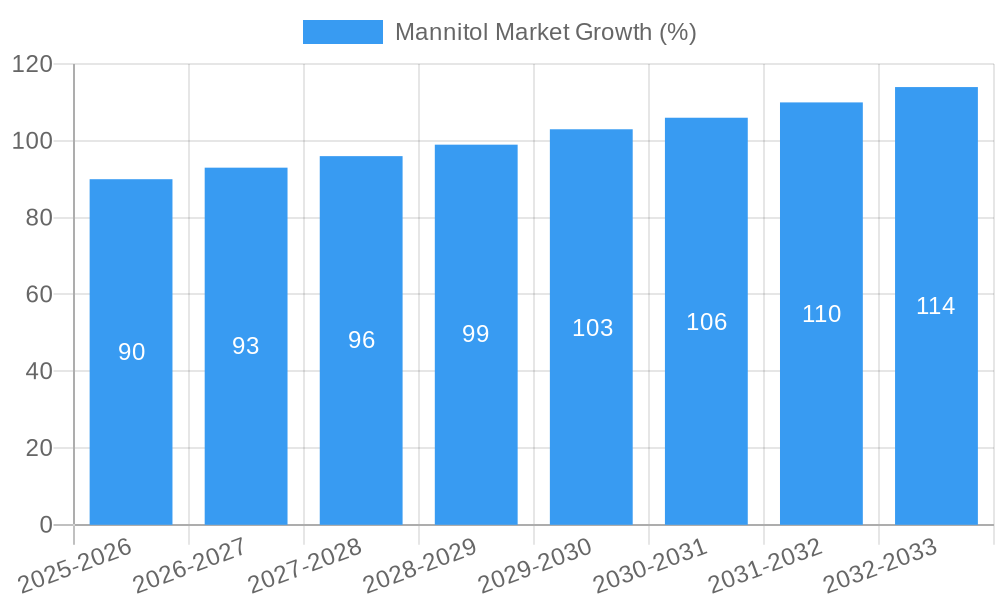
The Mannitol market is projected to witness a CAGR of xx% during the forecast period (2025-2033), fueled by robust growth across various application segments. Technological advancements in manufacturing processes are improving efficiency and product quality, contributing to market expansion. Consumer preferences towards healthier food and beverage options are driving demand in the food industry segment, while the pharmaceutical sector’s consistent reliance on Mannitol as an excipient sustains market growth. Competitive dynamics are characterized by both collaboration and competition, with companies focusing on product differentiation, capacity expansion, and strategic partnerships to enhance market presence. Market penetration rates vary significantly across different regions and applications. The pharmaceutical segment currently exhibits the highest penetration rate, expected to maintain its dominance throughout the forecast period. However, rising awareness of the benefits of Mannitol in food products suggests a considerable potential for increased market penetration in this segment.
Dominant Markets & Segments in Mannitol Market
The pharmaceutical segment dominates the Mannitol market by application, accounting for an estimated xx% of the market in 2025. This is primarily driven by its crucial role as an excipient in various pharmaceutical formulations. Geographically, the Asia-Pacific region is expected to be the fastest-growing market, driven by factors such as rising population, increasing healthcare expenditure, and rapid industrialization.
- Dominant Segment (Application): Pharmaceuticals (xx% of market share in 2025)
- Key Drivers for Pharmaceutical Dominance: Essential role as a pharmaceutical excipient.
- Dominant Region: Asia-Pacific (projected fastest growth rate)
- Key Drivers for Asia-Pacific Growth: Rising population, increasing healthcare expenditure, rapid industrialization.
- Dominant Form: Powder (estimated xx% market share in 2025) due to its versatility and ease of use in various applications.
- Granules segment: Growing steadily, driven by increasing demand for convenient, pre-measured forms in pharmaceutical applications.
Mannitol Market Product Developments
Recent product innovations in the Mannitol market focus primarily on enhancing purity levels and developing specialized formulations for specific applications. This includes the development of high-purity Mannitol for use in parenteral drugs and specialized granules for improved flowability and ease of use in pharmaceutical applications. These advancements enhance the product's efficacy and market fit, driving competitiveness within the sector.
Report Scope & Segmentation Analysis
This report segments the Mannitol market by form (Powder, Granules) and application (Food, Pharmaceuticals, Industrial, Others). The Powder segment currently holds a larger market share due to its widespread applications across various industries. The Granules segment is experiencing significant growth driven by its convenience and efficiency in processing and formulation. The Pharmaceutical application segment is the dominant end-use market, showing high growth potential due to its indispensable role in drug delivery. The Food and Industrial segments offer substantial growth opportunities due to the increasing demand for Mannitol as a sweetener and functional excipient. Each segment's market size, growth projection, and competitive dynamics are detailed within the full report.
Key Drivers of Mannitol Market Growth
The Mannitol market's growth is propelled by several key factors. Firstly, its widespread use in the pharmaceutical industry as an excipient in various drug formulations fuels considerable demand. Secondly, its growing popularity as a sugar substitute in food and beverage products is further enhancing market growth. Technological advancements in production processes leading to higher purity levels and cost efficiencies are also contributing factors. Finally, supportive government regulations in certain regions encourage market expansion.
Challenges in the Mannitol Market Sector
The Mannitol market faces several challenges. Fluctuations in raw material prices, coupled with potential supply chain disruptions, can impact production costs and profitability. Intense competition among established players and the emergence of new players creates price pressure. Moreover, stringent regulatory requirements in certain regions, particularly for pharmaceutical-grade Mannitol, necessitate significant investments in compliance.
Emerging Opportunities in Mannitol Market
Emerging opportunities exist in the Mannitol market, primarily in expanding its applications into new sectors, such as nutraceuticals and cosmetics. Technological innovations, such as the development of novel delivery systems utilizing Mannitol, present significant growth potential. Furthermore, exploring new markets in developing countries with a burgeoning healthcare sector offers untapped avenues for expansion.
Leading Players in the Mannitol Market Market
- SPI Pharma
- Cargill Incorporated
- Rongde Seaweed Co Ltd
- Singsino Group Ltd
- Merck Millipore Corporation
- Roquette Freres Company
- Bright Moon Seaweed
- Ingredion Incorporated
- Shijiazhuang Huaxu Pharmaceutical Co Ltd
Key Developments in Mannitol Market Industry
- 2022 Q4: Roquette Freres announced expansion of its Mannitol production capacity.
- 2023 Q1: SPI Pharma launched a new high-purity Mannitol product for parenteral applications.
- 2024 Q2: A significant M&A deal involving two major Mannitol producers reshaped market dynamics. (Details provided in the full report).
Strategic Outlook for Mannitol Market Market
The Mannitol market is poised for robust growth in the coming years, driven by its diverse applications, technological advancements, and expanding global demand. Strategic investments in R&D, capacity expansion, and strategic partnerships will be crucial for companies to capitalize on the market's considerable potential. Focus on sustainable and cost-effective production processes will also be key to maintaining competitiveness and profitability.
Mannitol Market Segmentation
-
1. Form
- 1.1. Powder
- 1.2. Granules
-
2. Application
- 2.1. Food
- 2.2. Pharmaceuticals
- 2.3. Industrial
- 2.4. Others
Mannitol Market Segmentation By Geography
-
1. North America
- 1.1. United States
- 1.2. Canada
- 1.3. Mexico
- 1.4. Rest of North America
-
2. Europe
- 2.1. Spain
- 2.2. United Kingdom
- 2.3. Germany
- 2.4. France
- 2.5. Italy
- 2.6. Russia
- 2.7. Rest of Europe
-
3. Asia Pacific
- 3.1. China
- 3.2. Japan
- 3.3. India
- 3.4. Australia
- 3.5. Rest of Asia Pacific
-
4. South America
- 4.1. Brazil
- 4.2. Argentina
- 4.3. Rest of South America
-
5. Middle East and Africa
- 5.1. South Africa
- 5.2. Saudi Arabia
- 5.3. Rest of Middle East and Africa
Mannitol Market REPORT HIGHLIGHTS
| Aspects | Details |
|---|---|
| Study Period | 2019-2033 |
| Base Year | 2024 |
| Estimated Year | 2025 |
| Forecast Period | 2025-2033 |
| Historical Period | 2019-2024 |
| Growth Rate | CAGR of 3.51% from 2019-2033 |
| Segmentation |
|
Table of Contents
- 1. Introduction
- 1.1. Research Scope
- 1.2. Market Segmentation
- 1.3. Research Methodology
- 1.4. Definitions and Assumptions
- 2. Executive Summary
- 2.1. Introduction
- 3. Market Dynamics
- 3.1. Introduction
- 3.2. Market Drivers
- 3.2.1. Inclination Toward Low-Sugar/Sugar-free Beverages
- 3.3. Market Restrains
- 3.3.1. Concerns Over Health Issues Associated with Functional Beverages
- 3.4. Market Trends
- 3.4.1. Mannitol Market is Gaining Popularity in the Bakery and confectionery Industry
- 4. Market Factor Analysis
- 4.1. Porters Five Forces
- 4.2. Supply/Value Chain
- 4.3. PESTEL analysis
- 4.4. Market Entropy
- 4.5. Patent/Trademark Analysis
- 5. Global Mannitol Market Analysis, Insights and Forecast, 2019-2031
- 5.1. Market Analysis, Insights and Forecast - by Form
- 5.1.1. Powder
- 5.1.2. Granules
- 5.2. Market Analysis, Insights and Forecast - by Application
- 5.2.1. Food
- 5.2.2. Pharmaceuticals
- 5.2.3. Industrial
- 5.2.4. Others
- 5.3. Market Analysis, Insights and Forecast - by Region
- 5.3.1. North America
- 5.3.2. Europe
- 5.3.3. Asia Pacific
- 5.3.4. South America
- 5.3.5. Middle East and Africa
- 5.1. Market Analysis, Insights and Forecast - by Form
- 6. North America Mannitol Market Analysis, Insights and Forecast, 2019-2031
- 6.1. Market Analysis, Insights and Forecast - by Form
- 6.1.1. Powder
- 6.1.2. Granules
- 6.2. Market Analysis, Insights and Forecast - by Application
- 6.2.1. Food
- 6.2.2. Pharmaceuticals
- 6.2.3. Industrial
- 6.2.4. Others
- 6.1. Market Analysis, Insights and Forecast - by Form
- 7. Europe Mannitol Market Analysis, Insights and Forecast, 2019-2031
- 7.1. Market Analysis, Insights and Forecast - by Form
- 7.1.1. Powder
- 7.1.2. Granules
- 7.2. Market Analysis, Insights and Forecast - by Application
- 7.2.1. Food
- 7.2.2. Pharmaceuticals
- 7.2.3. Industrial
- 7.2.4. Others
- 7.1. Market Analysis, Insights and Forecast - by Form
- 8. Asia Pacific Mannitol Market Analysis, Insights and Forecast, 2019-2031
- 8.1. Market Analysis, Insights and Forecast - by Form
- 8.1.1. Powder
- 8.1.2. Granules
- 8.2. Market Analysis, Insights and Forecast - by Application
- 8.2.1. Food
- 8.2.2. Pharmaceuticals
- 8.2.3. Industrial
- 8.2.4. Others
- 8.1. Market Analysis, Insights and Forecast - by Form
- 9. South America Mannitol Market Analysis, Insights and Forecast, 2019-2031
- 9.1. Market Analysis, Insights and Forecast - by Form
- 9.1.1. Powder
- 9.1.2. Granules
- 9.2. Market Analysis, Insights and Forecast - by Application
- 9.2.1. Food
- 9.2.2. Pharmaceuticals
- 9.2.3. Industrial
- 9.2.4. Others
- 9.1. Market Analysis, Insights and Forecast - by Form
- 10. Middle East and Africa Mannitol Market Analysis, Insights and Forecast, 2019-2031
- 10.1. Market Analysis, Insights and Forecast - by Form
- 10.1.1. Powder
- 10.1.2. Granules
- 10.2. Market Analysis, Insights and Forecast - by Application
- 10.2.1. Food
- 10.2.2. Pharmaceuticals
- 10.2.3. Industrial
- 10.2.4. Others
- 10.1. Market Analysis, Insights and Forecast - by Form
- 11. North America Mannitol Market Analysis, Insights and Forecast, 2019-2031
- 11.1. Market Analysis, Insights and Forecast - By Country/Sub-region
- 11.1.1 United States
- 11.1.2 Canada
- 11.1.3 Mexico
- 11.1.4 Rest of North America
- 12. Europe Mannitol Market Analysis, Insights and Forecast, 2019-2031
- 12.1. Market Analysis, Insights and Forecast - By Country/Sub-region
- 12.1.1 Spain
- 12.1.2 United Kingdom
- 12.1.3 Germany
- 12.1.4 France
- 12.1.5 Italy
- 12.1.6 Russia
- 12.1.7 Rest of Europe
- 13. Asia Pacific Mannitol Market Analysis, Insights and Forecast, 2019-2031
- 13.1. Market Analysis, Insights and Forecast - By Country/Sub-region
- 13.1.1 China
- 13.1.2 Japan
- 13.1.3 India
- 13.1.4 Australia
- 13.1.5 Rest of Asia Pacific
- 14. South America Mannitol Market Analysis, Insights and Forecast, 2019-2031
- 14.1. Market Analysis, Insights and Forecast - By Country/Sub-region
- 14.1.1 Brazil
- 14.1.2 Argentina
- 14.1.3 Rest of South America
- 15. Middle East and Africa Mannitol Market Analysis, Insights and Forecast, 2019-2031
- 15.1. Market Analysis, Insights and Forecast - By Country/Sub-region
- 15.1.1 South Africa
- 15.1.2 Saudi Arabia
- 15.1.3 Rest of Middle East and Africa
- 16. Competitive Analysis
- 16.1. Global Market Share Analysis 2024
- 16.2. Company Profiles
- 16.2.1 SPI Pharma
- 16.2.1.1. Overview
- 16.2.1.2. Products
- 16.2.1.3. SWOT Analysis
- 16.2.1.4. Recent Developments
- 16.2.1.5. Financials (Based on Availability)
- 16.2.2 Cargill Incorporated
- 16.2.2.1. Overview
- 16.2.2.2. Products
- 16.2.2.3. SWOT Analysis
- 16.2.2.4. Recent Developments
- 16.2.2.5. Financials (Based on Availability)
- 16.2.3 Rongde Seaweed Co Ltd
- 16.2.3.1. Overview
- 16.2.3.2. Products
- 16.2.3.3. SWOT Analysis
- 16.2.3.4. Recent Developments
- 16.2.3.5. Financials (Based on Availability)
- 16.2.4 Singsino Group Ltd
- 16.2.4.1. Overview
- 16.2.4.2. Products
- 16.2.4.3. SWOT Analysis
- 16.2.4.4. Recent Developments
- 16.2.4.5. Financials (Based on Availability)
- 16.2.5 Merck Millipore Corporation
- 16.2.5.1. Overview
- 16.2.5.2. Products
- 16.2.5.3. SWOT Analysis
- 16.2.5.4. Recent Developments
- 16.2.5.5. Financials (Based on Availability)
- 16.2.6 Roquette Freres Company
- 16.2.6.1. Overview
- 16.2.6.2. Products
- 16.2.6.3. SWOT Analysis
- 16.2.6.4. Recent Developments
- 16.2.6.5. Financials (Based on Availability)
- 16.2.7 Bright Moon Seaweed*List Not Exhaustive
- 16.2.7.1. Overview
- 16.2.7.2. Products
- 16.2.7.3. SWOT Analysis
- 16.2.7.4. Recent Developments
- 16.2.7.5. Financials (Based on Availability)
- 16.2.8 Ingredion Incorporated
- 16.2.8.1. Overview
- 16.2.8.2. Products
- 16.2.8.3. SWOT Analysis
- 16.2.8.4. Recent Developments
- 16.2.8.5. Financials (Based on Availability)
- 16.2.9 Shijiazhuang Huaxu Pharmaceutical Co Ltd
- 16.2.9.1. Overview
- 16.2.9.2. Products
- 16.2.9.3. SWOT Analysis
- 16.2.9.4. Recent Developments
- 16.2.9.5. Financials (Based on Availability)
- 16.2.1 SPI Pharma
List of Figures
- Figure 1: Global Mannitol Market Revenue Breakdown (Million, %) by Region 2024 & 2032
- Figure 2: North America Mannitol Market Revenue (Million), by Country 2024 & 2032
- Figure 3: North America Mannitol Market Revenue Share (%), by Country 2024 & 2032
- Figure 4: Europe Mannitol Market Revenue (Million), by Country 2024 & 2032
- Figure 5: Europe Mannitol Market Revenue Share (%), by Country 2024 & 2032
- Figure 6: Asia Pacific Mannitol Market Revenue (Million), by Country 2024 & 2032
- Figure 7: Asia Pacific Mannitol Market Revenue Share (%), by Country 2024 & 2032
- Figure 8: South America Mannitol Market Revenue (Million), by Country 2024 & 2032
- Figure 9: South America Mannitol Market Revenue Share (%), by Country 2024 & 2032
- Figure 10: Middle East and Africa Mannitol Market Revenue (Million), by Country 2024 & 2032
- Figure 11: Middle East and Africa Mannitol Market Revenue Share (%), by Country 2024 & 2032
- Figure 12: North America Mannitol Market Revenue (Million), by Form 2024 & 2032
- Figure 13: North America Mannitol Market Revenue Share (%), by Form 2024 & 2032
- Figure 14: North America Mannitol Market Revenue (Million), by Application 2024 & 2032
- Figure 15: North America Mannitol Market Revenue Share (%), by Application 2024 & 2032
- Figure 16: North America Mannitol Market Revenue (Million), by Country 2024 & 2032
- Figure 17: North America Mannitol Market Revenue Share (%), by Country 2024 & 2032
- Figure 18: Europe Mannitol Market Revenue (Million), by Form 2024 & 2032
- Figure 19: Europe Mannitol Market Revenue Share (%), by Form 2024 & 2032
- Figure 20: Europe Mannitol Market Revenue (Million), by Application 2024 & 2032
- Figure 21: Europe Mannitol Market Revenue Share (%), by Application 2024 & 2032
- Figure 22: Europe Mannitol Market Revenue (Million), by Country 2024 & 2032
- Figure 23: Europe Mannitol Market Revenue Share (%), by Country 2024 & 2032
- Figure 24: Asia Pacific Mannitol Market Revenue (Million), by Form 2024 & 2032
- Figure 25: Asia Pacific Mannitol Market Revenue Share (%), by Form 2024 & 2032
- Figure 26: Asia Pacific Mannitol Market Revenue (Million), by Application 2024 & 2032
- Figure 27: Asia Pacific Mannitol Market Revenue Share (%), by Application 2024 & 2032
- Figure 28: Asia Pacific Mannitol Market Revenue (Million), by Country 2024 & 2032
- Figure 29: Asia Pacific Mannitol Market Revenue Share (%), by Country 2024 & 2032
- Figure 30: South America Mannitol Market Revenue (Million), by Form 2024 & 2032
- Figure 31: South America Mannitol Market Revenue Share (%), by Form 2024 & 2032
- Figure 32: South America Mannitol Market Revenue (Million), by Application 2024 & 2032
- Figure 33: South America Mannitol Market Revenue Share (%), by Application 2024 & 2032
- Figure 34: South America Mannitol Market Revenue (Million), by Country 2024 & 2032
- Figure 35: South America Mannitol Market Revenue Share (%), by Country 2024 & 2032
- Figure 36: Middle East and Africa Mannitol Market Revenue (Million), by Form 2024 & 2032
- Figure 37: Middle East and Africa Mannitol Market Revenue Share (%), by Form 2024 & 2032
- Figure 38: Middle East and Africa Mannitol Market Revenue (Million), by Application 2024 & 2032
- Figure 39: Middle East and Africa Mannitol Market Revenue Share (%), by Application 2024 & 2032
- Figure 40: Middle East and Africa Mannitol Market Revenue (Million), by Country 2024 & 2032
- Figure 41: Middle East and Africa Mannitol Market Revenue Share (%), by Country 2024 & 2032
List of Tables
- Table 1: Global Mannitol Market Revenue Million Forecast, by Region 2019 & 2032
- Table 2: Global Mannitol Market Revenue Million Forecast, by Form 2019 & 2032
- Table 3: Global Mannitol Market Revenue Million Forecast, by Application 2019 & 2032
- Table 4: Global Mannitol Market Revenue Million Forecast, by Region 2019 & 2032
- Table 5: Global Mannitol Market Revenue Million Forecast, by Country 2019 & 2032
- Table 6: United States Mannitol Market Revenue (Million) Forecast, by Application 2019 & 2032
- Table 7: Canada Mannitol Market Revenue (Million) Forecast, by Application 2019 & 2032
- Table 8: Mexico Mannitol Market Revenue (Million) Forecast, by Application 2019 & 2032
- Table 9: Rest of North America Mannitol Market Revenue (Million) Forecast, by Application 2019 & 2032
- Table 10: Global Mannitol Market Revenue Million Forecast, by Country 2019 & 2032
- Table 11: Spain Mannitol Market Revenue (Million) Forecast, by Application 2019 & 2032
- Table 12: United Kingdom Mannitol Market Revenue (Million) Forecast, by Application 2019 & 2032
- Table 13: Germany Mannitol Market Revenue (Million) Forecast, by Application 2019 & 2032
- Table 14: France Mannitol Market Revenue (Million) Forecast, by Application 2019 & 2032
- Table 15: Italy Mannitol Market Revenue (Million) Forecast, by Application 2019 & 2032
- Table 16: Russia Mannitol Market Revenue (Million) Forecast, by Application 2019 & 2032
- Table 17: Rest of Europe Mannitol Market Revenue (Million) Forecast, by Application 2019 & 2032
- Table 18: Global Mannitol Market Revenue Million Forecast, by Country 2019 & 2032
- Table 19: China Mannitol Market Revenue (Million) Forecast, by Application 2019 & 2032
- Table 20: Japan Mannitol Market Revenue (Million) Forecast, by Application 2019 & 2032
- Table 21: India Mannitol Market Revenue (Million) Forecast, by Application 2019 & 2032
- Table 22: Australia Mannitol Market Revenue (Million) Forecast, by Application 2019 & 2032
- Table 23: Rest of Asia Pacific Mannitol Market Revenue (Million) Forecast, by Application 2019 & 2032
- Table 24: Global Mannitol Market Revenue Million Forecast, by Country 2019 & 2032
- Table 25: Brazil Mannitol Market Revenue (Million) Forecast, by Application 2019 & 2032
- Table 26: Argentina Mannitol Market Revenue (Million) Forecast, by Application 2019 & 2032
- Table 27: Rest of South America Mannitol Market Revenue (Million) Forecast, by Application 2019 & 2032
- Table 28: Global Mannitol Market Revenue Million Forecast, by Country 2019 & 2032
- Table 29: South Africa Mannitol Market Revenue (Million) Forecast, by Application 2019 & 2032
- Table 30: Saudi Arabia Mannitol Market Revenue (Million) Forecast, by Application 2019 & 2032
- Table 31: Rest of Middle East and Africa Mannitol Market Revenue (Million) Forecast, by Application 2019 & 2032
- Table 32: Global Mannitol Market Revenue Million Forecast, by Form 2019 & 2032
- Table 33: Global Mannitol Market Revenue Million Forecast, by Application 2019 & 2032
- Table 34: Global Mannitol Market Revenue Million Forecast, by Country 2019 & 2032
- Table 35: United States Mannitol Market Revenue (Million) Forecast, by Application 2019 & 2032
- Table 36: Canada Mannitol Market Revenue (Million) Forecast, by Application 2019 & 2032
- Table 37: Mexico Mannitol Market Revenue (Million) Forecast, by Application 2019 & 2032
- Table 38: Rest of North America Mannitol Market Revenue (Million) Forecast, by Application 2019 & 2032
- Table 39: Global Mannitol Market Revenue Million Forecast, by Form 2019 & 2032
- Table 40: Global Mannitol Market Revenue Million Forecast, by Application 2019 & 2032
- Table 41: Global Mannitol Market Revenue Million Forecast, by Country 2019 & 2032
- Table 42: Spain Mannitol Market Revenue (Million) Forecast, by Application 2019 & 2032
- Table 43: United Kingdom Mannitol Market Revenue (Million) Forecast, by Application 2019 & 2032
- Table 44: Germany Mannitol Market Revenue (Million) Forecast, by Application 2019 & 2032
- Table 45: France Mannitol Market Revenue (Million) Forecast, by Application 2019 & 2032
- Table 46: Italy Mannitol Market Revenue (Million) Forecast, by Application 2019 & 2032
- Table 47: Russia Mannitol Market Revenue (Million) Forecast, by Application 2019 & 2032
- Table 48: Rest of Europe Mannitol Market Revenue (Million) Forecast, by Application 2019 & 2032
- Table 49: Global Mannitol Market Revenue Million Forecast, by Form 2019 & 2032
- Table 50: Global Mannitol Market Revenue Million Forecast, by Application 2019 & 2032
- Table 51: Global Mannitol Market Revenue Million Forecast, by Country 2019 & 2032
- Table 52: China Mannitol Market Revenue (Million) Forecast, by Application 2019 & 2032
- Table 53: Japan Mannitol Market Revenue (Million) Forecast, by Application 2019 & 2032
- Table 54: India Mannitol Market Revenue (Million) Forecast, by Application 2019 & 2032
- Table 55: Australia Mannitol Market Revenue (Million) Forecast, by Application 2019 & 2032
- Table 56: Rest of Asia Pacific Mannitol Market Revenue (Million) Forecast, by Application 2019 & 2032
- Table 57: Global Mannitol Market Revenue Million Forecast, by Form 2019 & 2032
- Table 58: Global Mannitol Market Revenue Million Forecast, by Application 2019 & 2032
- Table 59: Global Mannitol Market Revenue Million Forecast, by Country 2019 & 2032
- Table 60: Brazil Mannitol Market Revenue (Million) Forecast, by Application 2019 & 2032
- Table 61: Argentina Mannitol Market Revenue (Million) Forecast, by Application 2019 & 2032
- Table 62: Rest of South America Mannitol Market Revenue (Million) Forecast, by Application 2019 & 2032
- Table 63: Global Mannitol Market Revenue Million Forecast, by Form 2019 & 2032
- Table 64: Global Mannitol Market Revenue Million Forecast, by Application 2019 & 2032
- Table 65: Global Mannitol Market Revenue Million Forecast, by Country 2019 & 2032
- Table 66: South Africa Mannitol Market Revenue (Million) Forecast, by Application 2019 & 2032
- Table 67: Saudi Arabia Mannitol Market Revenue (Million) Forecast, by Application 2019 & 2032
- Table 68: Rest of Middle East and Africa Mannitol Market Revenue (Million) Forecast, by Application 2019 & 2032
Frequently Asked Questions
1. What is the projected Compound Annual Growth Rate (CAGR) of the Mannitol Market?
The projected CAGR is approximately 3.51%.
2. Which companies are prominent players in the Mannitol Market?
Key companies in the market include SPI Pharma, Cargill Incorporated, Rongde Seaweed Co Ltd, Singsino Group Ltd, Merck Millipore Corporation, Roquette Freres Company, Bright Moon Seaweed*List Not Exhaustive, Ingredion Incorporated, Shijiazhuang Huaxu Pharmaceutical Co Ltd.
3. What are the main segments of the Mannitol Market?
The market segments include Form, Application.
4. Can you provide details about the market size?
The market size is estimated to be USD XX Million as of 2022.
5. What are some drivers contributing to market growth?
Inclination Toward Low-Sugar/Sugar-free Beverages.
6. What are the notable trends driving market growth?
Mannitol Market is Gaining Popularity in the Bakery and confectionery Industry.
7. Are there any restraints impacting market growth?
Concerns Over Health Issues Associated with Functional Beverages.
8. Can you provide examples of recent developments in the market?
N/A
9. What pricing options are available for accessing the report?
Pricing options include single-user, multi-user, and enterprise licenses priced at USD 4750, USD 5250, and USD 8750 respectively.
10. Is the market size provided in terms of value or volume?
The market size is provided in terms of value, measured in Million.
11. Are there any specific market keywords associated with the report?
Yes, the market keyword associated with the report is "Mannitol Market," which aids in identifying and referencing the specific market segment covered.
12. How do I determine which pricing option suits my needs best?
The pricing options vary based on user requirements and access needs. Individual users may opt for single-user licenses, while businesses requiring broader access may choose multi-user or enterprise licenses for cost-effective access to the report.
13. Are there any additional resources or data provided in the Mannitol Market report?
While the report offers comprehensive insights, it's advisable to review the specific contents or supplementary materials provided to ascertain if additional resources or data are available.
14. How can I stay updated on further developments or reports in the Mannitol Market?
To stay informed about further developments, trends, and reports in the Mannitol Market, consider subscribing to industry newsletters, following relevant companies and organizations, or regularly checking reputable industry news sources and publications.
Methodology
Step 1 - Identification of Relevant Samples Size from Population Database


Step 2 - Approaches for Defining Global Market Size (Value, Volume* & Price*)

Note*: In applicable scenarios
Step 3 - Data Sources
Primary Research
- Web Analytics
- Survey Reports
- Research Institute
- Latest Research Reports
- Opinion Leaders
Secondary Research
- Annual Reports
- White Paper
- Latest Press Release
- Industry Association
- Paid Database
- Investor Presentations

Step 4 - Data Triangulation
Involves using different sources of information in order to increase the validity of a study
These sources are likely to be stakeholders in a program - participants, other researchers, program staff, other community members, and so on.
Then we put all data in single framework & apply various statistical tools to find out the dynamic on the market.
During the analysis stage, feedback from the stakeholder groups would be compared to determine areas of agreement as well as areas of divergence


