
Key Insights
The marine composites market is experiencing robust growth, driven by the increasing demand for lightweight, high-strength materials in the marine industry. A CAGR exceeding 4% indicates a significant expansion projected through 2033. This growth is fueled by several key factors. Firstly, the rising popularity of recreational boating, particularly sailboats and powerboats, is creating a substantial demand for composite materials due to their superior performance characteristics compared to traditional materials like wood and steel. Secondly, the shipbuilding industry's ongoing focus on fuel efficiency and reduced emissions is driving the adoption of lightweight composites in larger vessels such as cruise ships. This trend is further amplified by advancements in composite materials technology, leading to improved durability, strength-to-weight ratios, and reduced maintenance costs. The market segmentation reveals a diverse landscape, with epoxy resins maintaining a significant market share due to their excellent bonding properties and versatility. However, the growing interest in sustainable materials is fostering innovation in other resin types and composite materials, paving the way for alternative, eco-friendly solutions. Geographically, the Asia-Pacific region, particularly China and India, is expected to dominate the market due to a large manufacturing base and significant growth in the shipbuilding and recreational boating sectors. North America and Europe also represent significant markets, driven by high demand and established manufacturing facilities. While factors such as high initial material costs and the complex manufacturing processes pose some restraints, the overall market outlook remains positive, indicating continued growth and innovation within the marine composites sector.
The competitive landscape is characterized by a mix of large multinational corporations like Owens Corning and DuPont, alongside specialized composite manufacturers such as Premier Composite Technologies and GMS Composites. These companies are engaged in continuous innovation to improve material properties, expand their product portfolios, and cater to the diverse needs of different vessel types and applications. Strategic partnerships and collaborations are also becoming increasingly common as companies aim to leverage expertise and expand their market reach. Future growth will likely be shaped by the adoption of advanced manufacturing techniques, the development of sustainable and recyclable composites, and the increasing integration of smart technologies within marine vessels. The continued focus on lightweighting, enhanced durability, and improved fuel efficiency will further propel the demand for marine composites in the years to come. The market's substantial size and promising growth trajectory make it an attractive investment opportunity for both established players and emerging companies within the industry.

Marine Composites Market: A Comprehensive Report (2019-2033)
This in-depth report provides a comprehensive analysis of the global Marine Composites Market, offering actionable insights for industry stakeholders. The study covers the period 2019-2033, with 2025 as the base year and a forecast period of 2025-2033. The report segments the market by Vessel Type (Sailboats, Cruise Ships, Power Boats, Other Vessel Types), Composite Type (Metal Matrix Composites, Polymer Matrix Composites, Ceramic Matrix Composites), and Resin Type (Epoxy, Polyester, Other Resin Types). Key players analyzed include Premier Composite Technologies, GMS Composites, Advanced Custom Manufacturing, Owens Corning, DuPont, Hyosung, Hexcel Corporation, Gurit, Airborne, and Toray Group (ZOLTEK Corporation), among others.
Marine Composites Market Concentration & Innovation
The marine composites market exhibits a moderately concentrated landscape, with a few major players holding significant market share. Premier Composite Technologies and Hexcel Corporation, for instance, are estimated to collectively hold approximately xx% of the market in 2025. However, the market also features numerous smaller, specialized companies catering to niche segments. Innovation is a key driver, with ongoing advancements in resin technology (e.g., bio-based resins) and composite materials leading to lighter, stronger, and more durable marine structures. Stringent environmental regulations are pushing for the development of sustainable composite materials with reduced environmental impact. Product substitution is a moderate factor, with other materials like aluminum and steel competing in certain applications, particularly where cost is a primary concern. M&A activity has been relatively moderate in recent years, with deal values averaging approximately xx Million annually in the historical period, but expected to increase in the forecast period. End-user trends, particularly towards larger and more luxurious vessels, are driving demand for advanced composite materials.
- Market Concentration: Moderately concentrated, with top players holding xx% market share in 2025.
- Innovation Drivers: Advancements in resin technology, sustainable materials, and improved manufacturing processes.
- Regulatory Framework: Stringent environmental regulations driving demand for sustainable composites.
- Product Substitutes: Aluminum, steel, and other materials present moderate competition.
- End-User Trends: Growing demand for larger, more luxurious vessels fuels market growth.
- M&A Activity: Average deal value of xx Million annually (2019-2024), projected to increase.
Marine Composites Market Industry Trends & Insights
The marine composites market is experiencing robust growth, driven by several factors. The rising demand for recreational boats, coupled with the increasing popularity of high-performance sailing yachts and luxury cruise ships, is a significant growth driver. Technological advancements, particularly in the development of lightweight and high-strength composites, are enhancing the performance and durability of marine vessels. Consumer preferences for environmentally friendly materials are also shaping market trends, boosting demand for bio-based and recyclable composites. The market is witnessing increasing adoption of automated manufacturing techniques which increases the efficiency. The competitive landscape is dynamic, with both established players and new entrants vying for market share. The CAGR for the marine composites market is projected to be xx% during the forecast period (2025-2033). Market penetration of advanced composites is expected to increase from xx% in 2025 to xx% by 2033.

Dominant Markets & Segments in Marine Composites Market
The Polymer Matrix Composites segment dominates the market, accounting for over xx% of the total market value in 2025. Within the vessel types, the Power Boats segment is the largest, followed by Sailboats and Cruise Ships. The Epoxy Resin type holds the largest share in the resin market.
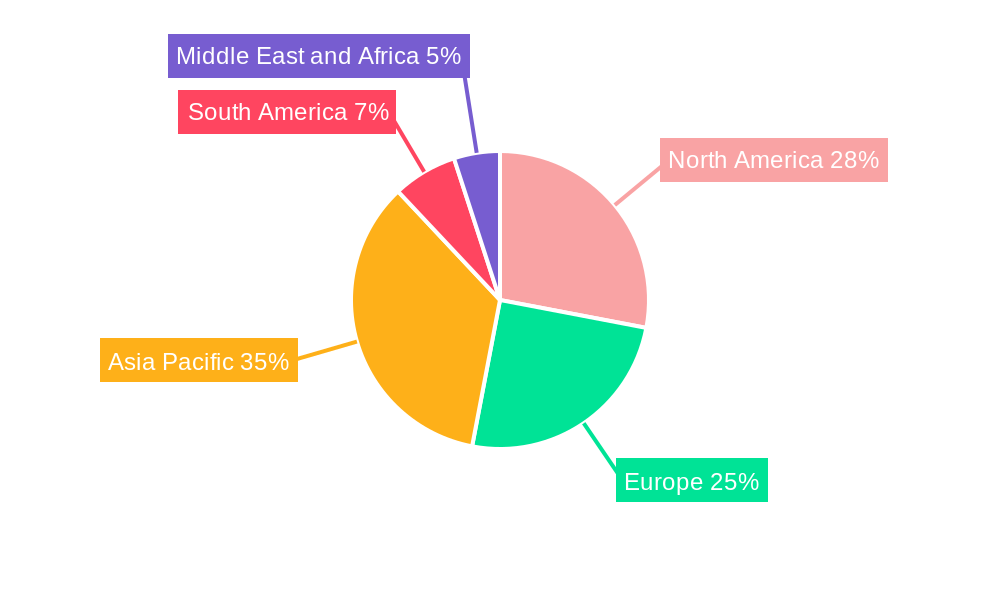
- Leading Region: North America is projected to dominate the market due to high demand and technological advancements, followed by Europe.
- Key Drivers (North America): Strong recreational boating market, advanced manufacturing capabilities, and supportive government policies.
- Key Drivers (Europe): Growing demand for luxury yachts and cruise ships, and a robust shipbuilding industry.
- Dominant Segment: Polymer Matrix Composites (xx% market share in 2025) due to its versatility, cost-effectiveness, and excellent performance characteristics. Epoxy Resin is the dominant resin type due to its superior strength and bonding properties. The Power Boats segment represents the largest share of vessel types.
Marine Composites Market Product Developments
Recent product developments focus on enhancing the performance and sustainability of marine composites. Innovations include lighter and stronger materials, improved resin systems with enhanced durability and UV resistance, and the incorporation of recycled materials. These advancements improve fuel efficiency, reduce maintenance costs, and enhance the overall lifespan of marine vessels.
Report Scope & Segmentation Analysis
This report segments the marine composites market by vessel type (sailboats, cruise ships, powerboats, other vessel types), composite type (metal matrix composites, polymer matrix composites, ceramic matrix composites), and resin type (epoxy, polyester, other resin types). Each segment's growth projections, market size, and competitive dynamics are analyzed in detail. The polymer matrix composites segment is projected to experience the fastest growth due to its versatility and cost-effectiveness. The epoxy resin type is expected to maintain its dominance due to its superior performance characteristics. The powerboats segment is expected to see significant growth driven by the recreational boating industry.
Key Drivers of Marine Composites Market Growth
The marine composites market is propelled by several key factors, including the increasing demand for high-performance and lightweight vessels, technological advancements in composite materials and manufacturing processes, and stringent environmental regulations promoting sustainable solutions. Government incentives and the growing popularity of recreational boating are also significant contributors.
Challenges in the Marine Composites Market Sector
The marine composites market faces challenges including the high initial cost of advanced composites, potential supply chain disruptions impacting the availability of raw materials, and intense competition among manufacturers. Further, the complexity of composite manufacturing and the need for skilled labor can also pose challenges.
Emerging Opportunities in Marine Composites Market
Emerging opportunities include the growing demand for sustainable and bio-based composites, the development of innovative manufacturing processes for improved efficiency and cost reduction, and expanding applications in various segments of the marine industry, such as wind energy and offshore structures.
Leading Players in the Marine Composites Market Market
- Premier Composite Technologies
- GMS Composites
- Advanced Custom Manufacturing
- Owens Corning
- DuPont
- Hyosung
- Hexcel Corporation
- Gurit
- Airborne
- Toray Group (ZOLTEK Corporation)
- List Not Exhaustive
Key Developments in Marine Composites Market Industry
- January 2023: Hexcel Corporation launched a new line of high-performance epoxy resins for marine applications.
- March 2022: Gurit acquired a smaller composite manufacturer, expanding its market reach.
- June 2021: Owens Corning announced a new partnership to develop sustainable composite materials for the marine industry. (Note: Further key developments will be included in the full report.)
Strategic Outlook for Marine Composites Market Market
The marine composites market is poised for continued growth, driven by the increasing demand for high-performance and sustainable marine vessels. Innovation in composite materials and manufacturing technologies will play a crucial role in shaping the future of the market. Companies that can effectively leverage these technological advancements and adapt to evolving consumer preferences will be well-positioned for success.
Marine Composites Market Segmentation
-
1. Composite Type
- 1.1. Metal Matrix Composites
- 1.2. Polymer Matrix Composites
- 1.3. Ceramic Matrix Composites
-
2. Resin Type
- 2.1. Epoxy
- 2.2. Polyester
- 2.3. Other Resin Types
-
3. Vessel Type
- 3.1. Sailboats
- 3.2. Cruise Ships
- 3.3. Power Boats
- 3.4. Other Vessel Types
Marine Composites Market Segmentation By Geography
-
1. Asia Pacific
- 1.1. China
- 1.2. India
- 1.3. Japan
- 1.4. South Korea
- 1.5. Rest of Asia Pacific
-
2. North America
- 2.1. United States
- 2.2. Canada
- 2.3. Mexico
-
3. Europe
- 3.1. Germany
- 3.2. United Kingdom
- 3.3. Italy
- 3.4. France
- 3.5. Rest of Europe
-
4. South America
- 4.1. Brazil
- 4.2. Argentina
- 4.3. Rest of South America
-
5. Middle East and Africa
- 5.1. Saudi Arabia
- 5.2. South Africa
- 5.3. Rest of Middle East and Africa
Marine Composites Market REPORT HIGHLIGHTS
| Aspects | Details |
|---|---|
| Study Period | 2019-2033 |
| Base Year | 2024 |
| Estimated Year | 2025 |
| Forecast Period | 2025-2033 |
| Historical Period | 2019-2024 |
| Growth Rate | CAGR of > 4.00% from 2019-2033 |
| Segmentation |
|
Table of Contents
- 1. Introduction
- 1.1. Research Scope
- 1.2. Market Segmentation
- 1.3. Research Methodology
- 1.4. Definitions and Assumptions
- 2. Executive Summary
- 2.1. Introduction
- 3. Market Dynamics
- 3.1. Introduction
- 3.2. Market Drivers
- 3.2.1. ; Increasing Production of Leisure Boats and Cruise Ships; Other Drivers
- 3.3. Market Restrains
- 3.3.1. ; Unfavorable Conditions Arising Due to COVID-19 Outbreak; Other Restraints
- 3.4. Market Trends
- 3.4.1. Increasing Demand for Cruise Ships
- 4. Market Factor Analysis
- 4.1. Porters Five Forces
- 4.2. Supply/Value Chain
- 4.3. PESTEL analysis
- 4.4. Market Entropy
- 4.5. Patent/Trademark Analysis
- 5. Global Marine Composites Market Analysis, Insights and Forecast, 2019-2031
- 5.1. Market Analysis, Insights and Forecast - by Composite Type
- 5.1.1. Metal Matrix Composites
- 5.1.2. Polymer Matrix Composites
- 5.1.3. Ceramic Matrix Composites
- 5.2. Market Analysis, Insights and Forecast - by Resin Type
- 5.2.1. Epoxy
- 5.2.2. Polyester
- 5.2.3. Other Resin Types
- 5.3. Market Analysis, Insights and Forecast - by Vessel Type
- 5.3.1. Sailboats
- 5.3.2. Cruise Ships
- 5.3.3. Power Boats
- 5.3.4. Other Vessel Types
- 5.4. Market Analysis, Insights and Forecast - by Region
- 5.4.1. Asia Pacific
- 5.4.2. North America
- 5.4.3. Europe
- 5.4.4. South America
- 5.4.5. Middle East and Africa
- 5.1. Market Analysis, Insights and Forecast - by Composite Type
- 6. Asia Pacific Marine Composites Market Analysis, Insights and Forecast, 2019-2031
- 6.1. Market Analysis, Insights and Forecast - by Composite Type
- 6.1.1. Metal Matrix Composites
- 6.1.2. Polymer Matrix Composites
- 6.1.3. Ceramic Matrix Composites
- 6.2. Market Analysis, Insights and Forecast - by Resin Type
- 6.2.1. Epoxy
- 6.2.2. Polyester
- 6.2.3. Other Resin Types
- 6.3. Market Analysis, Insights and Forecast - by Vessel Type
- 6.3.1. Sailboats
- 6.3.2. Cruise Ships
- 6.3.3. Power Boats
- 6.3.4. Other Vessel Types
- 6.1. Market Analysis, Insights and Forecast - by Composite Type
- 7. North America Marine Composites Market Analysis, Insights and Forecast, 2019-2031
- 7.1. Market Analysis, Insights and Forecast - by Composite Type
- 7.1.1. Metal Matrix Composites
- 7.1.2. Polymer Matrix Composites
- 7.1.3. Ceramic Matrix Composites
- 7.2. Market Analysis, Insights and Forecast - by Resin Type
- 7.2.1. Epoxy
- 7.2.2. Polyester
- 7.2.3. Other Resin Types
- 7.3. Market Analysis, Insights and Forecast - by Vessel Type
- 7.3.1. Sailboats
- 7.3.2. Cruise Ships
- 7.3.3. Power Boats
- 7.3.4. Other Vessel Types
- 7.1. Market Analysis, Insights and Forecast - by Composite Type
- 8. Europe Marine Composites Market Analysis, Insights and Forecast, 2019-2031
- 8.1. Market Analysis, Insights and Forecast - by Composite Type
- 8.1.1. Metal Matrix Composites
- 8.1.2. Polymer Matrix Composites
- 8.1.3. Ceramic Matrix Composites
- 8.2. Market Analysis, Insights and Forecast - by Resin Type
- 8.2.1. Epoxy
- 8.2.2. Polyester
- 8.2.3. Other Resin Types
- 8.3. Market Analysis, Insights and Forecast - by Vessel Type
- 8.3.1. Sailboats
- 8.3.2. Cruise Ships
- 8.3.3. Power Boats
- 8.3.4. Other Vessel Types
- 8.1. Market Analysis, Insights and Forecast - by Composite Type
- 9. South America Marine Composites Market Analysis, Insights and Forecast, 2019-2031
- 9.1. Market Analysis, Insights and Forecast - by Composite Type
- 9.1.1. Metal Matrix Composites
- 9.1.2. Polymer Matrix Composites
- 9.1.3. Ceramic Matrix Composites
- 9.2. Market Analysis, Insights and Forecast - by Resin Type
- 9.2.1. Epoxy
- 9.2.2. Polyester
- 9.2.3. Other Resin Types
- 9.3. Market Analysis, Insights and Forecast - by Vessel Type
- 9.3.1. Sailboats
- 9.3.2. Cruise Ships
- 9.3.3. Power Boats
- 9.3.4. Other Vessel Types
- 9.1. Market Analysis, Insights and Forecast - by Composite Type
- 10. Middle East and Africa Marine Composites Market Analysis, Insights and Forecast, 2019-2031
- 10.1. Market Analysis, Insights and Forecast - by Composite Type
- 10.1.1. Metal Matrix Composites
- 10.1.2. Polymer Matrix Composites
- 10.1.3. Ceramic Matrix Composites
- 10.2. Market Analysis, Insights and Forecast - by Resin Type
- 10.2.1. Epoxy
- 10.2.2. Polyester
- 10.2.3. Other Resin Types
- 10.3. Market Analysis, Insights and Forecast - by Vessel Type
- 10.3.1. Sailboats
- 10.3.2. Cruise Ships
- 10.3.3. Power Boats
- 10.3.4. Other Vessel Types
- 10.1. Market Analysis, Insights and Forecast - by Composite Type
- 11. Asia Pacific Marine Composites Market Analysis, Insights and Forecast, 2019-2031
- 11.1. Market Analysis, Insights and Forecast - By Country/Sub-region
- 11.1.1 China
- 11.1.2 India
- 11.1.3 Japan
- 11.1.4 South Korea
- 11.1.5 Rest of Asia Pacific
- 12. North America Marine Composites Market Analysis, Insights and Forecast, 2019-2031
- 12.1. Market Analysis, Insights and Forecast - By Country/Sub-region
- 12.1.1 United States
- 12.1.2 Canada
- 12.1.3 Mexico
- 13. Europe Marine Composites Market Analysis, Insights and Forecast, 2019-2031
- 13.1. Market Analysis, Insights and Forecast - By Country/Sub-region
- 13.1.1 Germany
- 13.1.2 United Kingdom
- 13.1.3 Italy
- 13.1.4 France
- 13.1.5 Rest of Europe
- 14. South America Marine Composites Market Analysis, Insights and Forecast, 2019-2031
- 14.1. Market Analysis, Insights and Forecast - By Country/Sub-region
- 14.1.1 Brazil
- 14.1.2 Argentina
- 14.1.3 Rest of South America
- 15. Middle East and Africa Marine Composites Market Analysis, Insights and Forecast, 2019-2031
- 15.1. Market Analysis, Insights and Forecast - By Country/Sub-region
- 15.1.1 Saudi Arabia
- 15.1.2 South Africa
- 15.1.3 Rest of Middle East and Africa
- 16. Competitive Analysis
- 16.1. Global Market Share Analysis 2024
- 16.2. Company Profiles
- 16.2.1 Premier Composite Technologies
- 16.2.1.1. Overview
- 16.2.1.2. Products
- 16.2.1.3. SWOT Analysis
- 16.2.1.4. Recent Developments
- 16.2.1.5. Financials (Based on Availability)
- 16.2.2 GMS Composites
- 16.2.2.1. Overview
- 16.2.2.2. Products
- 16.2.2.3. SWOT Analysis
- 16.2.2.4. Recent Developments
- 16.2.2.5. Financials (Based on Availability)
- 16.2.3 Advanced Custom Manufacturing
- 16.2.3.1. Overview
- 16.2.3.2. Products
- 16.2.3.3. SWOT Analysis
- 16.2.3.4. Recent Developments
- 16.2.3.5. Financials (Based on Availability)
- 16.2.4 Owens Corning
- 16.2.4.1. Overview
- 16.2.4.2. Products
- 16.2.4.3. SWOT Analysis
- 16.2.4.4. Recent Developments
- 16.2.4.5. Financials (Based on Availability)
- 16.2.5 DuPont
- 16.2.5.1. Overview
- 16.2.5.2. Products
- 16.2.5.3. SWOT Analysis
- 16.2.5.4. Recent Developments
- 16.2.5.5. Financials (Based on Availability)
- 16.2.6 Hyosung
- 16.2.6.1. Overview
- 16.2.6.2. Products
- 16.2.6.3. SWOT Analysis
- 16.2.6.4. Recent Developments
- 16.2.6.5. Financials (Based on Availability)
- 16.2.7 Hexcel Corporation
- 16.2.7.1. Overview
- 16.2.7.2. Products
- 16.2.7.3. SWOT Analysis
- 16.2.7.4. Recent Developments
- 16.2.7.5. Financials (Based on Availability)
- 16.2.8 Gurit
- 16.2.8.1. Overview
- 16.2.8.2. Products
- 16.2.8.3. SWOT Analysis
- 16.2.8.4. Recent Developments
- 16.2.8.5. Financials (Based on Availability)
- 16.2.9 Airborne
- 16.2.9.1. Overview
- 16.2.9.2. Products
- 16.2.9.3. SWOT Analysis
- 16.2.9.4. Recent Developments
- 16.2.9.5. Financials (Based on Availability)
- 16.2.10 Toray Group (ZOLTEK Corporation)*List Not Exhaustive
- 16.2.10.1. Overview
- 16.2.10.2. Products
- 16.2.10.3. SWOT Analysis
- 16.2.10.4. Recent Developments
- 16.2.10.5. Financials (Based on Availability)
- 16.2.1 Premier Composite Technologies
List of Figures
- Figure 1: Global Marine Composites Market Revenue Breakdown (Million, %) by Region 2024 & 2032
- Figure 2: Asia Pacific Marine Composites Market Revenue (Million), by Country 2024 & 2032
- Figure 3: Asia Pacific Marine Composites Market Revenue Share (%), by Country 2024 & 2032
- Figure 4: North America Marine Composites Market Revenue (Million), by Country 2024 & 2032
- Figure 5: North America Marine Composites Market Revenue Share (%), by Country 2024 & 2032
- Figure 6: Europe Marine Composites Market Revenue (Million), by Country 2024 & 2032
- Figure 7: Europe Marine Composites Market Revenue Share (%), by Country 2024 & 2032
- Figure 8: South America Marine Composites Market Revenue (Million), by Country 2024 & 2032
- Figure 9: South America Marine Composites Market Revenue Share (%), by Country 2024 & 2032
- Figure 10: Middle East and Africa Marine Composites Market Revenue (Million), by Country 2024 & 2032
- Figure 11: Middle East and Africa Marine Composites Market Revenue Share (%), by Country 2024 & 2032
- Figure 12: Asia Pacific Marine Composites Market Revenue (Million), by Composite Type 2024 & 2032
- Figure 13: Asia Pacific Marine Composites Market Revenue Share (%), by Composite Type 2024 & 2032
- Figure 14: Asia Pacific Marine Composites Market Revenue (Million), by Resin Type 2024 & 2032
- Figure 15: Asia Pacific Marine Composites Market Revenue Share (%), by Resin Type 2024 & 2032
- Figure 16: Asia Pacific Marine Composites Market Revenue (Million), by Vessel Type 2024 & 2032
- Figure 17: Asia Pacific Marine Composites Market Revenue Share (%), by Vessel Type 2024 & 2032
- Figure 18: Asia Pacific Marine Composites Market Revenue (Million), by Country 2024 & 2032
- Figure 19: Asia Pacific Marine Composites Market Revenue Share (%), by Country 2024 & 2032
- Figure 20: North America Marine Composites Market Revenue (Million), by Composite Type 2024 & 2032
- Figure 21: North America Marine Composites Market Revenue Share (%), by Composite Type 2024 & 2032
- Figure 22: North America Marine Composites Market Revenue (Million), by Resin Type 2024 & 2032
- Figure 23: North America Marine Composites Market Revenue Share (%), by Resin Type 2024 & 2032
- Figure 24: North America Marine Composites Market Revenue (Million), by Vessel Type 2024 & 2032
- Figure 25: North America Marine Composites Market Revenue Share (%), by Vessel Type 2024 & 2032
- Figure 26: North America Marine Composites Market Revenue (Million), by Country 2024 & 2032
- Figure 27: North America Marine Composites Market Revenue Share (%), by Country 2024 & 2032
- Figure 28: Europe Marine Composites Market Revenue (Million), by Composite Type 2024 & 2032
- Figure 29: Europe Marine Composites Market Revenue Share (%), by Composite Type 2024 & 2032
- Figure 30: Europe Marine Composites Market Revenue (Million), by Resin Type 2024 & 2032
- Figure 31: Europe Marine Composites Market Revenue Share (%), by Resin Type 2024 & 2032
- Figure 32: Europe Marine Composites Market Revenue (Million), by Vessel Type 2024 & 2032
- Figure 33: Europe Marine Composites Market Revenue Share (%), by Vessel Type 2024 & 2032
- Figure 34: Europe Marine Composites Market Revenue (Million), by Country 2024 & 2032
- Figure 35: Europe Marine Composites Market Revenue Share (%), by Country 2024 & 2032
- Figure 36: South America Marine Composites Market Revenue (Million), by Composite Type 2024 & 2032
- Figure 37: South America Marine Composites Market Revenue Share (%), by Composite Type 2024 & 2032
- Figure 38: South America Marine Composites Market Revenue (Million), by Resin Type 2024 & 2032
- Figure 39: South America Marine Composites Market Revenue Share (%), by Resin Type 2024 & 2032
- Figure 40: South America Marine Composites Market Revenue (Million), by Vessel Type 2024 & 2032
- Figure 41: South America Marine Composites Market Revenue Share (%), by Vessel Type 2024 & 2032
- Figure 42: South America Marine Composites Market Revenue (Million), by Country 2024 & 2032
- Figure 43: South America Marine Composites Market Revenue Share (%), by Country 2024 & 2032
- Figure 44: Middle East and Africa Marine Composites Market Revenue (Million), by Composite Type 2024 & 2032
- Figure 45: Middle East and Africa Marine Composites Market Revenue Share (%), by Composite Type 2024 & 2032
- Figure 46: Middle East and Africa Marine Composites Market Revenue (Million), by Resin Type 2024 & 2032
- Figure 47: Middle East and Africa Marine Composites Market Revenue Share (%), by Resin Type 2024 & 2032
- Figure 48: Middle East and Africa Marine Composites Market Revenue (Million), by Vessel Type 2024 & 2032
- Figure 49: Middle East and Africa Marine Composites Market Revenue Share (%), by Vessel Type 2024 & 2032
- Figure 50: Middle East and Africa Marine Composites Market Revenue (Million), by Country 2024 & 2032
- Figure 51: Middle East and Africa Marine Composites Market Revenue Share (%), by Country 2024 & 2032
List of Tables
- Table 1: Global Marine Composites Market Revenue Million Forecast, by Region 2019 & 2032
- Table 2: Global Marine Composites Market Revenue Million Forecast, by Composite Type 2019 & 2032
- Table 3: Global Marine Composites Market Revenue Million Forecast, by Resin Type 2019 & 2032
- Table 4: Global Marine Composites Market Revenue Million Forecast, by Vessel Type 2019 & 2032
- Table 5: Global Marine Composites Market Revenue Million Forecast, by Region 2019 & 2032
- Table 6: Global Marine Composites Market Revenue Million Forecast, by Country 2019 & 2032
- Table 7: China Marine Composites Market Revenue (Million) Forecast, by Application 2019 & 2032
- Table 8: India Marine Composites Market Revenue (Million) Forecast, by Application 2019 & 2032
- Table 9: Japan Marine Composites Market Revenue (Million) Forecast, by Application 2019 & 2032
- Table 10: South Korea Marine Composites Market Revenue (Million) Forecast, by Application 2019 & 2032
- Table 11: Rest of Asia Pacific Marine Composites Market Revenue (Million) Forecast, by Application 2019 & 2032
- Table 12: Global Marine Composites Market Revenue Million Forecast, by Country 2019 & 2032
- Table 13: United States Marine Composites Market Revenue (Million) Forecast, by Application 2019 & 2032
- Table 14: Canada Marine Composites Market Revenue (Million) Forecast, by Application 2019 & 2032
- Table 15: Mexico Marine Composites Market Revenue (Million) Forecast, by Application 2019 & 2032
- Table 16: Global Marine Composites Market Revenue Million Forecast, by Country 2019 & 2032
- Table 17: Germany Marine Composites Market Revenue (Million) Forecast, by Application 2019 & 2032
- Table 18: United Kingdom Marine Composites Market Revenue (Million) Forecast, by Application 2019 & 2032
- Table 19: Italy Marine Composites Market Revenue (Million) Forecast, by Application 2019 & 2032
- Table 20: France Marine Composites Market Revenue (Million) Forecast, by Application 2019 & 2032
- Table 21: Rest of Europe Marine Composites Market Revenue (Million) Forecast, by Application 2019 & 2032
- Table 22: Global Marine Composites Market Revenue Million Forecast, by Country 2019 & 2032
- Table 23: Brazil Marine Composites Market Revenue (Million) Forecast, by Application 2019 & 2032
- Table 24: Argentina Marine Composites Market Revenue (Million) Forecast, by Application 2019 & 2032
- Table 25: Rest of South America Marine Composites Market Revenue (Million) Forecast, by Application 2019 & 2032
- Table 26: Global Marine Composites Market Revenue Million Forecast, by Country 2019 & 2032
- Table 27: Saudi Arabia Marine Composites Market Revenue (Million) Forecast, by Application 2019 & 2032
- Table 28: South Africa Marine Composites Market Revenue (Million) Forecast, by Application 2019 & 2032
- Table 29: Rest of Middle East and Africa Marine Composites Market Revenue (Million) Forecast, by Application 2019 & 2032
- Table 30: Global Marine Composites Market Revenue Million Forecast, by Composite Type 2019 & 2032
- Table 31: Global Marine Composites Market Revenue Million Forecast, by Resin Type 2019 & 2032
- Table 32: Global Marine Composites Market Revenue Million Forecast, by Vessel Type 2019 & 2032
- Table 33: Global Marine Composites Market Revenue Million Forecast, by Country 2019 & 2032
- Table 34: China Marine Composites Market Revenue (Million) Forecast, by Application 2019 & 2032
- Table 35: India Marine Composites Market Revenue (Million) Forecast, by Application 2019 & 2032
- Table 36: Japan Marine Composites Market Revenue (Million) Forecast, by Application 2019 & 2032
- Table 37: South Korea Marine Composites Market Revenue (Million) Forecast, by Application 2019 & 2032
- Table 38: Rest of Asia Pacific Marine Composites Market Revenue (Million) Forecast, by Application 2019 & 2032
- Table 39: Global Marine Composites Market Revenue Million Forecast, by Composite Type 2019 & 2032
- Table 40: Global Marine Composites Market Revenue Million Forecast, by Resin Type 2019 & 2032
- Table 41: Global Marine Composites Market Revenue Million Forecast, by Vessel Type 2019 & 2032
- Table 42: Global Marine Composites Market Revenue Million Forecast, by Country 2019 & 2032
- Table 43: United States Marine Composites Market Revenue (Million) Forecast, by Application 2019 & 2032
- Table 44: Canada Marine Composites Market Revenue (Million) Forecast, by Application 2019 & 2032
- Table 45: Mexico Marine Composites Market Revenue (Million) Forecast, by Application 2019 & 2032
- Table 46: Global Marine Composites Market Revenue Million Forecast, by Composite Type 2019 & 2032
- Table 47: Global Marine Composites Market Revenue Million Forecast, by Resin Type 2019 & 2032
- Table 48: Global Marine Composites Market Revenue Million Forecast, by Vessel Type 2019 & 2032
- Table 49: Global Marine Composites Market Revenue Million Forecast, by Country 2019 & 2032
- Table 50: Germany Marine Composites Market Revenue (Million) Forecast, by Application 2019 & 2032
- Table 51: United Kingdom Marine Composites Market Revenue (Million) Forecast, by Application 2019 & 2032
- Table 52: Italy Marine Composites Market Revenue (Million) Forecast, by Application 2019 & 2032
- Table 53: France Marine Composites Market Revenue (Million) Forecast, by Application 2019 & 2032
- Table 54: Rest of Europe Marine Composites Market Revenue (Million) Forecast, by Application 2019 & 2032
- Table 55: Global Marine Composites Market Revenue Million Forecast, by Composite Type 2019 & 2032
- Table 56: Global Marine Composites Market Revenue Million Forecast, by Resin Type 2019 & 2032
- Table 57: Global Marine Composites Market Revenue Million Forecast, by Vessel Type 2019 & 2032
- Table 58: Global Marine Composites Market Revenue Million Forecast, by Country 2019 & 2032
- Table 59: Brazil Marine Composites Market Revenue (Million) Forecast, by Application 2019 & 2032
- Table 60: Argentina Marine Composites Market Revenue (Million) Forecast, by Application 2019 & 2032
- Table 61: Rest of South America Marine Composites Market Revenue (Million) Forecast, by Application 2019 & 2032
- Table 62: Global Marine Composites Market Revenue Million Forecast, by Composite Type 2019 & 2032
- Table 63: Global Marine Composites Market Revenue Million Forecast, by Resin Type 2019 & 2032
- Table 64: Global Marine Composites Market Revenue Million Forecast, by Vessel Type 2019 & 2032
- Table 65: Global Marine Composites Market Revenue Million Forecast, by Country 2019 & 2032
- Table 66: Saudi Arabia Marine Composites Market Revenue (Million) Forecast, by Application 2019 & 2032
- Table 67: South Africa Marine Composites Market Revenue (Million) Forecast, by Application 2019 & 2032
- Table 68: Rest of Middle East and Africa Marine Composites Market Revenue (Million) Forecast, by Application 2019 & 2032
Frequently Asked Questions
1. What is the projected Compound Annual Growth Rate (CAGR) of the Marine Composites Market?
The projected CAGR is approximately > 4.00%.
2. Which companies are prominent players in the Marine Composites Market?
Key companies in the market include Premier Composite Technologies, GMS Composites, Advanced Custom Manufacturing, Owens Corning, DuPont, Hyosung, Hexcel Corporation, Gurit, Airborne, Toray Group (ZOLTEK Corporation)*List Not Exhaustive.
3. What are the main segments of the Marine Composites Market?
The market segments include Composite Type, Resin Type, Vessel Type.
4. Can you provide details about the market size?
The market size is estimated to be USD XX Million as of 2022.
5. What are some drivers contributing to market growth?
; Increasing Production of Leisure Boats and Cruise Ships; Other Drivers.
6. What are the notable trends driving market growth?
Increasing Demand for Cruise Ships.
7. Are there any restraints impacting market growth?
; Unfavorable Conditions Arising Due to COVID-19 Outbreak; Other Restraints.
8. Can you provide examples of recent developments in the market?
N/A
9. What pricing options are available for accessing the report?
Pricing options include single-user, multi-user, and enterprise licenses priced at USD 4750, USD 5250, and USD 8750 respectively.
10. Is the market size provided in terms of value or volume?
The market size is provided in terms of value, measured in Million.
11. Are there any specific market keywords associated with the report?
Yes, the market keyword associated with the report is "Marine Composites Market," which aids in identifying and referencing the specific market segment covered.
12. How do I determine which pricing option suits my needs best?
The pricing options vary based on user requirements and access needs. Individual users may opt for single-user licenses, while businesses requiring broader access may choose multi-user or enterprise licenses for cost-effective access to the report.
13. Are there any additional resources or data provided in the Marine Composites Market report?
While the report offers comprehensive insights, it's advisable to review the specific contents or supplementary materials provided to ascertain if additional resources or data are available.
14. How can I stay updated on further developments or reports in the Marine Composites Market?
To stay informed about further developments, trends, and reports in the Marine Composites Market, consider subscribing to industry newsletters, following relevant companies and organizations, or regularly checking reputable industry news sources and publications.
Methodology
Step 1 - Identification of Relevant Samples Size from Population Database


Step 2 - Approaches for Defining Global Market Size (Value, Volume* & Price*)

Note*: In applicable scenarios
Step 3 - Data Sources
Primary Research
- Web Analytics
- Survey Reports
- Research Institute
- Latest Research Reports
- Opinion Leaders
Secondary Research
- Annual Reports
- White Paper
- Latest Press Release
- Industry Association
- Paid Database
- Investor Presentations

Step 4 - Data Triangulation
Involves using different sources of information in order to increase the validity of a study
These sources are likely to be stakeholders in a program - participants, other researchers, program staff, other community members, and so on.
Then we put all data in single framework & apply various statistical tools to find out the dynamic on the market.
During the analysis stage, feedback from the stakeholder groups would be compared to determine areas of agreement as well as areas of divergence


