

Key Insights
The marine scrubber market is experiencing robust growth, driven by stringent international regulations aimed at reducing sulfur oxide (SOx) emissions from ships. The International Maritime Organization's (IMO) 2020 sulfur cap significantly impacted the market, mandating a global limit on sulfur content in marine fuels. This regulation spurred a surge in demand for scrubbers as a cost-effective compliance solution, particularly for vessels unable to readily switch to low-sulfur fuels. The market is segmented by scrubber type (wet and dry) and end-user industry (primarily shipping lines and cruise operators). Wet scrubbers currently dominate due to their lower initial investment costs, but dry scrubbers are gaining traction due to their reduced water consumption and waste management concerns. Further growth is expected as older vessels retrofit with scrubbers and newbuilds incorporate them from the outset. Regional variations exist, with North America and Europe leading in adoption due to established regulatory frameworks and a large fleet of existing vessels needing upgrades. However, the Asia-Pacific region is anticipated to demonstrate substantial growth in the coming years driven by its expanding shipping industry and increasing awareness of environmental regulations. The competitive landscape is marked by established players like Alfa Laval and Wärtsilä, alongside specialized scrubber manufacturers. Technological advancements, such as the development of more efficient and compact scrubber designs, are further fueling market expansion. Pricing dynamics are influenced by factors such as scrubber type, capacity, and vessel size, with the overall market projected to experience sustained growth through 2033.
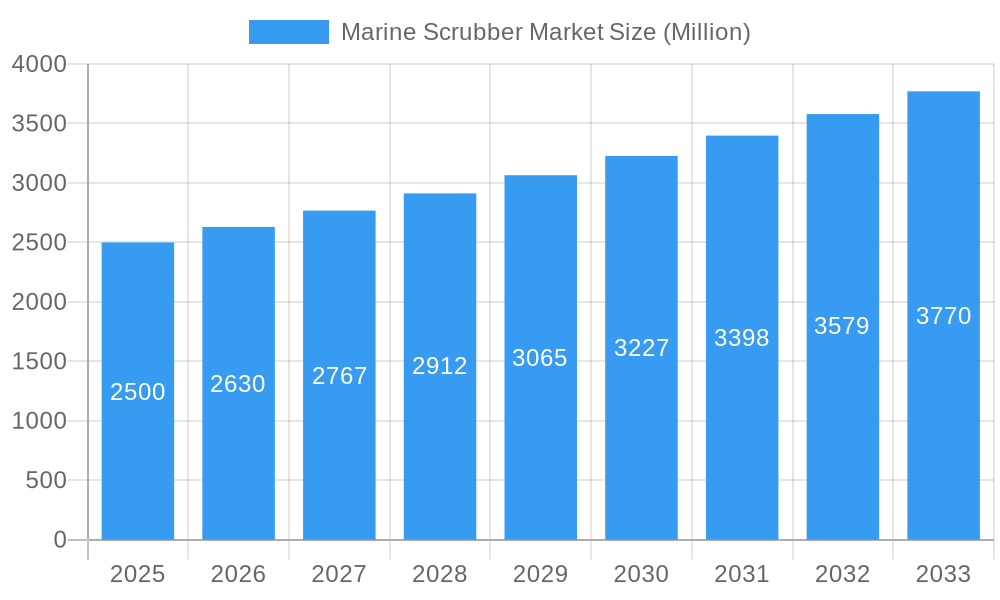
Marine Scrubber Market Market Size (In Billion)
The market's future hinges on continued enforcement of existing regulations, potential future tightening of emission standards, and technological innovation. Fluctuations in fuel prices also impact the cost-benefit analysis for scrubber adoption. While the initial investment can be substantial, the long-term operational cost savings from avoiding expensive low-sulfur fuel, combined with regulatory compliance, make scrubbers a compelling investment for many shipping companies. Further research and development are likely to focus on reducing scrubber size and improving efficiency, potentially lowering the barrier to entry for smaller vessels. Furthermore, advancements in waste management and water treatment technologies associated with wet scrubbers will continue to shape the market's evolution, with ongoing efforts to minimize the environmental footprint of this crucial emissions control technology.
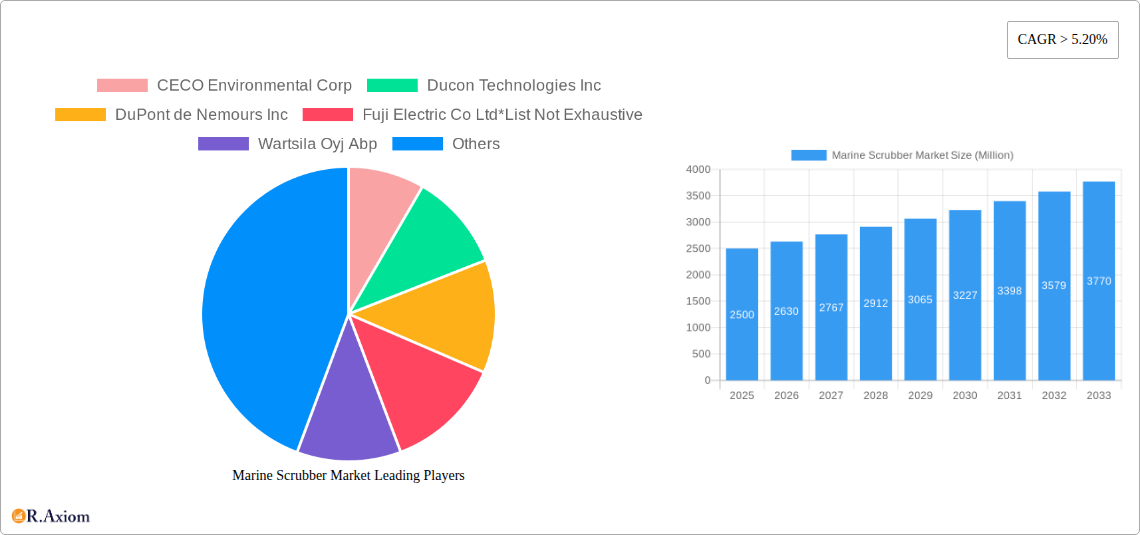
Marine Scrubber Market Company Market Share
Marine Scrubber Market: A Comprehensive Report (2019-2033)
This comprehensive report provides an in-depth analysis of the global Marine Scrubber Market, offering invaluable insights for industry stakeholders, investors, and researchers. The study covers the period from 2019 to 2033, with 2025 serving as the base and estimated year. The report meticulously examines market dynamics, segmentation, key players, and future growth prospects, providing a complete overview of this vital sector. The market is projected to reach xx Million by 2033, exhibiting a CAGR of xx% during the forecast period (2025-2033).
Marine Scrubber Market Market Concentration & Innovation
The Marine Scrubber market exhibits a moderately concentrated landscape, with several key players holding significant market share. The market share of the top five players is estimated at xx% in 2025. Innovation is driven by stringent environmental regulations, particularly the International Maritime Organization (IMO) 2020 sulfur cap. This has spurred significant R&D investments in developing more efficient and cost-effective scrubber technologies.
- Key Innovation Drivers: Improved energy efficiency, reduced maintenance costs, enhanced emission control capabilities, and integration of advanced monitoring systems.
- Regulatory Frameworks: IMO 2020 regulations are the primary driver, but regional variations in environmental policies also influence market dynamics.
- Product Substitutes: Alternative fuel sources (LNG, methanol) present a degree of substitution, but scrubbers remain a crucial technology for many vessels.
- End-User Trends: Growing preference for environmentally friendly shipping practices and increased awareness of environmental regulations are driving demand.
- M&A Activities: Consolidation in the market is expected to continue, with M&A activity driven by the need to expand product portfolios and market reach. The total value of M&A deals in the sector from 2019-2024 is estimated at xx Million.
Marine Scrubber Market Industry Trends & Insights
The global Marine Scrubber market is currently experiencing significant and sustained growth. This expansion is primarily fueled by stringent international regulations, most notably the International Maritime Organization's (IMO) 2020 sulfur cap, which mandates reduced sulfur oxide (SOx) emissions from vessels. Furthermore, a growing global consciousness and demand for environmentally responsible shipping practices are compelling stakeholders to adopt cleaner technologies. The industry is witnessing a pronounced trend towards the development and implementation of more sophisticated, efficient, and sustainable scrubber solutions designed to minimize the environmental impact of maritime operations.
Technological innovation is a cornerstone of this market evolution, with ongoing research and development focused on enhancing energy efficiency, optimizing operational expenditure (OPEX), and achieving greater emission reduction levels. These advancements aim to make scrubbers not only compliant but also cost-effective for vessel operators. Consumer and corporate preferences are increasingly leaning towards vessels and shipping companies committed to sustainable practices, influencing chartering decisions and the demand for eco-friendly logistics. The competitive landscape is characterized by robust rivalry between established global players and agile new entrants, fostering continuous innovation and driving competitive pricing. While penetration in the global shipping fleet is currently estimated at approximately XX%, the market holds substantial untapped potential, particularly in emerging economies and for the retrofitting of older vessels.
Dominant Markets & Segments in Marine Scrubber Market
The Marine segment dominates the end-user industry, owing to the stringent regulations imposed by the IMO. Asia-Pacific is projected as the leading regional market, fueled by robust growth in the shipping industry and a high concentration of shipbuilding activities.
- Key Drivers for Marine Segment Dominance: Stricter emission regulations, high vessel traffic, and substantial investment in new shipbuilding projects.
- Key Drivers for Asia-Pacific Regional Dominance: Rapid expansion of the shipping industry, increasing trade activities, and significant investments in port infrastructure.
- Wet Scrubbers vs. Dry Scrubbers: Wet scrubbers currently hold a larger market share due to their established technology and lower initial investment costs. However, dry scrubber adoption is growing due to advancements in technology and increasing focus on minimizing water usage.
Other significant segments include the Oil and Gas and Power Generation sectors which utilize scrubbers for emission control in their respective operations.
Marine Scrubber Market Product Developments
Recent product developments in the marine scrubber sector are marked by a strong emphasis on improving the efficacy and sustainability of existing technologies. Key areas of innovation include enhancing the removal efficiency of sulfur oxides (SOx) and particulate matter (PM), minimizing water consumption in wet scrubber systems, and optimizing wastewater discharge management. There is a significant drive towards integrating advanced, intelligent monitoring and control systems that allow for real-time operational adjustments, predictive maintenance, and enhanced performance tracking. The development of hybrid scrubber systems, which intelligently combine the benefits of both wet and dry scrubbing technologies, is also gaining traction. These hybrid solutions aim to offer a flexible and optimized approach to emission control, catering to diverse operational requirements and environmental regulations, while concurrently striving to reduce overall system costs and environmental footprints.
Report Scope & Segmentation Analysis
This comprehensive market analysis segments the Marine Scrubber market across several key dimensions to provide a granular understanding of its dynamics. The primary segmentation is based on technology type and end-user industry.
- Scrubber Type: The market is divided into Wet Scrubbers and Dry Scrubbers.
- Wet Scrubber: This category is anticipated to continue its market leadership, owing to its established maturity, proven performance, and widespread adoption. The projected market size for Wet Scrubbers in 2033 is estimated at XX Million USD.
- Dry Scrubber: This segment is experiencing accelerated growth, driven by ongoing technological refinements, a growing preference for systems that minimize water usage and wastewater generation, and their suitability for specific operational contexts. The projected market size for Dry Scrubbers in 2033 is estimated at XX Million USD.
- End-User Industries: The market is further analyzed based on its application across various sectors, including Marine, Oil and Gas, Power Generation, Pharmaceuticals, and Others.
- The Marine sector remains the dominant end-user, reflecting the direct impact of maritime emission regulations.
- The Oil and Gas and Power Generation sectors also represent significant markets due to their industrial emission control needs.
- Pharmaceuticals and other niche applications constitute smaller but developing segments.
Key Drivers of Marine Scrubber Market Growth
The Marine Scrubber market's growth is primarily driven by stringent environmental regulations, particularly the IMO 2020 sulfur cap, mandating significant reductions in sulfur emissions from ships. Furthermore, growing environmental awareness among shipping companies and consumers fuels demand for cleaner shipping practices. Technological advancements resulting in improved energy efficiency and reduced operational costs also contribute to market expansion.
Challenges in the Marine Scrubber Market Sector
Key challenges include the high initial investment cost associated with scrubber installation and maintenance, the complexities involved in regulatory compliance across various jurisdictions, and potential supply chain disruptions. Competition from alternative fuel technologies also poses a challenge to market growth. The impact of these challenges on market growth is estimated at xx% reduction in the overall CAGR.
Emerging Opportunities in Marine Scrubber Market
Emerging opportunities include the development of hybrid scrubber technologies combining wet and dry scrubbing methods, the integration of advanced monitoring and control systems, and expansion into new market segments, such as inland waterways and smaller vessels. The potential for leveraging digital technologies to improve operational efficiency and predictive maintenance is also promising.
Leading Players in the Marine Scrubber Market Market
- CECO Environmental Corp
- Ducon Technologies Inc
- DuPont de Nemours Inc
- Fuji Electric Co Ltd
- Wartsila Oyj Abp
- GEA Group AG
- Babcock & Wilcox Enterprises Inc
- Andritz AG
- Alfa Laval AB
- Thermax Ltd
Key Developments in Marine Scrubber Market Industry
The Marine Scrubber market is characterized by continuous strategic moves and product innovations aimed at enhancing market share and technological leadership. Notable recent developments include:
- 2022-Q4: Alfa Laval unveiled a new generation of marine scrubbers featuring significant improvements in energy efficiency and operational performance, catering to evolving industry demands.
- 2023-Q1: GEA Group AG announced a strategic partnership focused on expanding its footprint and scrubber technology offerings within the burgeoning Asian maritime sector.
- 2023-Q3: CECO Environmental Corp. bolstered its position in the market through the strategic acquisition of a specialized scrubber technology company, enhancing its product portfolio and market reach. (Additional significant developments and strategic initiatives are continuously being monitored and will be incorporated into future updates.)
Strategic Outlook for Marine Scrubber Market Market
The Marine Scrubber market is poised for continued growth, driven by ongoing environmental regulations and the increasing adoption of cleaner shipping practices. The focus on technological innovation, particularly in areas such as energy efficiency and reduced environmental impact, will be key to future success. Expansion into new markets and applications will also present significant opportunities for growth.
Marine Scrubber Market Segmentation
-
1. Type
- 1.1. Wet Scrubber
- 1.2. Dry Scrubber
-
2. End-user Industry
- 2.1. Oil and Gas
- 2.2. Power Generation
- 2.3. Marine
- 2.4. Pharmaceuticals
- 2.5. Others
Marine Scrubber Market Segmentation By Geography
- 1. North America
- 2. Europe
- 3. Asia Pacific
- 4. South America
- 5. Middle East and Africa
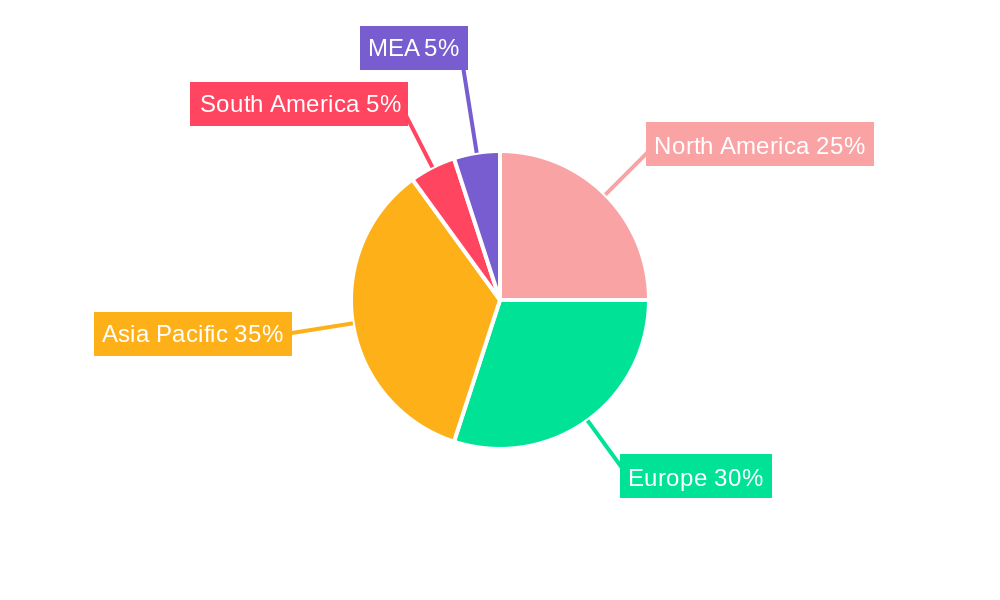
Marine Scrubber Market Regional Market Share
Geographic Coverage of Marine Scrubber Market
Marine Scrubber Market REPORT HIGHLIGHTS
| Aspects | Details |
|---|---|
| Study Period | 2020-2034 |
| Base Year | 2025 |
| Estimated Year | 2026 |
| Forecast Period | 2026-2034 |
| Historical Period | 2020-2025 |
| Growth Rate | CAGR of 16.3% from 2020-2034 |
| Segmentation |
|
Table of Contents
- 1. Introduction
- 1.1. Research Scope
- 1.2. Market Segmentation
- 1.3. Research Objective
- 1.4. Definitions and Assumptions
- 2. Executive Summary
- 2.1. Market Snapshot
- 3. Market Dynamics
- 3.1. Market Drivers
- 3.2. Market Restrains
- 3.3. Market Trends
- 3.4. Market Opportunities
- 4. Market Factor Analysis
- 4.1. Porters Five Forces
- 4.1.1. Bargaining Power of Suppliers
- 4.1.2. Bargaining Power of Buyers
- 4.1.3. Threat of New Entrants
- 4.1.4. Threat of Substitutes
- 4.1.5. Competitive Rivalry
- 4.2. PESTEL analysis
- 4.3. BCG Analysis
- 4.3.1. Stars (High Growth, High Market Share)
- 4.3.2. Cash Cows (Low Growth, High Market Share)
- 4.3.3. Question Mark (High Growth, Low Market Share)
- 4.3.4. Dogs (Low Growth, Low Market Share)
- 4.4. Ansoff Matrix Analysis
- 4.5. Supply Chain Analysis
- 4.6. Regulatory Landscape
- 4.7. Current Market Potential and Opportunity Assessment (TAM–SAM–SOM Framework)
- 4.8. RAX Analyst Note
- 4.1. Porters Five Forces
- 5. Market Analysis, Insights and Forecast 2021-2033
- 5.1. Market Analysis, Insights and Forecast - by Type
- 5.1.1. Wet Scrubber
- 5.1.2. Dry Scrubber
- 5.2. Market Analysis, Insights and Forecast - by End-user Industry
- 5.2.1. Oil and Gas
- 5.2.2. Power Generation
- 5.2.3. Marine
- 5.2.4. Pharmaceuticals
- 5.2.5. Others
- 5.3. Market Analysis, Insights and Forecast - by Region
- 5.3.1. North America
- 5.3.2. Europe
- 5.3.3. Asia Pacific
- 5.3.4. South America
- 5.3.5. Middle East and Africa
- 5.1. Market Analysis, Insights and Forecast - by Type
- 6. Global Marine Scrubber Market Analysis, Insights and Forecast, 2021-2033
- 6.1. Market Analysis, Insights and Forecast - by Type
- 6.1.1. Wet Scrubber
- 6.1.2. Dry Scrubber
- 6.2. Market Analysis, Insights and Forecast - by End-user Industry
- 6.2.1. Oil and Gas
- 6.2.2. Power Generation
- 6.2.3. Marine
- 6.2.4. Pharmaceuticals
- 6.2.5. Others
- 6.1. Market Analysis, Insights and Forecast - by Type
- 7. North America Marine Scrubber Market Analysis, Insights and Forecast, 2020-2032
- 7.1. Market Analysis, Insights and Forecast - by Type
- 7.1.1. Wet Scrubber
- 7.1.2. Dry Scrubber
- 7.2. Market Analysis, Insights and Forecast - by End-user Industry
- 7.2.1. Oil and Gas
- 7.2.2. Power Generation
- 7.2.3. Marine
- 7.2.4. Pharmaceuticals
- 7.2.5. Others
- 7.1. Market Analysis, Insights and Forecast - by Type
- 8. Europe Marine Scrubber Market Analysis, Insights and Forecast, 2020-2032
- 8.1. Market Analysis, Insights and Forecast - by Type
- 8.1.1. Wet Scrubber
- 8.1.2. Dry Scrubber
- 8.2. Market Analysis, Insights and Forecast - by End-user Industry
- 8.2.1. Oil and Gas
- 8.2.2. Power Generation
- 8.2.3. Marine
- 8.2.4. Pharmaceuticals
- 8.2.5. Others
- 8.1. Market Analysis, Insights and Forecast - by Type
- 9. Asia Pacific Marine Scrubber Market Analysis, Insights and Forecast, 2020-2032
- 9.1. Market Analysis, Insights and Forecast - by Type
- 9.1.1. Wet Scrubber
- 9.1.2. Dry Scrubber
- 9.2. Market Analysis, Insights and Forecast - by End-user Industry
- 9.2.1. Oil and Gas
- 9.2.2. Power Generation
- 9.2.3. Marine
- 9.2.4. Pharmaceuticals
- 9.2.5. Others
- 9.1. Market Analysis, Insights and Forecast - by Type
- 10. South America Marine Scrubber Market Analysis, Insights and Forecast, 2020-2032
- 10.1. Market Analysis, Insights and Forecast - by Type
- 10.1.1. Wet Scrubber
- 10.1.2. Dry Scrubber
- 10.2. Market Analysis, Insights and Forecast - by End-user Industry
- 10.2.1. Oil and Gas
- 10.2.2. Power Generation
- 10.2.3. Marine
- 10.2.4. Pharmaceuticals
- 10.2.5. Others
- 10.1. Market Analysis, Insights and Forecast - by Type
- 11. Middle East and Africa Marine Scrubber Market Analysis, Insights and Forecast, 2020-2032
- 11.1. Market Analysis, Insights and Forecast - by Type
- 11.1.1. Wet Scrubber
- 11.1.2. Dry Scrubber
- 11.2. Market Analysis, Insights and Forecast - by End-user Industry
- 11.2.1. Oil and Gas
- 11.2.2. Power Generation
- 11.2.3. Marine
- 11.2.4. Pharmaceuticals
- 11.2.5. Others
- 11.1. Market Analysis, Insights and Forecast - by Type
- 12. Competitive Analysis
- 12.1. Company Profiles
- 12.1.1 CECO Environmental Corp
- 12.1.1.1. Company Overview
- 12.1.1.2. Products
- 12.1.1.3. Company Financials
- 12.1.1.4. SWOT Analysis
- 12.1.2 Ducon Technologies Inc
- 12.1.2.1. Company Overview
- 12.1.2.2. Products
- 12.1.2.3. Company Financials
- 12.1.2.4. SWOT Analysis
- 12.1.3 DuPont de Nemours Inc
- 12.1.3.1. Company Overview
- 12.1.3.2. Products
- 12.1.3.3. Company Financials
- 12.1.3.4. SWOT Analysis
- 12.1.4 Fuji Electric Co Ltd*List Not Exhaustive
- 12.1.4.1. Company Overview
- 12.1.4.2. Products
- 12.1.4.3. Company Financials
- 12.1.4.4. SWOT Analysis
- 12.1.5 Wartsila Oyj Abp
- 12.1.5.1. Company Overview
- 12.1.5.2. Products
- 12.1.5.3. Company Financials
- 12.1.5.4. SWOT Analysis
- 12.1.6 GEA Group AG
- 12.1.6.1. Company Overview
- 12.1.6.2. Products
- 12.1.6.3. Company Financials
- 12.1.6.4. SWOT Analysis
- 12.1.7 Babcock & Wilcox Enterprises Inc
- 12.1.7.1. Company Overview
- 12.1.7.2. Products
- 12.1.7.3. Company Financials
- 12.1.7.4. SWOT Analysis
- 12.1.8 Andritz AG
- 12.1.8.1. Company Overview
- 12.1.8.2. Products
- 12.1.8.3. Company Financials
- 12.1.8.4. SWOT Analysis
- 12.1.9 Alfa Laval AB
- 12.1.9.1. Company Overview
- 12.1.9.2. Products
- 12.1.9.3. Company Financials
- 12.1.9.4. SWOT Analysis
- 12.1.10 Thermax Ltd
- 12.1.10.1. Company Overview
- 12.1.10.2. Products
- 12.1.10.3. Company Financials
- 12.1.10.4. SWOT Analysis
- 12.1.1 CECO Environmental Corp
- 12.2. Market Entropy
- 12.2.1 Company's Key Areas Served
- 12.2.2 Recent Developments
- 12.3. Company Market Share Analysis 2025
- 12.3.1 Top 5 Companies Market Share Analysis
- 12.3.2 Top 3 Companies Market Share Analysis
- 12.4. List of Potential Customers
- 13. Research Methodology
List of Figures
- Figure 1: Global Marine Scrubber Market Revenue Breakdown (billion, %) by Region 2025 & 2033
- Figure 2: Global Marine Scrubber Market Volume Breakdown (K Units, %) by Region 2025 & 2033
- Figure 3: North America Marine Scrubber Market Revenue (billion), by Type 2025 & 2033
- Figure 4: North America Marine Scrubber Market Volume (K Units), by Type 2025 & 2033
- Figure 5: North America Marine Scrubber Market Revenue Share (%), by Type 2025 & 2033
- Figure 6: North America Marine Scrubber Market Volume Share (%), by Type 2025 & 2033
- Figure 7: North America Marine Scrubber Market Revenue (billion), by End-user Industry 2025 & 2033
- Figure 8: North America Marine Scrubber Market Volume (K Units), by End-user Industry 2025 & 2033
- Figure 9: North America Marine Scrubber Market Revenue Share (%), by End-user Industry 2025 & 2033
- Figure 10: North America Marine Scrubber Market Volume Share (%), by End-user Industry 2025 & 2033
- Figure 11: North America Marine Scrubber Market Revenue (billion), by Country 2025 & 2033
- Figure 12: North America Marine Scrubber Market Volume (K Units), by Country 2025 & 2033
- Figure 13: North America Marine Scrubber Market Revenue Share (%), by Country 2025 & 2033
- Figure 14: North America Marine Scrubber Market Volume Share (%), by Country 2025 & 2033
- Figure 15: Europe Marine Scrubber Market Revenue (billion), by Type 2025 & 2033
- Figure 16: Europe Marine Scrubber Market Volume (K Units), by Type 2025 & 2033
- Figure 17: Europe Marine Scrubber Market Revenue Share (%), by Type 2025 & 2033
- Figure 18: Europe Marine Scrubber Market Volume Share (%), by Type 2025 & 2033
- Figure 19: Europe Marine Scrubber Market Revenue (billion), by End-user Industry 2025 & 2033
- Figure 20: Europe Marine Scrubber Market Volume (K Units), by End-user Industry 2025 & 2033
- Figure 21: Europe Marine Scrubber Market Revenue Share (%), by End-user Industry 2025 & 2033
- Figure 22: Europe Marine Scrubber Market Volume Share (%), by End-user Industry 2025 & 2033
- Figure 23: Europe Marine Scrubber Market Revenue (billion), by Country 2025 & 2033
- Figure 24: Europe Marine Scrubber Market Volume (K Units), by Country 2025 & 2033
- Figure 25: Europe Marine Scrubber Market Revenue Share (%), by Country 2025 & 2033
- Figure 26: Europe Marine Scrubber Market Volume Share (%), by Country 2025 & 2033
- Figure 27: Asia Pacific Marine Scrubber Market Revenue (billion), by Type 2025 & 2033
- Figure 28: Asia Pacific Marine Scrubber Market Volume (K Units), by Type 2025 & 2033
- Figure 29: Asia Pacific Marine Scrubber Market Revenue Share (%), by Type 2025 & 2033
- Figure 30: Asia Pacific Marine Scrubber Market Volume Share (%), by Type 2025 & 2033
- Figure 31: Asia Pacific Marine Scrubber Market Revenue (billion), by End-user Industry 2025 & 2033
- Figure 32: Asia Pacific Marine Scrubber Market Volume (K Units), by End-user Industry 2025 & 2033
- Figure 33: Asia Pacific Marine Scrubber Market Revenue Share (%), by End-user Industry 2025 & 2033
- Figure 34: Asia Pacific Marine Scrubber Market Volume Share (%), by End-user Industry 2025 & 2033
- Figure 35: Asia Pacific Marine Scrubber Market Revenue (billion), by Country 2025 & 2033
- Figure 36: Asia Pacific Marine Scrubber Market Volume (K Units), by Country 2025 & 2033
- Figure 37: Asia Pacific Marine Scrubber Market Revenue Share (%), by Country 2025 & 2033
- Figure 38: Asia Pacific Marine Scrubber Market Volume Share (%), by Country 2025 & 2033
- Figure 39: South America Marine Scrubber Market Revenue (billion), by Type 2025 & 2033
- Figure 40: South America Marine Scrubber Market Volume (K Units), by Type 2025 & 2033
- Figure 41: South America Marine Scrubber Market Revenue Share (%), by Type 2025 & 2033
- Figure 42: South America Marine Scrubber Market Volume Share (%), by Type 2025 & 2033
- Figure 43: South America Marine Scrubber Market Revenue (billion), by End-user Industry 2025 & 2033
- Figure 44: South America Marine Scrubber Market Volume (K Units), by End-user Industry 2025 & 2033
- Figure 45: South America Marine Scrubber Market Revenue Share (%), by End-user Industry 2025 & 2033
- Figure 46: South America Marine Scrubber Market Volume Share (%), by End-user Industry 2025 & 2033
- Figure 47: South America Marine Scrubber Market Revenue (billion), by Country 2025 & 2033
- Figure 48: South America Marine Scrubber Market Volume (K Units), by Country 2025 & 2033
- Figure 49: South America Marine Scrubber Market Revenue Share (%), by Country 2025 & 2033
- Figure 50: South America Marine Scrubber Market Volume Share (%), by Country 2025 & 2033
- Figure 51: Middle East and Africa Marine Scrubber Market Revenue (billion), by Type 2025 & 2033
- Figure 52: Middle East and Africa Marine Scrubber Market Volume (K Units), by Type 2025 & 2033
- Figure 53: Middle East and Africa Marine Scrubber Market Revenue Share (%), by Type 2025 & 2033
- Figure 54: Middle East and Africa Marine Scrubber Market Volume Share (%), by Type 2025 & 2033
- Figure 55: Middle East and Africa Marine Scrubber Market Revenue (billion), by End-user Industry 2025 & 2033
- Figure 56: Middle East and Africa Marine Scrubber Market Volume (K Units), by End-user Industry 2025 & 2033
- Figure 57: Middle East and Africa Marine Scrubber Market Revenue Share (%), by End-user Industry 2025 & 2033
- Figure 58: Middle East and Africa Marine Scrubber Market Volume Share (%), by End-user Industry 2025 & 2033
- Figure 59: Middle East and Africa Marine Scrubber Market Revenue (billion), by Country 2025 & 2033
- Figure 60: Middle East and Africa Marine Scrubber Market Volume (K Units), by Country 2025 & 2033
- Figure 61: Middle East and Africa Marine Scrubber Market Revenue Share (%), by Country 2025 & 2033
- Figure 62: Middle East and Africa Marine Scrubber Market Volume Share (%), by Country 2025 & 2033
List of Tables
- Table 1: Global Marine Scrubber Market Revenue billion Forecast, by Type 2020 & 2033
- Table 2: Global Marine Scrubber Market Volume K Units Forecast, by Type 2020 & 2033
- Table 3: Global Marine Scrubber Market Revenue billion Forecast, by End-user Industry 2020 & 2033
- Table 4: Global Marine Scrubber Market Volume K Units Forecast, by End-user Industry 2020 & 2033
- Table 5: Global Marine Scrubber Market Revenue billion Forecast, by Region 2020 & 2033
- Table 6: Global Marine Scrubber Market Volume K Units Forecast, by Region 2020 & 2033
- Table 7: Global Marine Scrubber Market Revenue billion Forecast, by Type 2020 & 2033
- Table 8: Global Marine Scrubber Market Volume K Units Forecast, by Type 2020 & 2033
- Table 9: Global Marine Scrubber Market Revenue billion Forecast, by End-user Industry 2020 & 2033
- Table 10: Global Marine Scrubber Market Volume K Units Forecast, by End-user Industry 2020 & 2033
- Table 11: Global Marine Scrubber Market Revenue billion Forecast, by Country 2020 & 2033
- Table 12: Global Marine Scrubber Market Volume K Units Forecast, by Country 2020 & 2033
- Table 13: Global Marine Scrubber Market Revenue billion Forecast, by Type 2020 & 2033
- Table 14: Global Marine Scrubber Market Volume K Units Forecast, by Type 2020 & 2033
- Table 15: Global Marine Scrubber Market Revenue billion Forecast, by End-user Industry 2020 & 2033
- Table 16: Global Marine Scrubber Market Volume K Units Forecast, by End-user Industry 2020 & 2033
- Table 17: Global Marine Scrubber Market Revenue billion Forecast, by Country 2020 & 2033
- Table 18: Global Marine Scrubber Market Volume K Units Forecast, by Country 2020 & 2033
- Table 19: Global Marine Scrubber Market Revenue billion Forecast, by Type 2020 & 2033
- Table 20: Global Marine Scrubber Market Volume K Units Forecast, by Type 2020 & 2033
- Table 21: Global Marine Scrubber Market Revenue billion Forecast, by End-user Industry 2020 & 2033
- Table 22: Global Marine Scrubber Market Volume K Units Forecast, by End-user Industry 2020 & 2033
- Table 23: Global Marine Scrubber Market Revenue billion Forecast, by Country 2020 & 2033
- Table 24: Global Marine Scrubber Market Volume K Units Forecast, by Country 2020 & 2033
- Table 25: Global Marine Scrubber Market Revenue billion Forecast, by Type 2020 & 2033
- Table 26: Global Marine Scrubber Market Volume K Units Forecast, by Type 2020 & 2033
- Table 27: Global Marine Scrubber Market Revenue billion Forecast, by End-user Industry 2020 & 2033
- Table 28: Global Marine Scrubber Market Volume K Units Forecast, by End-user Industry 2020 & 2033
- Table 29: Global Marine Scrubber Market Revenue billion Forecast, by Country 2020 & 2033
- Table 30: Global Marine Scrubber Market Volume K Units Forecast, by Country 2020 & 2033
- Table 31: Global Marine Scrubber Market Revenue billion Forecast, by Type 2020 & 2033
- Table 32: Global Marine Scrubber Market Volume K Units Forecast, by Type 2020 & 2033
- Table 33: Global Marine Scrubber Market Revenue billion Forecast, by End-user Industry 2020 & 2033
- Table 34: Global Marine Scrubber Market Volume K Units Forecast, by End-user Industry 2020 & 2033
- Table 35: Global Marine Scrubber Market Revenue billion Forecast, by Country 2020 & 2033
- Table 36: Global Marine Scrubber Market Volume K Units Forecast, by Country 2020 & 2033
Frequently Asked Questions
1. What is the projected Compound Annual Growth Rate (CAGR) of the Marine Scrubber Market?
The projected CAGR is approximately 16.3%.
2. Which companies are prominent players in the Marine Scrubber Market?
Key companies in the market include CECO Environmental Corp, Ducon Technologies Inc, DuPont de Nemours Inc, Fuji Electric Co Ltd*List Not Exhaustive, Wartsila Oyj Abp, GEA Group AG, Babcock & Wilcox Enterprises Inc, Andritz AG, Alfa Laval AB, Thermax Ltd.
3. What are the main segments of the Marine Scrubber Market?
The market segments include Type, End-user Industry.
4. Can you provide details about the market size?
The market size is estimated to be USD 8.65 billion as of 2022.
5. What are some drivers contributing to market growth?
4.; The High Amount of Waste Generation in the Country4.; The growing Focus on Non-Fossil Fuel Sources.
6. What are the notable trends driving market growth?
Cement Industry to Witness the Fastest Growth.
7. Are there any restraints impacting market growth?
4.; The Recycling Rate of Waste in Germany.
8. Can you provide examples of recent developments in the market?
N/A
9. What pricing options are available for accessing the report?
Pricing options include single-user, multi-user, and enterprise licenses priced at USD 4750, USD 5250, and USD 8750 respectively.
10. Is the market size provided in terms of value or volume?
The market size is provided in terms of value, measured in billion and volume, measured in K Units.
11. Are there any specific market keywords associated with the report?
Yes, the market keyword associated with the report is "Marine Scrubber Market," which aids in identifying and referencing the specific market segment covered.
12. How do I determine which pricing option suits my needs best?
The pricing options vary based on user requirements and access needs. Individual users may opt for single-user licenses, while businesses requiring broader access may choose multi-user or enterprise licenses for cost-effective access to the report.
13. Are there any additional resources or data provided in the Marine Scrubber Market report?
While the report offers comprehensive insights, it's advisable to review the specific contents or supplementary materials provided to ascertain if additional resources or data are available.
14. How can I stay updated on further developments or reports in the Marine Scrubber Market?
To stay informed about further developments, trends, and reports in the Marine Scrubber Market, consider subscribing to industry newsletters, following relevant companies and organizations, or regularly checking reputable industry news sources and publications.
Methodology
Step 1 - Identification of Relevant Samples Size from Population Database


Step 2 - Approaches for Defining Global Market Size (Value, Volume* & Price*)

Note*: In applicable scenarios
Step 3 - Data Sources
Primary Research
- Web Analytics
- Survey Reports
- Research Institute
- Latest Research Reports
- Opinion Leaders
Secondary Research
- Annual Reports
- White Paper
- Latest Press Release
- Industry Association
- Paid Database
- Investor Presentations

Step 4 - Data Triangulation
Involves using different sources of information in order to increase the validity of a study
These sources are likely to be stakeholders in a program - participants, other researchers, program staff, other community members, and so on.
Then we put all data in single framework & apply various statistical tools to find out the dynamic on the market.
During the analysis stage, feedback from the stakeholder groups would be compared to determine areas of agreement as well as areas of divergence