Key Insights
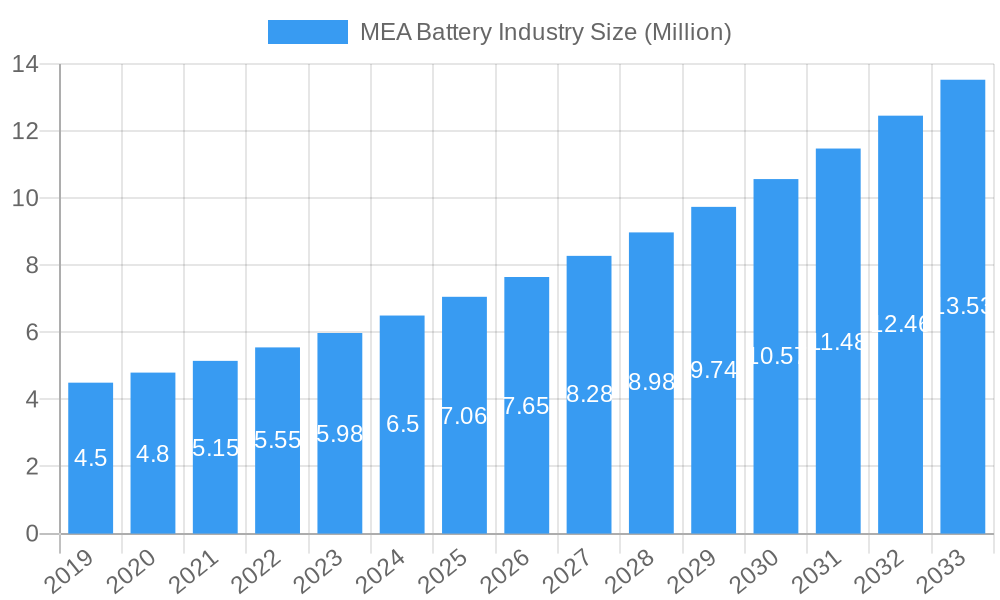
The Middle East and Africa (MEA) battery market is poised for robust expansion, projected to surpass USD 7.06 million by 2025, with an impressive Compound Annual Growth Rate (CAGR) exceeding 7.00% through the forecast period of 2025-2033. This growth is primarily propelled by escalating demand across key sectors, including the automotive industry, driven by increasing vehicle production and the nascent but growing adoption of electric vehicles (EVs) in the region. Industrial applications, encompassing energy storage solutions for renewable energy projects, grid stabilization, and backup power for critical infrastructure, are also significant contributors. Furthermore, the burgeoning consumer electronics market, with its insatiable appetite for portable power, further fuels market expansion. The rise of lithium-ion batteries, owing to their superior energy density and longer lifespan, is a dominant technological trend, gradually displacing traditional lead-acid batteries in many applications.
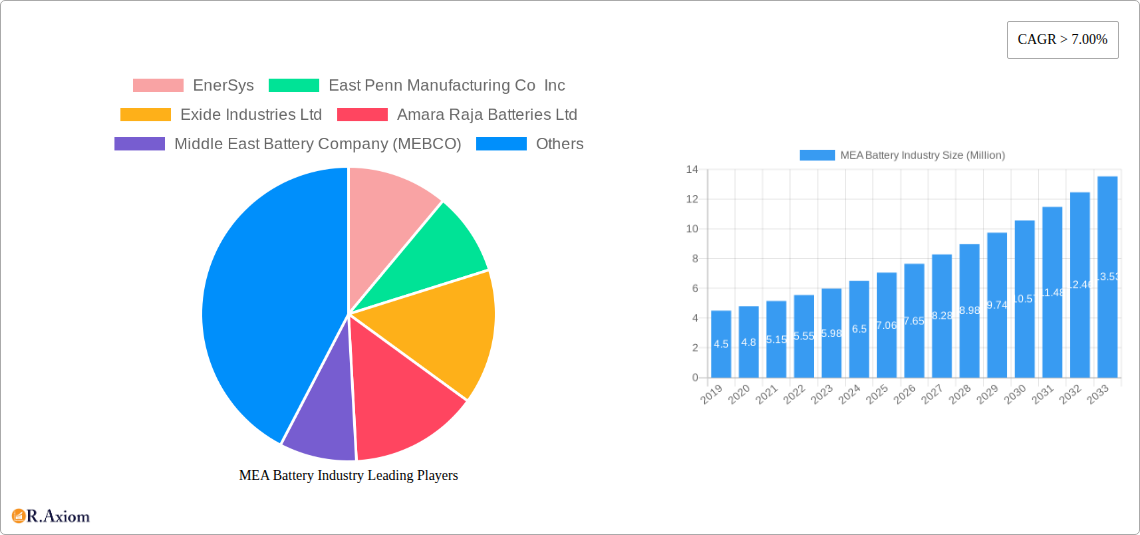
MEA Battery Industry Market Size (In Million)
While the MEA battery market exhibits strong growth potential, several factors warrant attention. The increasing emphasis on renewable energy integration, particularly solar power in regions like Saudi Arabia and the UAE, necessitates advanced battery storage solutions, presenting a substantial opportunity. However, challenges such as the high initial cost of advanced battery technologies, particularly lithium-ion, and the underdeveloped recycling infrastructure in some parts of the MEA region could temper the growth trajectory. Additionally, geopolitical stability and evolving regulatory frameworks across diverse African nations will play a crucial role in shaping investment and market penetration. Saudi Arabia and the UAE are expected to lead the market in terms of value, driven by ambitious infrastructure projects and economic diversification initiatives. South Africa, with its established industrial base and mining sector, also represents a significant market.
MEA Battery Industry Company Market Share
This comprehensive report provides an in-depth analysis of the Middle East and Africa (MEA) Battery Industry. It delves into market dynamics, key trends, dominant segments, product innovations, strategic outlooks, and competitive landscapes for the period 2019–2033, with a base and estimated year of 2025 and a forecast period of 2025–2033. This report is essential for stakeholders seeking to understand the evolving MEA battery market, from primary and secondary batteries to advanced lithium-ion and lead-acid technologies powering automotive, industrial, and portable applications across Saudi Arabia, the United Arab Emirates, South Africa, and the wider MEA region.
MEA Battery Industry Market Concentration & Innovation
The MEA battery industry exhibits a moderate market concentration, with established global players and significant regional manufacturers vying for market share. Key companies like EnerSys, East Penn Manufacturing Co Inc, Exide Industries Ltd, Amara Raja Batteries Ltd, Middle East Battery Company (MEBCO), C&D Technologies Inc, First National Battery Pty Ltd, SAFT GROUPE SA, and Panasonic Corporation are actively shaping the market through continuous innovation and strategic investments. Innovation is primarily driven by the increasing demand for energy storage solutions in the rapidly expanding automotive sector, particularly electric vehicles (EVs), and the growing need for reliable power in industrial applications. Regulatory frameworks are evolving to support the adoption of cleaner energy technologies and battery recycling initiatives. Product substitutes, such as alternative energy sources, pose a minor threat, as battery technology remains critical for energy storage. End-user trends are strongly influenced by the push for electrification and sustainability, driving demand for higher energy density and longer-lasting batteries. Mergers and acquisition (M&A) activities, while not extensively documented with specific values for this region, are anticipated to increase as companies seek to consolidate their market positions and acquire technological expertise. The M&A deal values for the MEA region are estimated to be in the hundreds of millions of dollars.
MEA Battery Industry Industry Trends & Insights
The MEA battery industry is poised for substantial growth, driven by a confluence of factors that are reshaping its landscape. A primary growth driver is the escalating adoption of electric vehicles (EVs) across the region, fueled by supportive government initiatives, increasing consumer awareness of environmental concerns, and declining battery costs. For instance, Saudi Arabia's Ministry of Investment signed a USD 5.6 billion deal with Chinese electric car maker Human Horizons in June 2023 to collaborate on the development, manufacture, and sale of vehicles, signaling a significant investment in the EV ecosystem. This surge in EV penetration directly translates to an increased demand for advanced secondary batteries, particularly lithium-ion variants. Technological disruptions are at the forefront, with continuous advancements in battery chemistries, energy density, charging speeds, and safety features. The report forecasts a Compound Annual Growth Rate (CAGR) of approximately 12% for the MEA battery market during the forecast period. Consumer preferences are shifting towards batteries that offer longer lifespans, faster charging capabilities, and enhanced safety, aligning with the evolving needs of both consumer electronics and automotive applications. Competitive dynamics are intensifying, with both global and local players investing heavily in research and development to gain a competitive edge. The market penetration of lithium-ion batteries is expected to rise significantly, especially in the automotive and portable electronics segments, while lead-acid batteries will continue to dominate in industrial backup power and automotive starter applications due to their cost-effectiveness and proven reliability. The increasing focus on renewable energy integration and grid stability further propels the demand for industrial battery storage solutions.
Dominant Markets & Segments in MEA Battery Industry
The MEA battery industry exhibits distinct dominance across various segments, driven by specific economic policies, infrastructure development, and evolving consumer needs.
Dominant Geography: South Africa currently leads as a dominant market within the MEA region. This is attributed to its relatively more developed automotive industry, existing infrastructure for battery production and distribution, and early adoption of renewable energy projects that require significant energy storage solutions. Saudi Arabia and the United Arab Emirates are rapidly emerging as key growth hubs, fueled by massive investments in smart city projects, ambitious EV adoption targets, and government incentives aimed at fostering local manufacturing and technological development. For example, Saudi Arabia's Ministry of Investment's USD 5.6 billion deal with Human Horizons highlights its commitment to the electric vehicle sector.
Dominant Segment (Type): Secondary Batteries hold a commanding position in the MEA battery market. This dominance is primarily propelled by their widespread application in rechargeable devices, electric vehicles, and grid-scale energy storage systems. The increasing demand for sustainable and reusable energy solutions directly benefits this segment.
Dominant Segment (Technology): Lead-acid Batteries continue to be a dominant technology, especially in the automotive sector for starter batteries and in industrial applications for backup power and uninterruptible power supplies (UPS). Their cost-effectiveness, reliability, and established recycling infrastructure make them a preferred choice for many applications. However, Lithium-ion Batteries are experiencing rapid growth and are projected to surpass lead-acid in certain high-growth segments like electric vehicles and portable electronics due to their superior energy density, lighter weight, and longer cycle life. The forecast indicates a significant surge in the market share of lithium-ion technology within the next decade.
Dominant Segment (Application): Automotive Batteries represent the largest and most influential application segment within the MEA battery industry. This is driven by both the conventional internal combustion engine vehicle market (requiring starter batteries) and the rapidly expanding electric vehicle market, which necessitates advanced battery packs. Industrial applications, including backup power for telecommunications, data centers, and manufacturing facilities, constitute another significant and growing segment. Portable Batteries for consumer electronics also contribute substantially to market demand.
MEA Battery Industry Product Developments
The MEA battery industry is witnessing a wave of product innovations focused on enhancing energy density, improving charging speeds, extending lifespan, and ensuring greater safety. Companies are developing next-generation lithium-ion battery chemistries, such as solid-state batteries, promising significant breakthroughs in performance and safety. Advances in battery management systems (BMS) are also crucial, optimizing performance and longevity. For automotive applications, the trend is towards higher voltage battery architectures for faster charging and increased range. In industrial settings, innovations are geared towards modular battery systems for scalable energy storage and improved thermal management for reliable operation in diverse environmental conditions. These developments offer competitive advantages by meeting the growing demand for more efficient, sustainable, and powerful energy storage solutions across various sectors.
Report Scope & Segmentation Analysis
This report meticulously segments the MEA Battery Industry by Type into Primary Battery and Secondary Battery. Primary batteries, while a smaller segment, cater to niche applications requiring long shelf life and infrequent use. Secondary batteries, expected to witness a robust CAGR of 13% within the forecast period, dominate due to their rechargeability and are crucial for EVs and renewable energy storage.
The technology segmentation covers Lead-acid Battery, Lithium-ion Battery, Nickel-metal Hydride (NiMH) Battery, and Other Technologies. Lead-acid batteries, though mature, will maintain a strong presence in automotive and industrial UPS, while Lithium-ion batteries are projected to capture increasing market share, driven by EV growth with a projected market size of over $4 billion by 2033. NiMH batteries will cater to specific consumer electronics and hybrid applications.
Application segmentation includes Automotive Batteries, Industrial, Portable Batteries (Consumer Electronics, etc.), and Other Applications. Automotive batteries will remain the largest segment, propelled by EV adoption, with an estimated market size exceeding $5 billion by 2033. Industrial applications will see steady growth driven by infrastructure development, and portable batteries will continue to be a significant contributor, supported by the proliferation of smart devices.
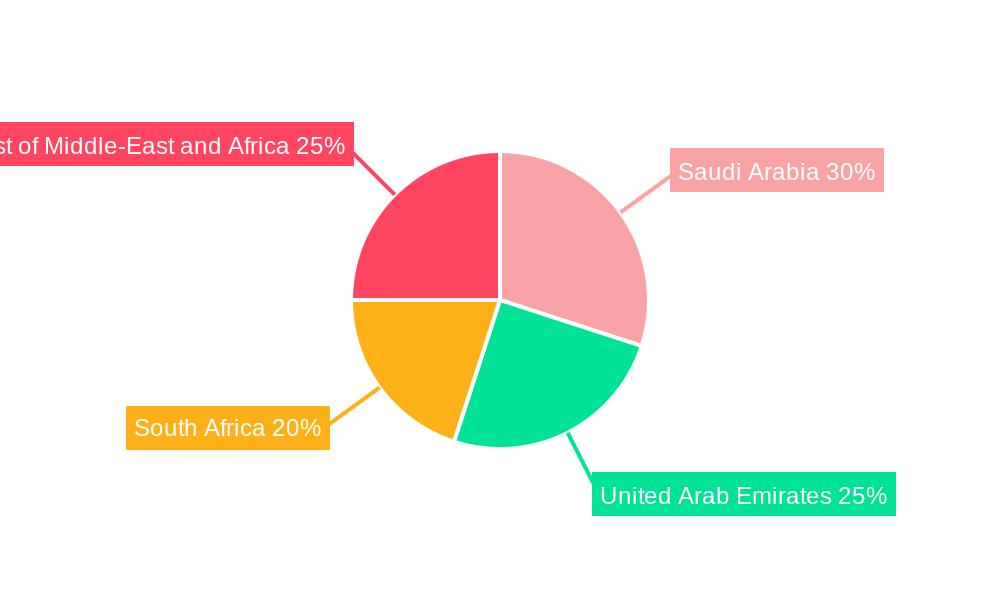
Geographical segmentation encompasses Saudi Arabia, United Arab Emirates, South Africa, and the Rest of Middle-East and Africa. South Africa currently holds a significant market share, but Saudi Arabia and the UAE are anticipated to exhibit higher growth rates due to substantial investments in electrification and renewable energy initiatives. The Rest of MEA region presents emerging opportunities as infrastructure development progresses.
Key Drivers of MEA Battery Industry Growth
The MEA battery industry's growth is primarily propelled by the accelerating adoption of electric vehicles across the region. Supportive government policies, including subsidies and tax incentives for EV purchases and manufacturing, are crucial catalysts. The increasing demand for renewable energy integration and grid stabilization further fuels the market for industrial battery storage solutions. Technological advancements leading to improved battery performance, reduced costs, and enhanced safety are also significant drivers. Economic development and urbanization across the MEA region contribute to increased demand for reliable power backup systems and consumer electronics, thereby boosting the portable battery segment.
Challenges in the MEA Battery Industry Sector
Despite its promising growth trajectory, the MEA battery industry faces several challenges. High initial investment costs for battery manufacturing facilities and advanced research and development can be a significant barrier. Dependence on imported raw materials for battery production, such as lithium and cobalt, exposes the supply chain to price volatility and geopolitical risks. The absence of widespread, standardized battery recycling infrastructure across many MEA countries poses environmental and economic challenges. Furthermore, regulatory frameworks related to battery disposal and safety standards are still evolving in some parts of the region, creating uncertainty for manufacturers and consumers. Intense price competition, particularly for mature technologies like lead-acid batteries, also exerts pressure on profit margins.
Emerging Opportunities in MEA Battery Industry
The MEA battery industry presents numerous emerging opportunities. The burgeoning electric vehicle market across the region, particularly in countries like Saudi Arabia and the UAE, offers significant potential for battery manufacturers and suppliers. The increasing investment in renewable energy projects, such as solar and wind farms, is driving demand for large-scale energy storage systems. The development of localized battery manufacturing capabilities within the MEA region, supported by government initiatives, presents an opportunity for job creation and economic diversification. Advancements in battery recycling technologies and the establishment of circular economy models offer avenues for sustainable growth and resource optimization. The expanding adoption of smart grids and the growing demand for reliable backup power solutions for telecommunications and data centers also represent lucrative opportunities.
Leading Players in the MEA Battery Industry Market
- EnerSys
- East Penn Manufacturing Co Inc
- Exide Industries Ltd
- Amara Raja Batteries Ltd
- Middle East Battery Company (MEBCO)
- C&D Technologies Inc
- First National Battery Pty Ltd
- SAFT GROUPE SA
- Panasonic Corporation
Key Developments in MEA Battery Industry Industry
- Aug 2023: Mahindra & Mahindra, India's fourth largest car manufacturer, unveiled the electric version of the Thar SUV at an event in South Africa. Apart from the Thar.e, Mahindra also unveiled seven new tractor models at the event in Cape Town, South Africa.
- Jun 2023: Saudi Arabia's Ministry of Investment signed a USD 5.6 billion deal with Chinese electric car maker Human Horizons to collaborate on the development, manufacture, and sale of vehicles.
Strategic Outlook for MEA Battery Industry Market
The strategic outlook for the MEA battery industry is overwhelmingly positive, driven by robust market growth catalysts and a conducive investment environment. The region's commitment to diversifying its energy sources and embracing electrification provides a fertile ground for battery technologies. Strategic partnerships between international battery manufacturers and local entities will be crucial for knowledge transfer, localized production, and market penetration. Investments in research and development to align battery solutions with regional climatic conditions and consumer needs will be a key differentiator. The ongoing development of robust charging infrastructure for EVs and the expansion of smart grid technologies will further accelerate demand. The industry is expected to witness significant technological advancements, leading to more efficient, sustainable, and cost-effective battery solutions, positioning the MEA region as a significant player in the global energy storage landscape.
MEA Battery Industry Segmentation
-
1. Type
- 1.1. Primary Battery
- 1.2. Secondary Battery
-
2. Technology
- 2.1. Lead-acid Battery
- 2.2. Lithium-ion Battery
- 2.3. Nickel-metal Hydride (NiMH) Battery
- 2.4. Other Te
-
3. Application
- 3.1. Automotive Batteries
- 3.2. Industri
- 3.3. Portable Batteries (Consumer Electronics, etc.)
- 3.4. Other Applications
-
4. Geography
- 4.1. Saudi Arabia
- 4.2. United Arab Emirates
- 4.3. South Africa
- 4.4. Rest of Middle-East and Africa
MEA Battery Industry Segmentation By Geography
- 1. Saudi Arabia
- 2. United Arab Emirates
- 3. South Africa
- 4. Rest of Middle East and Africa
MEA Battery Industry Regional Market Share
Geographic Coverage of MEA Battery Industry
MEA Battery Industry REPORT HIGHLIGHTS
| Aspects | Details |
|---|---|
| Study Period | 2020-2034 |
| Base Year | 2025 |
| Estimated Year | 2026 |
| Forecast Period | 2026-2034 |
| Historical Period | 2020-2025 |
| Growth Rate | CAGR of > 7.00% from 2020-2034 |
| Segmentation |
|
Table of Contents
- 1. Introduction
- 1.1. Research Scope
- 1.2. Market Segmentation
- 1.3. Research Objective
- 1.4. Definitions and Assumptions
- 2. Executive Summary
- 2.1. Market Snapshot
- 3. Market Dynamics
- 3.1. Market Drivers
- 3.2. Market Restrains
- 3.3. Market Trends
- 3.4. Market Opportunities
- 4. Market Factor Analysis
- 4.1. Porters Five Forces
- 4.1.1. Bargaining Power of Suppliers
- 4.1.2. Bargaining Power of Buyers
- 4.1.3. Threat of New Entrants
- 4.1.4. Threat of Substitutes
- 4.1.5. Competitive Rivalry
- 4.2. PESTEL analysis
- 4.3. BCG Analysis
- 4.3.1. Stars (High Growth, High Market Share)
- 4.3.2. Cash Cows (Low Growth, High Market Share)
- 4.3.3. Question Mark (High Growth, Low Market Share)
- 4.3.4. Dogs (Low Growth, Low Market Share)
- 4.4. Ansoff Matrix Analysis
- 4.5. Supply Chain Analysis
- 4.6. Regulatory Landscape
- 4.7. Current Market Potential and Opportunity Assessment (TAM–SAM–SOM Framework)
- 4.8. RAX Analyst Note
- 4.1. Porters Five Forces
- 5. Market Analysis, Insights and Forecast 2021-2033
- 5.1. Market Analysis, Insights and Forecast - by Type
- 5.1.1. Primary Battery
- 5.1.2. Secondary Battery
- 5.2. Market Analysis, Insights and Forecast - by Technology
- 5.2.1. Lead-acid Battery
- 5.2.2. Lithium-ion Battery
- 5.2.3. Nickel-metal Hydride (NiMH) Battery
- 5.2.4. Other Te
- 5.3. Market Analysis, Insights and Forecast - by Application
- 5.3.1. Automotive Batteries
- 5.3.2. Industri
- 5.3.3. Portable Batteries (Consumer Electronics, etc.)
- 5.3.4. Other Applications
- 5.4. Market Analysis, Insights and Forecast - by Geography
- 5.4.1. Saudi Arabia
- 5.4.2. United Arab Emirates
- 5.4.3. South Africa
- 5.4.4. Rest of Middle-East and Africa
- 5.5. Market Analysis, Insights and Forecast - by Region
- 5.5.1. Saudi Arabia
- 5.5.2. United Arab Emirates
- 5.5.3. South Africa
- 5.5.4. Rest of Middle East and Africa
- 5.1. Market Analysis, Insights and Forecast - by Type
- 6. Global MEA Battery Industry Analysis, Insights and Forecast, 2021-2033
- 6.1. Market Analysis, Insights and Forecast - by Type
- 6.1.1. Primary Battery
- 6.1.2. Secondary Battery
- 6.2. Market Analysis, Insights and Forecast - by Technology
- 6.2.1. Lead-acid Battery
- 6.2.2. Lithium-ion Battery
- 6.2.3. Nickel-metal Hydride (NiMH) Battery
- 6.2.4. Other Te
- 6.3. Market Analysis, Insights and Forecast - by Application
- 6.3.1. Automotive Batteries
- 6.3.2. Industri
- 6.3.3. Portable Batteries (Consumer Electronics, etc.)
- 6.3.4. Other Applications
- 6.4. Market Analysis, Insights and Forecast - by Geography
- 6.4.1. Saudi Arabia
- 6.4.2. United Arab Emirates
- 6.4.3. South Africa
- 6.4.4. Rest of Middle-East and Africa
- 6.1. Market Analysis, Insights and Forecast - by Type
- 7. Saudi Arabia MEA Battery Industry Analysis, Insights and Forecast, 2020-2032
- 7.1. Market Analysis, Insights and Forecast - by Type
- 7.1.1. Primary Battery
- 7.1.2. Secondary Battery
- 7.2. Market Analysis, Insights and Forecast - by Technology
- 7.2.1. Lead-acid Battery
- 7.2.2. Lithium-ion Battery
- 7.2.3. Nickel-metal Hydride (NiMH) Battery
- 7.2.4. Other Te
- 7.3. Market Analysis, Insights and Forecast - by Application
- 7.3.1. Automotive Batteries
- 7.3.2. Industri
- 7.3.3. Portable Batteries (Consumer Electronics, etc.)
- 7.3.4. Other Applications
- 7.4. Market Analysis, Insights and Forecast - by Geography
- 7.4.1. Saudi Arabia
- 7.4.2. United Arab Emirates
- 7.4.3. South Africa
- 7.4.4. Rest of Middle-East and Africa
- 7.1. Market Analysis, Insights and Forecast - by Type
- 8. United Arab Emirates MEA Battery Industry Analysis, Insights and Forecast, 2020-2032
- 8.1. Market Analysis, Insights and Forecast - by Type
- 8.1.1. Primary Battery
- 8.1.2. Secondary Battery
- 8.2. Market Analysis, Insights and Forecast - by Technology
- 8.2.1. Lead-acid Battery
- 8.2.2. Lithium-ion Battery
- 8.2.3. Nickel-metal Hydride (NiMH) Battery
- 8.2.4. Other Te
- 8.3. Market Analysis, Insights and Forecast - by Application
- 8.3.1. Automotive Batteries
- 8.3.2. Industri
- 8.3.3. Portable Batteries (Consumer Electronics, etc.)
- 8.3.4. Other Applications
- 8.4. Market Analysis, Insights and Forecast - by Geography
- 8.4.1. Saudi Arabia
- 8.4.2. United Arab Emirates
- 8.4.3. South Africa
- 8.4.4. Rest of Middle-East and Africa
- 8.1. Market Analysis, Insights and Forecast - by Type
- 9. South Africa MEA Battery Industry Analysis, Insights and Forecast, 2020-2032
- 9.1. Market Analysis, Insights and Forecast - by Type
- 9.1.1. Primary Battery
- 9.1.2. Secondary Battery
- 9.2. Market Analysis, Insights and Forecast - by Technology
- 9.2.1. Lead-acid Battery
- 9.2.2. Lithium-ion Battery
- 9.2.3. Nickel-metal Hydride (NiMH) Battery
- 9.2.4. Other Te
- 9.3. Market Analysis, Insights and Forecast - by Application
- 9.3.1. Automotive Batteries
- 9.3.2. Industri
- 9.3.3. Portable Batteries (Consumer Electronics, etc.)
- 9.3.4. Other Applications
- 9.4. Market Analysis, Insights and Forecast - by Geography
- 9.4.1. Saudi Arabia
- 9.4.2. United Arab Emirates
- 9.4.3. South Africa
- 9.4.4. Rest of Middle-East and Africa
- 9.1. Market Analysis, Insights and Forecast - by Type
- 10. Rest of Middle East and Africa MEA Battery Industry Analysis, Insights and Forecast, 2020-2032
- 10.1. Market Analysis, Insights and Forecast - by Type
- 10.1.1. Primary Battery
- 10.1.2. Secondary Battery
- 10.2. Market Analysis, Insights and Forecast - by Technology
- 10.2.1. Lead-acid Battery
- 10.2.2. Lithium-ion Battery
- 10.2.3. Nickel-metal Hydride (NiMH) Battery
- 10.2.4. Other Te
- 10.3. Market Analysis, Insights and Forecast - by Application
- 10.3.1. Automotive Batteries
- 10.3.2. Industri
- 10.3.3. Portable Batteries (Consumer Electronics, etc.)
- 10.3.4. Other Applications
- 10.4. Market Analysis, Insights and Forecast - by Geography
- 10.4.1. Saudi Arabia
- 10.4.2. United Arab Emirates
- 10.4.3. South Africa
- 10.4.4. Rest of Middle-East and Africa
- 10.1. Market Analysis, Insights and Forecast - by Type
- 11. Competitive Analysis
- 11.1. Company Profiles
- 11.1.1 EnerSys
- 11.1.1.1. Company Overview
- 11.1.1.2. Products
- 11.1.1.3. Company Financials
- 11.1.1.4. SWOT Analysis
- 11.1.2 East Penn Manufacturing Co Inc
- 11.1.2.1. Company Overview
- 11.1.2.2. Products
- 11.1.2.3. Company Financials
- 11.1.2.4. SWOT Analysis
- 11.1.3 Exide Industries Ltd
- 11.1.3.1. Company Overview
- 11.1.3.2. Products
- 11.1.3.3. Company Financials
- 11.1.3.4. SWOT Analysis
- 11.1.4 Amara Raja Batteries Ltd
- 11.1.4.1. Company Overview
- 11.1.4.2. Products
- 11.1.4.3. Company Financials
- 11.1.4.4. SWOT Analysis
- 11.1.5 Middle East Battery Company (MEBCO)
- 11.1.5.1. Company Overview
- 11.1.5.2. Products
- 11.1.5.3. Company Financials
- 11.1.5.4. SWOT Analysis
- 11.1.6 C&D Technologies Inc
- 11.1.6.1. Company Overview
- 11.1.6.2. Products
- 11.1.6.3. Company Financials
- 11.1.6.4. SWOT Analysis
- 11.1.7 First National Battery Pty Ltd
- 11.1.7.1. Company Overview
- 11.1.7.2. Products
- 11.1.7.3. Company Financials
- 11.1.7.4. SWOT Analysis
- 11.1.8 SAFT GROUPE SA
- 11.1.8.1. Company Overview
- 11.1.8.2. Products
- 11.1.8.3. Company Financials
- 11.1.8.4. SWOT Analysis
- 11.1.9 Panasonic Corporation
- 11.1.9.1. Company Overview
- 11.1.9.2. Products
- 11.1.9.3. Company Financials
- 11.1.9.4. SWOT Analysis
- 11.1.1 EnerSys
- 11.2. Market Entropy
- 11.2.1 Company's Key Areas Served
- 11.2.2 Recent Developments
- 11.3. Company Market Share Analysis 2025
- 11.3.1 Top 5 Companies Market Share Analysis
- 11.3.2 Top 3 Companies Market Share Analysis
- 11.4. List of Potential Customers
- 12. Research Methodology
List of Figures
- Figure 1: Global MEA Battery Industry Revenue Breakdown (Million, %) by Region 2025 & 2033
- Figure 2: Global MEA Battery Industry Volume Breakdown (K Unit, %) by Region 2025 & 2033
- Figure 3: Saudi Arabia MEA Battery Industry Revenue (Million), by Type 2025 & 2033
- Figure 4: Saudi Arabia MEA Battery Industry Volume (K Unit), by Type 2025 & 2033
- Figure 5: Saudi Arabia MEA Battery Industry Revenue Share (%), by Type 2025 & 2033
- Figure 6: Saudi Arabia MEA Battery Industry Volume Share (%), by Type 2025 & 2033
- Figure 7: Saudi Arabia MEA Battery Industry Revenue (Million), by Technology 2025 & 2033
- Figure 8: Saudi Arabia MEA Battery Industry Volume (K Unit), by Technology 2025 & 2033
- Figure 9: Saudi Arabia MEA Battery Industry Revenue Share (%), by Technology 2025 & 2033
- Figure 10: Saudi Arabia MEA Battery Industry Volume Share (%), by Technology 2025 & 2033
- Figure 11: Saudi Arabia MEA Battery Industry Revenue (Million), by Application 2025 & 2033
- Figure 12: Saudi Arabia MEA Battery Industry Volume (K Unit), by Application 2025 & 2033
- Figure 13: Saudi Arabia MEA Battery Industry Revenue Share (%), by Application 2025 & 2033
- Figure 14: Saudi Arabia MEA Battery Industry Volume Share (%), by Application 2025 & 2033
- Figure 15: Saudi Arabia MEA Battery Industry Revenue (Million), by Geography 2025 & 2033
- Figure 16: Saudi Arabia MEA Battery Industry Volume (K Unit), by Geography 2025 & 2033
- Figure 17: Saudi Arabia MEA Battery Industry Revenue Share (%), by Geography 2025 & 2033
- Figure 18: Saudi Arabia MEA Battery Industry Volume Share (%), by Geography 2025 & 2033
- Figure 19: Saudi Arabia MEA Battery Industry Revenue (Million), by Country 2025 & 2033
- Figure 20: Saudi Arabia MEA Battery Industry Volume (K Unit), by Country 2025 & 2033
- Figure 21: Saudi Arabia MEA Battery Industry Revenue Share (%), by Country 2025 & 2033
- Figure 22: Saudi Arabia MEA Battery Industry Volume Share (%), by Country 2025 & 2033
- Figure 23: United Arab Emirates MEA Battery Industry Revenue (Million), by Type 2025 & 2033
- Figure 24: United Arab Emirates MEA Battery Industry Volume (K Unit), by Type 2025 & 2033
- Figure 25: United Arab Emirates MEA Battery Industry Revenue Share (%), by Type 2025 & 2033
- Figure 26: United Arab Emirates MEA Battery Industry Volume Share (%), by Type 2025 & 2033
- Figure 27: United Arab Emirates MEA Battery Industry Revenue (Million), by Technology 2025 & 2033
- Figure 28: United Arab Emirates MEA Battery Industry Volume (K Unit), by Technology 2025 & 2033
- Figure 29: United Arab Emirates MEA Battery Industry Revenue Share (%), by Technology 2025 & 2033
- Figure 30: United Arab Emirates MEA Battery Industry Volume Share (%), by Technology 2025 & 2033
- Figure 31: United Arab Emirates MEA Battery Industry Revenue (Million), by Application 2025 & 2033
- Figure 32: United Arab Emirates MEA Battery Industry Volume (K Unit), by Application 2025 & 2033
- Figure 33: United Arab Emirates MEA Battery Industry Revenue Share (%), by Application 2025 & 2033
- Figure 34: United Arab Emirates MEA Battery Industry Volume Share (%), by Application 2025 & 2033
- Figure 35: United Arab Emirates MEA Battery Industry Revenue (Million), by Geography 2025 & 2033
- Figure 36: United Arab Emirates MEA Battery Industry Volume (K Unit), by Geography 2025 & 2033
- Figure 37: United Arab Emirates MEA Battery Industry Revenue Share (%), by Geography 2025 & 2033
- Figure 38: United Arab Emirates MEA Battery Industry Volume Share (%), by Geography 2025 & 2033
- Figure 39: United Arab Emirates MEA Battery Industry Revenue (Million), by Country 2025 & 2033
- Figure 40: United Arab Emirates MEA Battery Industry Volume (K Unit), by Country 2025 & 2033
- Figure 41: United Arab Emirates MEA Battery Industry Revenue Share (%), by Country 2025 & 2033
- Figure 42: United Arab Emirates MEA Battery Industry Volume Share (%), by Country 2025 & 2033
- Figure 43: South Africa MEA Battery Industry Revenue (Million), by Type 2025 & 2033
- Figure 44: South Africa MEA Battery Industry Volume (K Unit), by Type 2025 & 2033
- Figure 45: South Africa MEA Battery Industry Revenue Share (%), by Type 2025 & 2033
- Figure 46: South Africa MEA Battery Industry Volume Share (%), by Type 2025 & 2033
- Figure 47: South Africa MEA Battery Industry Revenue (Million), by Technology 2025 & 2033
- Figure 48: South Africa MEA Battery Industry Volume (K Unit), by Technology 2025 & 2033
- Figure 49: South Africa MEA Battery Industry Revenue Share (%), by Technology 2025 & 2033
- Figure 50: South Africa MEA Battery Industry Volume Share (%), by Technology 2025 & 2033
- Figure 51: South Africa MEA Battery Industry Revenue (Million), by Application 2025 & 2033
- Figure 52: South Africa MEA Battery Industry Volume (K Unit), by Application 2025 & 2033
- Figure 53: South Africa MEA Battery Industry Revenue Share (%), by Application 2025 & 2033
- Figure 54: South Africa MEA Battery Industry Volume Share (%), by Application 2025 & 2033
- Figure 55: South Africa MEA Battery Industry Revenue (Million), by Geography 2025 & 2033
- Figure 56: South Africa MEA Battery Industry Volume (K Unit), by Geography 2025 & 2033
- Figure 57: South Africa MEA Battery Industry Revenue Share (%), by Geography 2025 & 2033
- Figure 58: South Africa MEA Battery Industry Volume Share (%), by Geography 2025 & 2033
- Figure 59: South Africa MEA Battery Industry Revenue (Million), by Country 2025 & 2033
- Figure 60: South Africa MEA Battery Industry Volume (K Unit), by Country 2025 & 2033
- Figure 61: South Africa MEA Battery Industry Revenue Share (%), by Country 2025 & 2033
- Figure 62: South Africa MEA Battery Industry Volume Share (%), by Country 2025 & 2033
- Figure 63: Rest of Middle East and Africa MEA Battery Industry Revenue (Million), by Type 2025 & 2033
- Figure 64: Rest of Middle East and Africa MEA Battery Industry Volume (K Unit), by Type 2025 & 2033
- Figure 65: Rest of Middle East and Africa MEA Battery Industry Revenue Share (%), by Type 2025 & 2033
- Figure 66: Rest of Middle East and Africa MEA Battery Industry Volume Share (%), by Type 2025 & 2033
- Figure 67: Rest of Middle East and Africa MEA Battery Industry Revenue (Million), by Technology 2025 & 2033
- Figure 68: Rest of Middle East and Africa MEA Battery Industry Volume (K Unit), by Technology 2025 & 2033
- Figure 69: Rest of Middle East and Africa MEA Battery Industry Revenue Share (%), by Technology 2025 & 2033
- Figure 70: Rest of Middle East and Africa MEA Battery Industry Volume Share (%), by Technology 2025 & 2033
- Figure 71: Rest of Middle East and Africa MEA Battery Industry Revenue (Million), by Application 2025 & 2033
- Figure 72: Rest of Middle East and Africa MEA Battery Industry Volume (K Unit), by Application 2025 & 2033
- Figure 73: Rest of Middle East and Africa MEA Battery Industry Revenue Share (%), by Application 2025 & 2033
- Figure 74: Rest of Middle East and Africa MEA Battery Industry Volume Share (%), by Application 2025 & 2033
- Figure 75: Rest of Middle East and Africa MEA Battery Industry Revenue (Million), by Geography 2025 & 2033
- Figure 76: Rest of Middle East and Africa MEA Battery Industry Volume (K Unit), by Geography 2025 & 2033
- Figure 77: Rest of Middle East and Africa MEA Battery Industry Revenue Share (%), by Geography 2025 & 2033
- Figure 78: Rest of Middle East and Africa MEA Battery Industry Volume Share (%), by Geography 2025 & 2033
- Figure 79: Rest of Middle East and Africa MEA Battery Industry Revenue (Million), by Country 2025 & 2033
- Figure 80: Rest of Middle East and Africa MEA Battery Industry Volume (K Unit), by Country 2025 & 2033
- Figure 81: Rest of Middle East and Africa MEA Battery Industry Revenue Share (%), by Country 2025 & 2033
- Figure 82: Rest of Middle East and Africa MEA Battery Industry Volume Share (%), by Country 2025 & 2033
List of Tables
- Table 1: Global MEA Battery Industry Revenue Million Forecast, by Type 2020 & 2033
- Table 2: Global MEA Battery Industry Volume K Unit Forecast, by Type 2020 & 2033
- Table 3: Global MEA Battery Industry Revenue Million Forecast, by Technology 2020 & 2033
- Table 4: Global MEA Battery Industry Volume K Unit Forecast, by Technology 2020 & 2033
- Table 5: Global MEA Battery Industry Revenue Million Forecast, by Application 2020 & 2033
- Table 6: Global MEA Battery Industry Volume K Unit Forecast, by Application 2020 & 2033
- Table 7: Global MEA Battery Industry Revenue Million Forecast, by Geography 2020 & 2033
- Table 8: Global MEA Battery Industry Volume K Unit Forecast, by Geography 2020 & 2033
- Table 9: Global MEA Battery Industry Revenue Million Forecast, by Region 2020 & 2033
- Table 10: Global MEA Battery Industry Volume K Unit Forecast, by Region 2020 & 2033
- Table 11: Global MEA Battery Industry Revenue Million Forecast, by Type 2020 & 2033
- Table 12: Global MEA Battery Industry Volume K Unit Forecast, by Type 2020 & 2033
- Table 13: Global MEA Battery Industry Revenue Million Forecast, by Technology 2020 & 2033
- Table 14: Global MEA Battery Industry Volume K Unit Forecast, by Technology 2020 & 2033
- Table 15: Global MEA Battery Industry Revenue Million Forecast, by Application 2020 & 2033
- Table 16: Global MEA Battery Industry Volume K Unit Forecast, by Application 2020 & 2033
- Table 17: Global MEA Battery Industry Revenue Million Forecast, by Geography 2020 & 2033
- Table 18: Global MEA Battery Industry Volume K Unit Forecast, by Geography 2020 & 2033
- Table 19: Global MEA Battery Industry Revenue Million Forecast, by Country 2020 & 2033
- Table 20: Global MEA Battery Industry Volume K Unit Forecast, by Country 2020 & 2033
- Table 21: Global MEA Battery Industry Revenue Million Forecast, by Type 2020 & 2033
- Table 22: Global MEA Battery Industry Volume K Unit Forecast, by Type 2020 & 2033
- Table 23: Global MEA Battery Industry Revenue Million Forecast, by Technology 2020 & 2033
- Table 24: Global MEA Battery Industry Volume K Unit Forecast, by Technology 2020 & 2033
- Table 25: Global MEA Battery Industry Revenue Million Forecast, by Application 2020 & 2033
- Table 26: Global MEA Battery Industry Volume K Unit Forecast, by Application 2020 & 2033
- Table 27: Global MEA Battery Industry Revenue Million Forecast, by Geography 2020 & 2033
- Table 28: Global MEA Battery Industry Volume K Unit Forecast, by Geography 2020 & 2033
- Table 29: Global MEA Battery Industry Revenue Million Forecast, by Country 2020 & 2033
- Table 30: Global MEA Battery Industry Volume K Unit Forecast, by Country 2020 & 2033
- Table 31: Global MEA Battery Industry Revenue Million Forecast, by Type 2020 & 2033
- Table 32: Global MEA Battery Industry Volume K Unit Forecast, by Type 2020 & 2033
- Table 33: Global MEA Battery Industry Revenue Million Forecast, by Technology 2020 & 2033
- Table 34: Global MEA Battery Industry Volume K Unit Forecast, by Technology 2020 & 2033
- Table 35: Global MEA Battery Industry Revenue Million Forecast, by Application 2020 & 2033
- Table 36: Global MEA Battery Industry Volume K Unit Forecast, by Application 2020 & 2033
- Table 37: Global MEA Battery Industry Revenue Million Forecast, by Geography 2020 & 2033
- Table 38: Global MEA Battery Industry Volume K Unit Forecast, by Geography 2020 & 2033
- Table 39: Global MEA Battery Industry Revenue Million Forecast, by Country 2020 & 2033
- Table 40: Global MEA Battery Industry Volume K Unit Forecast, by Country 2020 & 2033
- Table 41: Global MEA Battery Industry Revenue Million Forecast, by Type 2020 & 2033
- Table 42: Global MEA Battery Industry Volume K Unit Forecast, by Type 2020 & 2033
- Table 43: Global MEA Battery Industry Revenue Million Forecast, by Technology 2020 & 2033
- Table 44: Global MEA Battery Industry Volume K Unit Forecast, by Technology 2020 & 2033
- Table 45: Global MEA Battery Industry Revenue Million Forecast, by Application 2020 & 2033
- Table 46: Global MEA Battery Industry Volume K Unit Forecast, by Application 2020 & 2033
- Table 47: Global MEA Battery Industry Revenue Million Forecast, by Geography 2020 & 2033
- Table 48: Global MEA Battery Industry Volume K Unit Forecast, by Geography 2020 & 2033
- Table 49: Global MEA Battery Industry Revenue Million Forecast, by Country 2020 & 2033
- Table 50: Global MEA Battery Industry Volume K Unit Forecast, by Country 2020 & 2033
Frequently Asked Questions
1. What is the projected Compound Annual Growth Rate (CAGR) of the MEA Battery Industry?
The projected CAGR is approximately > 7.00%.
2. Which companies are prominent players in the MEA Battery Industry?
Key companies in the market include EnerSys, East Penn Manufacturing Co Inc, Exide Industries Ltd, Amara Raja Batteries Ltd, Middle East Battery Company (MEBCO), C&D Technologies Inc, First National Battery Pty Ltd, SAFT GROUPE SA, Panasonic Corporation.
3. What are the main segments of the MEA Battery Industry?
The market segments include Type, Technology, Application, Geography.
4. Can you provide details about the market size?
The market size is estimated to be USD 7.06 Million as of 2022.
5. What are some drivers contributing to market growth?
4.; Declining lithium-ion battery prices4.; Increasing adoption of electric vehicles.
6. What are the notable trends driving market growth?
Automotive Batteries Segment to Witness Significant Growth.
7. Are there any restraints impacting market growth?
4.; Demand-supply mismatch of raw materials.
8. Can you provide examples of recent developments in the market?
Aug 2023: Mahindra & Mahindra, India's fourth largest car manufacturer, unveiled the electric version of the Thar SUV at an event in South Africa. Apart from the Thar.e, Mahindra also unveiled seven new tractor models at the event in Cape Town, South Africa.
9. What pricing options are available for accessing the report?
Pricing options include single-user, multi-user, and enterprise licenses priced at USD 4750, USD 5250, and USD 8750 respectively.
10. Is the market size provided in terms of value or volume?
The market size is provided in terms of value, measured in Million and volume, measured in K Unit.
11. Are there any specific market keywords associated with the report?
Yes, the market keyword associated with the report is "MEA Battery Industry," which aids in identifying and referencing the specific market segment covered.
12. How do I determine which pricing option suits my needs best?
The pricing options vary based on user requirements and access needs. Individual users may opt for single-user licenses, while businesses requiring broader access may choose multi-user or enterprise licenses for cost-effective access to the report.
13. Are there any additional resources or data provided in the MEA Battery Industry report?
While the report offers comprehensive insights, it's advisable to review the specific contents or supplementary materials provided to ascertain if additional resources or data are available.
14. How can I stay updated on further developments or reports in the MEA Battery Industry?
To stay informed about further developments, trends, and reports in the MEA Battery Industry, consider subscribing to industry newsletters, following relevant companies and organizations, or regularly checking reputable industry news sources and publications.
Methodology
Step 1 - Identification of Relevant Samples Size from Population Database


Step 2 - Approaches for Defining Global Market Size (Value, Volume* & Price*)

Note*: In applicable scenarios
Step 3 - Data Sources
Primary Research
- Web Analytics
- Survey Reports
- Research Institute
- Latest Research Reports
- Opinion Leaders
Secondary Research
- Annual Reports
- White Paper
- Latest Press Release
- Industry Association
- Paid Database
- Investor Presentations

Step 4 - Data Triangulation
Involves using different sources of information in order to increase the validity of a study
These sources are likely to be stakeholders in a program - participants, other researchers, program staff, other community members, and so on.
Then we put all data in single framework & apply various statistical tools to find out the dynamic on the market.
During the analysis stage, feedback from the stakeholder groups would be compared to determine areas of agreement as well as areas of divergence

